Data is everywhere, and you might often feel overwhelmed by complex numbers and raw stats. There’s a direct way to turn messy numbers into clear stories– data storytelling with web scraping.
This article will guide you through key points related to data storytelling, basic tools, and some best practices for solving data-related problems.
What is Data Storytelling with Web Scraping?
Data storytelling with web scraping is a method that enables you to use web scraping techniques to gather data and then craft a clear, engaging story from it.
Using this method, you can turn raw data into a format that people can easily understand. Generally, it involves two main parts:
- Web Scraping: The process of automatically extracting large volumes of structured data from websites.
- Data Storytelling: The art of turning complex data into accessible insights using a mix of narrative and clear visuals explaining what the numbers really mean.
Whether it’s a competitive analysis, a public health trend, or a product strategy, together, these techniques can transform messy rows of numbers into stories with purpose.
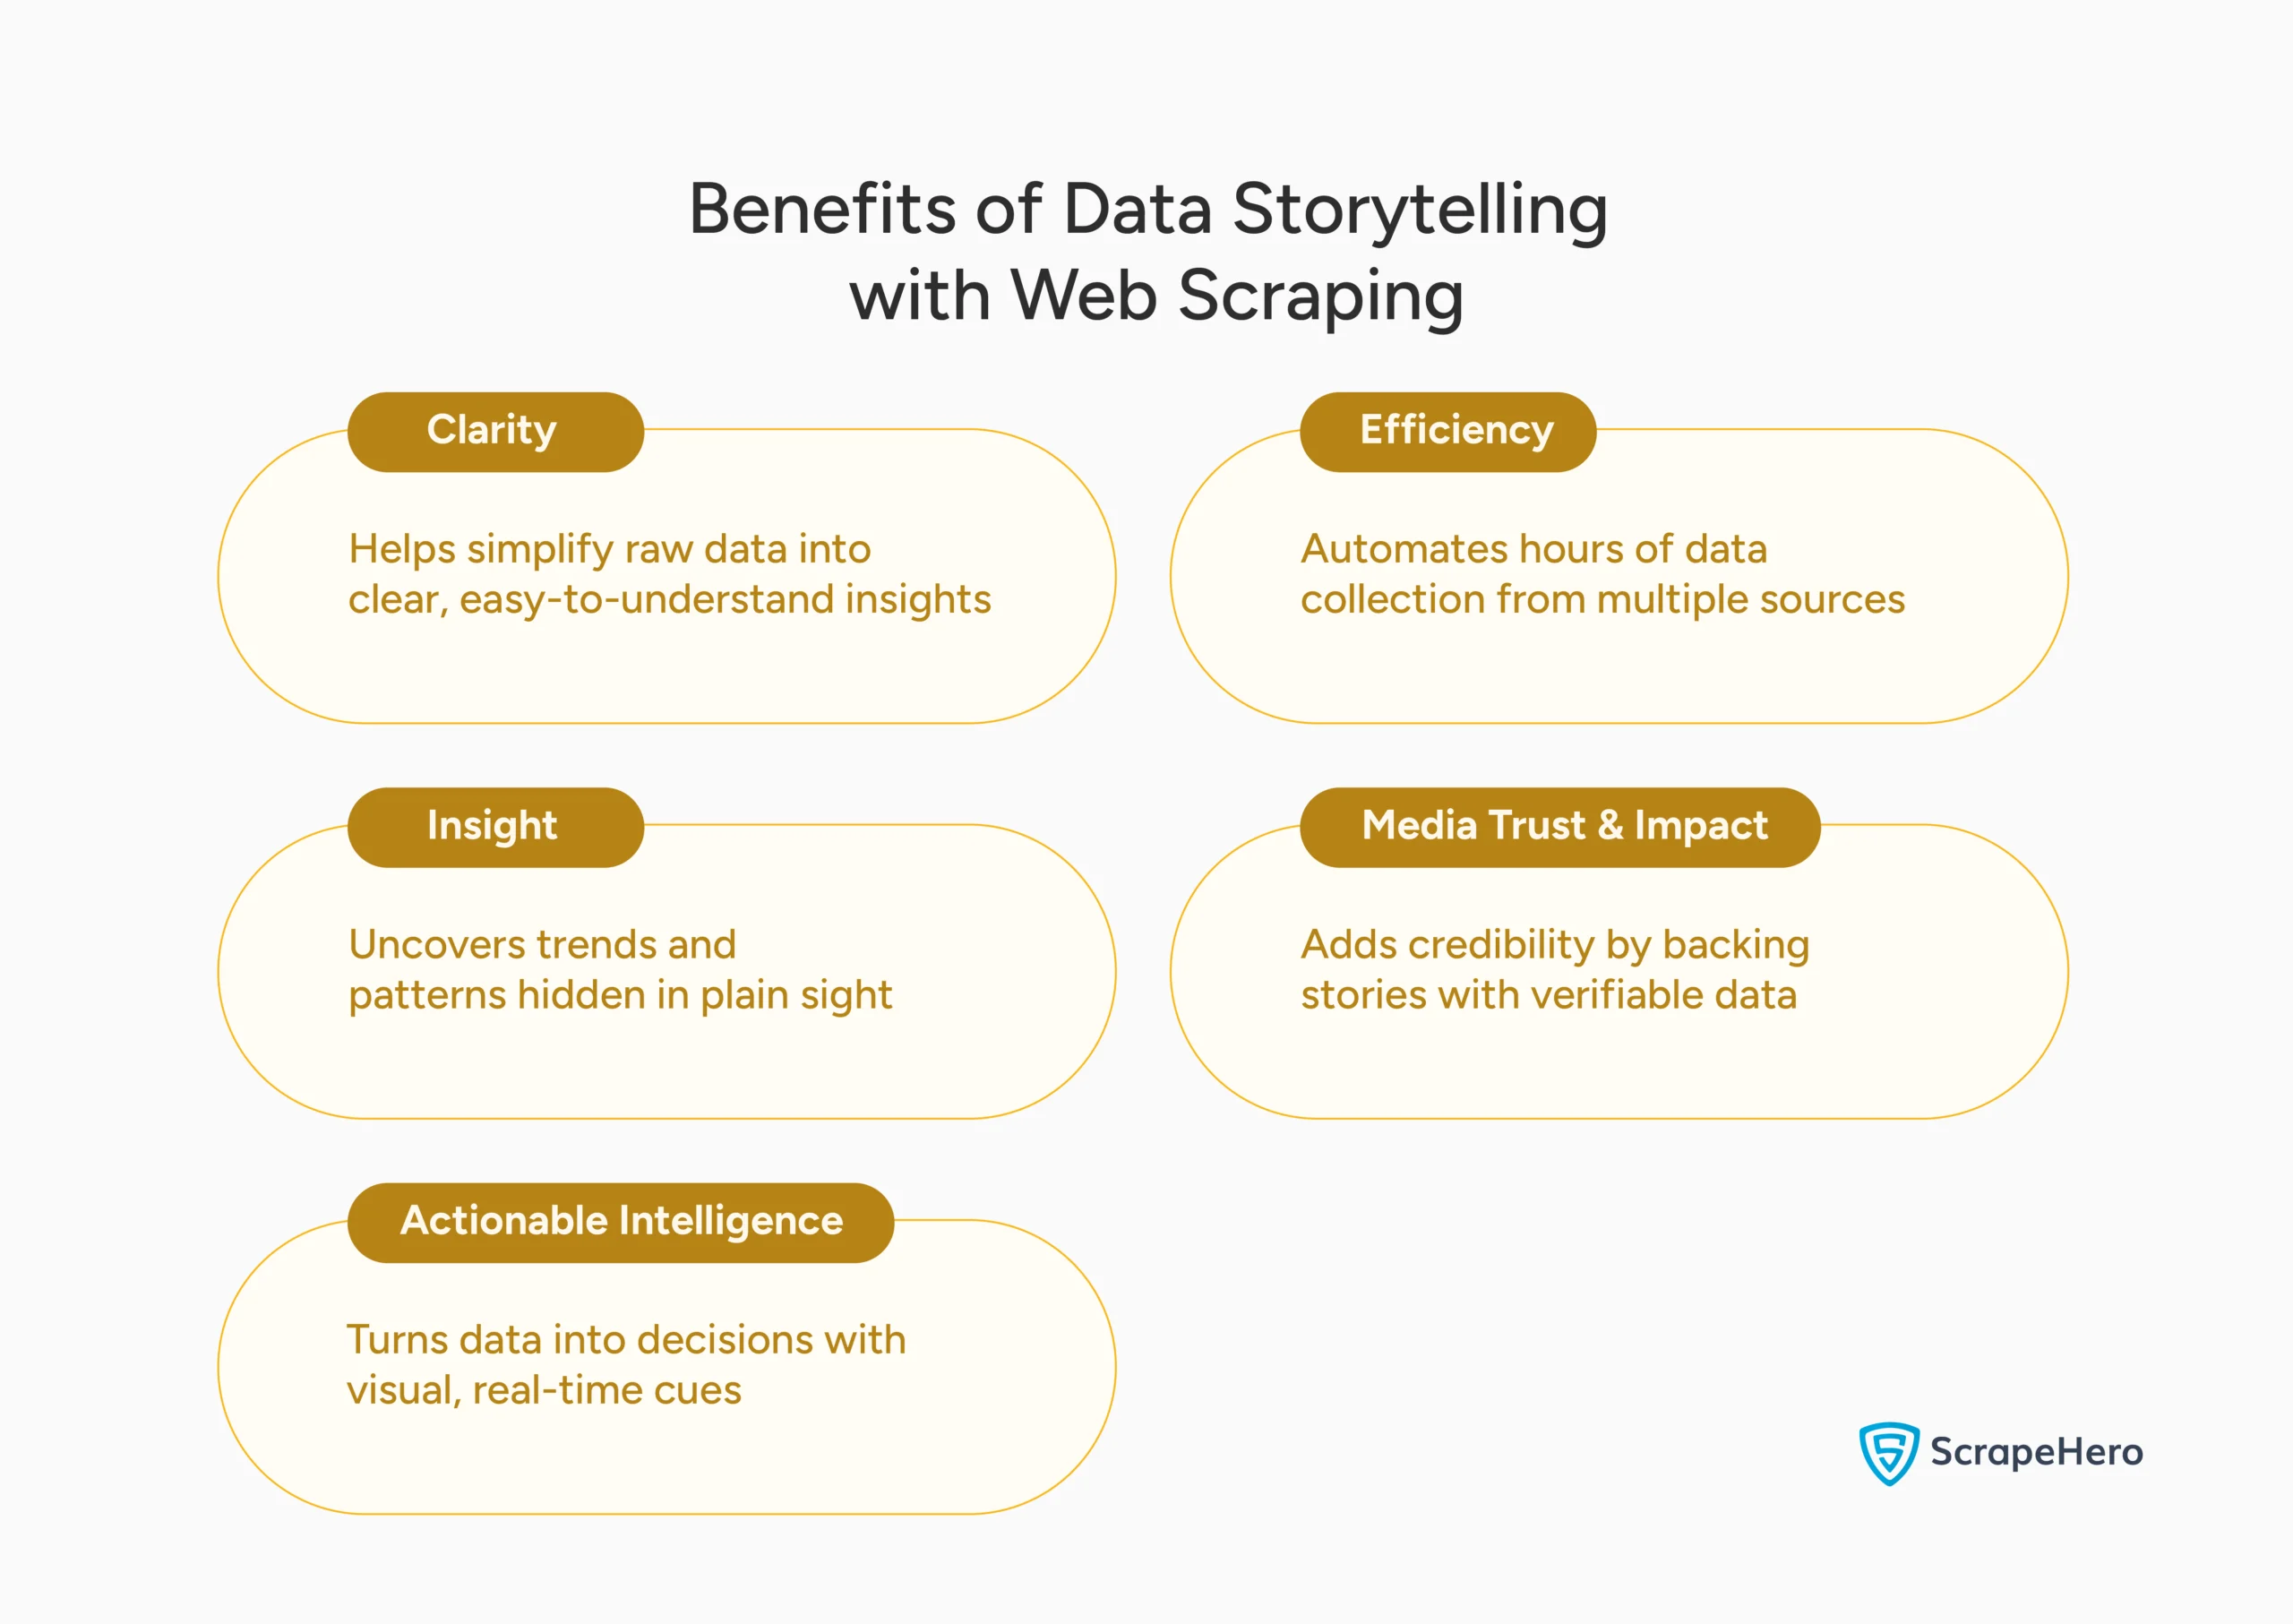
What are the Benefits of Data Storytelling with Web Scraping
Here are some benefits of data storytelling with web scraping. From clarity to actionability, these benefits help teams move faster and decide smarter.
- Clarity
- Efficiency
- Insight
- Actionable Intelligence
- Media Trust & Impact
1. Clarity
Even though web scraping provides structured, up-to-date data at scale, this raw data alone is not meaningful to decision makers.
The noise must be removed, and attention should be directed to the key message. Visualizing thousands of scraped reviews can instantly surface recurring customer pain points, enabling quicker understanding.
For example, a D2C skincare brand scraping 50,000 customer reviews across Amazon and Walmart can visualize the top recurring complaints—”smell,” “packaging leak,” and “price” instead of showing a wall of sentiment scores.
Decision makers can use this insight to inform packaging redesign and improve product-market fit.
2. Efficiency
Manual data collection from the web is not only time-consuming but also unsustainable. Web scraping helps businesses monitor hundreds of competitor prices across channels in real time.
This, in fact, frees up internal resources and shortens the time from data collection to actionable insight.
For example, a global consumer electronics brand can automate price tracking on Amazon and Walmart using web scraping.
So, when competitor prices drop below MAP, alerts are triggered, enabling the brand to respond instantly and enforce pricing policy or launch counter-discounts.
3. Insight
If you pair scraped data with analysis and storytelling, it can reveal patterns that are otherwise hidden.
If you monitor review volume and sentiment over time, it can highlight seasonal demand shifts or product fatigue—insights that influence product strategy, marketing timing, or even R&D decisions.
For example, suppose a nutritional supplement startup analyzes scraped reviews from its listings and those of its top 5 competitors.
Over the past year, they have discovered that certain flavors experience a drop in sentiment in summer, likely due to spoilage or shipping issues. Formulation changes and season-specific packaging improvements can address this.
4. Actionable Intelligence
Great stories move people to act. If you can structure real-time scraped data into dashboards or reports, it can empower teams to adjust pricing, reposition offers, or prioritize fixes based on clear indicators. One click can turn insight into action.
An example is when a pet food brand tracks stock availability and reviews of competing products weekly and discovers that a best-selling brand’s dog treat line goes out of stock.
They can immediately ramp up ads and discounting for similar products, capturing market share within 48 hours.
5. Media Trust and Impact
Data storytelling adds credibility, especially in the context of journalism and corporate communications.
Stories carry authority when they are based on independently scraped data. In an era of rampant misinformation, this not only builds trust but also satisfies the growing demand for transparency and evidence-led narratives.
For example, a fintech brand can use scraped data from regulatory sites and peer platforms to illustrate gaps in transparency around lending rates.
They can create whitepapers backed by clear visuals and footnoted sources, gain industry coverage, and establish the brand’s thought leadership.
Power your journalism with accurate, structured web data through our custom scraping solutions—designed to gather research data and generate insightful analyses and reports.
Tools and Techniques for Data Storytelling with Web Scraping
Web Scraping Tools
Web scraping tools can automate the process of extracting structured data from websites at scale. They are helpful in collecting real-time information, like pricing, reviews, and product listings, without manual effort. Some web scraping tools include:
- ScrapeHero Cloud
- BeautifulSoup
- Selenium
- Google Sheets IMPORTHTML
1. ScrapeHero Cloud
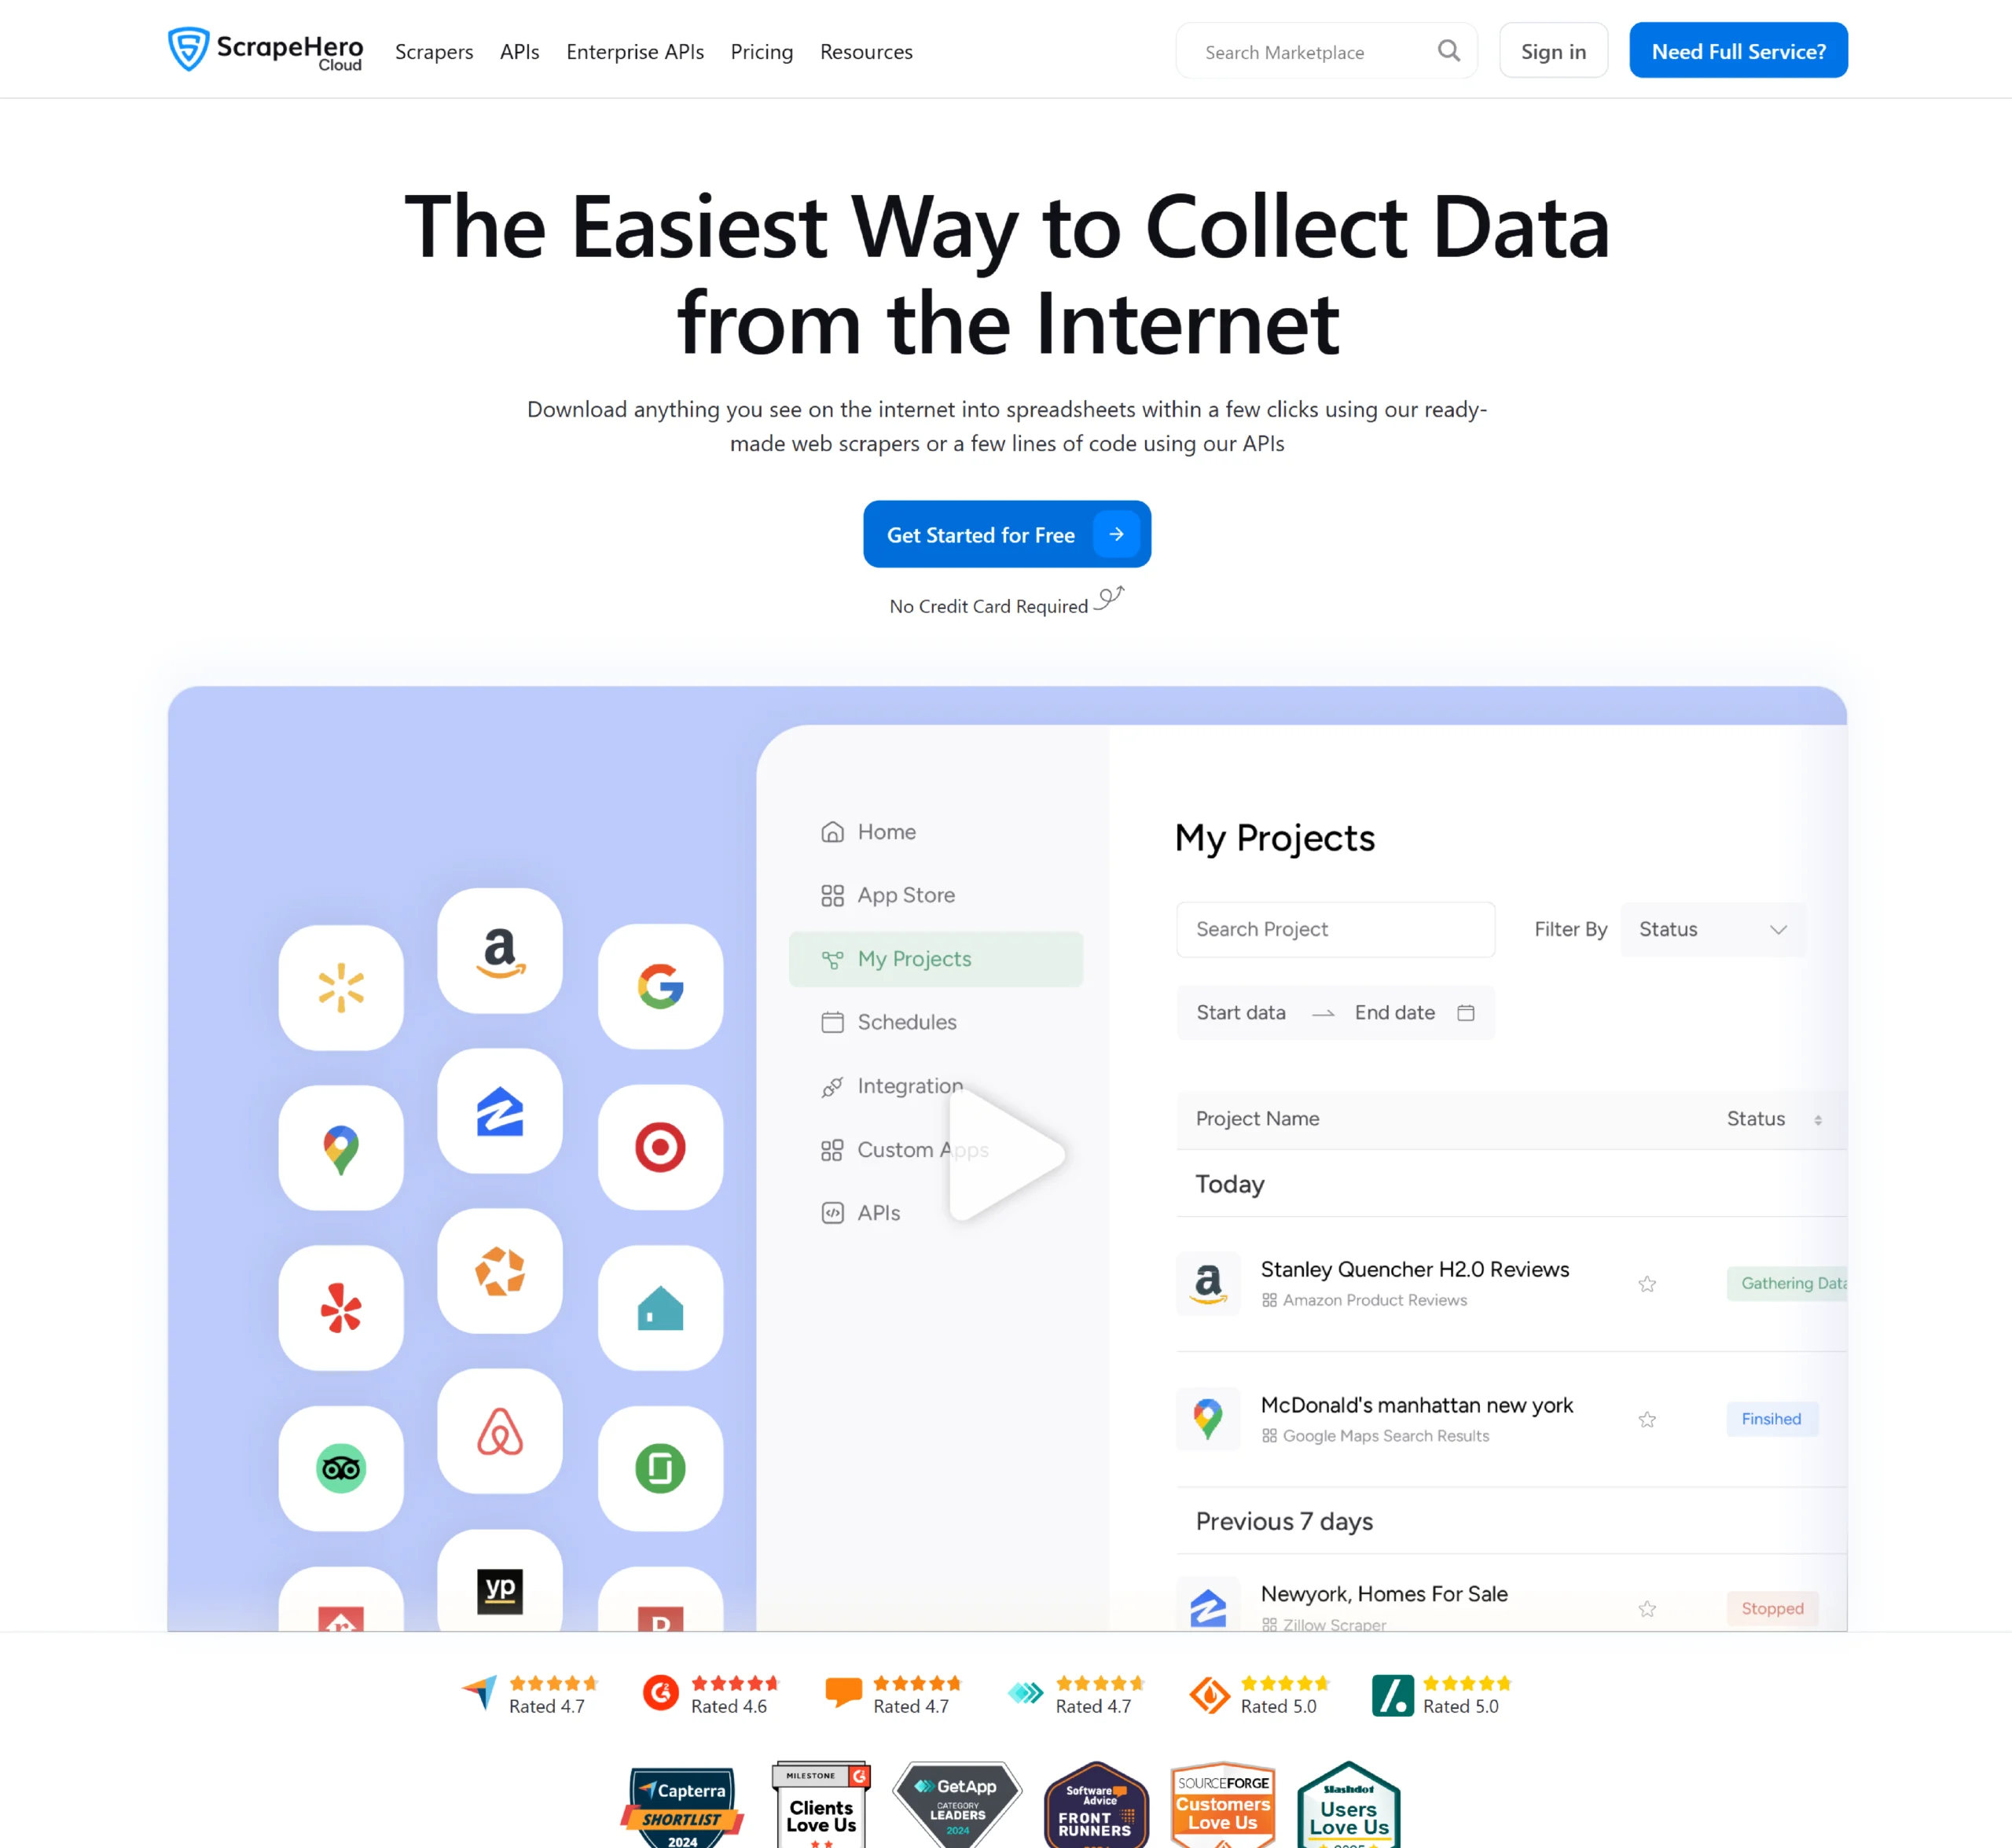
ScrapeHero Cloud is a no-code web scraping platform designed for those without coding experience. If you require fast, reliable access to web data, you can use the pre-built scrapers and real-time APIs to extract data in just a few clicks.
Web scraping challenges, such as anti-bot blocking, structural website changes, or script maintenance, are taken care of. You can also schedule scrapers to run hourly, daily, or weekly, with automatic data delivery to Dropbox or direct download.
2. BeautifulSoup
BeautifulSoup is a Python library that gives developers granular control over scraping logic. It is easy to use for parsing HTML and extracting specific elements.
Brands often make use of BeautifulSoup for internal dashboards or competitive monitoring systems.
3. Selenium
To scrape JavaScript-rendered content or dynamic websites that load elements only upon interaction, you require Selenium.
It is beneficial for scraping data from complex web apps and online marketplaces with dynamic filters, simulating real user behavior like clicking and scrolling.
4. Google Sheets IMPORTHTML
Google Sheets offers a simple IMPORTHTML function that pulls tables or lists directly into a spreadsheet. It is helpful for non-technical users.
It is ideal for small-scale, quick scrapes, such as pulling product data, exchange rates, or event listings from a single page.
Data Visualization Tools
Data visualization tools can turn raw or scraped data into clear, visual formats like charts, graphs, and dashboards. They are helpful for decision-makers to spot trends and take faster, more confident action. Some visualization tools include:
- Tableau / Power BI
- Python Libraries (Matplotlib, Seaborn, Plotly)
- InstantAPI.ai
1. Tableau / Power BI
Tableau and Power BI are business intelligence platforms that allow teams to build interactive dashboards using scraped data.
They are suitable for those who want drill-down views on KPIs like competitor pricing and sentiment trends, as they both support real-time data refresh and easy sharing.
2. Python Libraries (Matplotlib, Seaborn, Plotly)
Python libraries such as Matplotlib and Seaborn can create static and statistical plots, which are more technical or customizable visualizations.
Plotly can support interactive, web-based visuals and is widely used for internal analytics, investor reporting, and technical exploration of scraped datasets.
3. InstantAPI.ai
InstantAPI.ai is built for fast integration, real-time updates, and natural language querying. It combines scraping and AI-powered dashboards in one platform.
Brands can use InstantAPI.ai to build monitoring tools without needing separate engineering and analytics teams.
Data Storytelling Techniques
Data storytelling techniques can turn complex data into clear, engaging narratives that help in understanding the data better and making decisions. Here are some methods:
- Define a hypothesis or key question
- Scrape structured data from trusted sources
- Clean and merge the data using tools like Pandas
- Visualize with a specific narrative focus
- Use humor, motion, or interactivity for engagement
1. Define a Hypothesis or Key Question
You can start with a specific goal or question, such as “what features cause the most negative reviews?”
When you have clear hypotheses, the more focused scraping and more impactful stories.
2. Scrape Structured Data From Trusted Sources
You should focus on platforms such as ScrapeHero Cloud, where the data schema is reliable. You can use scrapers such as Amazon Product Details and Pricing Scraper or Zillow Scraper.
Also, try to avoid scraping data from sources with inconsistent formatting or legal restrictions.
3. Clean and Merge the Data Using Tools Like Pandas
Once you scrape, remove duplicates, normalize formats, and merge multiple datasets using tools like Python’s Pandas.
Clean data ensures accurate analysis and reliable insights, which is very critical for decision-making.
4. Visualize With a Specific Narrative Focus
Visuals should always support the story. For example, if you need to clarify where inventory needs to shift, it is better to present the data in a heat map showing product demand by geography.
Also, avoid visual clutter. Always stick to charts that communicate the core message to prevent miscommunication and unwanted knowledge.
5. Use Humor, Motion, or Interactivity for Engagement
Depending on the audience, you can add a layer of interactivity or even playful design to increase retention.
You might have seen data stories like those from The Pudding or visualizations on Reddit’s r/dataisbeautiful, which often go viral—they’re insightful and entertaining.
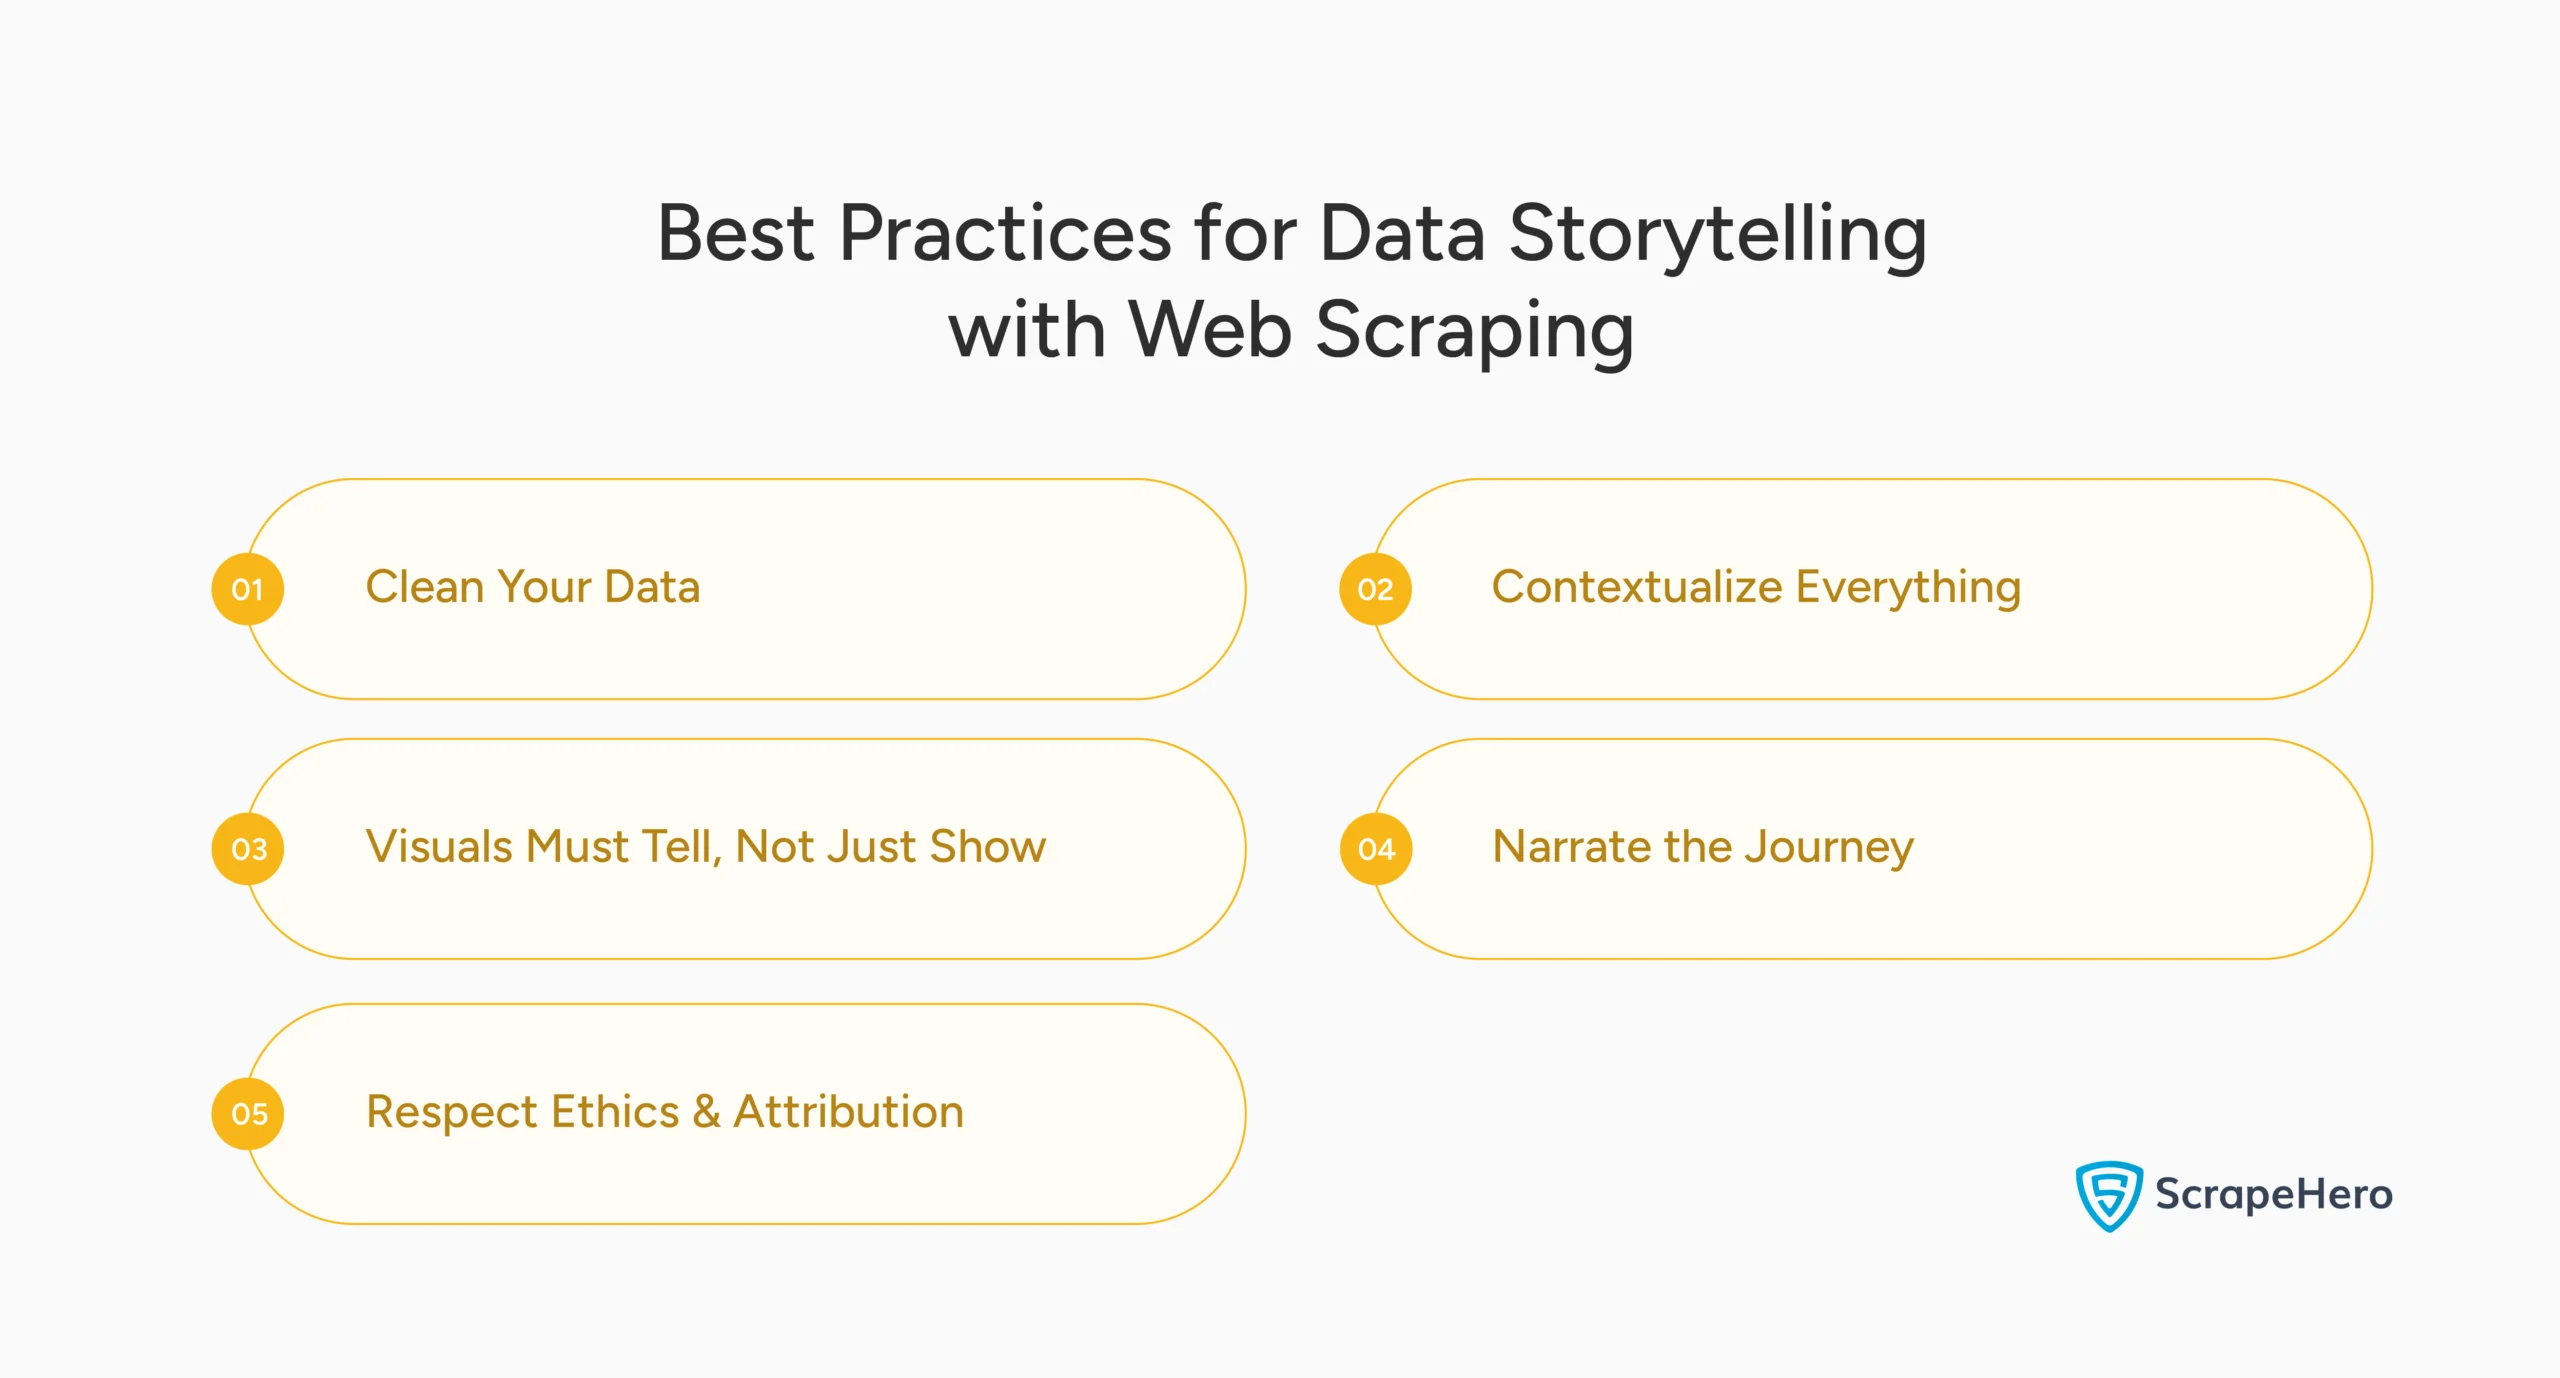
What are Some Best Practices for Data Storytelling with Web Scraping
Following some best practices can ensure that data storytelling with web scraping is accurate, ethical, and impactful. Here are some of these practices:
- Clean Your Data
- Contextualize Everything
- Visuals Must Tell, Not Just Show
- Narrate the Journey
- Respect Ethics & Attribution
1. Clean Your Data
Data cleaning is essential as unstructured or inconsistent data can lead to misleading visuals. You can use Python’s Pandas to clean, deduplicate, and format scraped data.
2. Contextualize Everything
Make sure you provide the background, whether the data is local, global, recent, or historical. If a trend is visible, ask why it happened. If possible, also add per capita adjustments or caveats as needed.
3. Visuals Must Tell, Not Just Show
Avoid pie charts with too many segments, as they can be misleading. Match the visual type to the data—line charts for trends, bar charts for comparisons, and maps for geography.
4. Narrate the Journey
To narrate the journey, you can use a classic structure: setting, characters, conflict, and resolution. Always introduce the reader to the data, what it means, and what action they should take next.
5. Respect Ethics & Attribution
You should always cite your data sources. Do not scrape content behind paywalls or without consent. Also, ensure your analysis doesn’t reinforce bias or misrepresent segments.
Why Do You Need ScrapeHero Web Scraping Service?
You need better data to tell better stories. Better data means raw, accurate, and structured information.
Data storytelling with web scraping is no longer optional—it’s essential. Accurate and precise data can help you monitor competitors, track prices, analyze reviews, or fuel your next data story.
With the ScrapeHero web scraping service, you get clean, real-time data from the web that you can visualize clearly, turning data into decisions.
With a decade of experience in web scraping, we handle data collection with accuracy, allowing you to focus on your business.
Frequently Asked Questions
Data storytelling with web scraping is a method that uses automated tools to gather data from websites and present it as stories through visuals and context. This enables a better understanding of the data, leading to decision-making.
Strategic data storytelling is the method of deliberately using data narratives to influence business decisions and align with organizational goals. It combines relevant metrics, context, and visuals to drive targeted action from specific audiences.
Data visualization in web scraping is the process of turning scraped data into charts, graphs, or dashboards, which simplify complex datasets and make patterns and insights easier to interpret and act upon.