According to a study by MIT, data visualization improves decision-making efficiency by up to 28% (MIT Sloan).
Price monitoring with the support of data visualization is crucial for staying competitive. You can create your dashboards using tools like Microsoft Power BI, Tableau, or Looker Studio (Google Data Studio).
By visualizing scraped product data, you can easily spot trends, identify pricing gaps, and make informed decisions.
This article will help you create a price monitoring dashboard without coding using the data that you scrape from e-commerce sites like Amazon, Walmart, and Target, ensuring accurate, real-time insights into pricing.
Gathering Product Data
Let us begin with data collection.
To extract product data from Amazon, Walmart, and Target, you can use the no-code scrapers from ScrapeHero Cloud.
For example, here are the steps to gather data from Amazon.
1. Sign up or log in to your ScrapeHero Cloud account.
2. Go to the Amazon Search Results Scraper by ScrapeHero Cloud
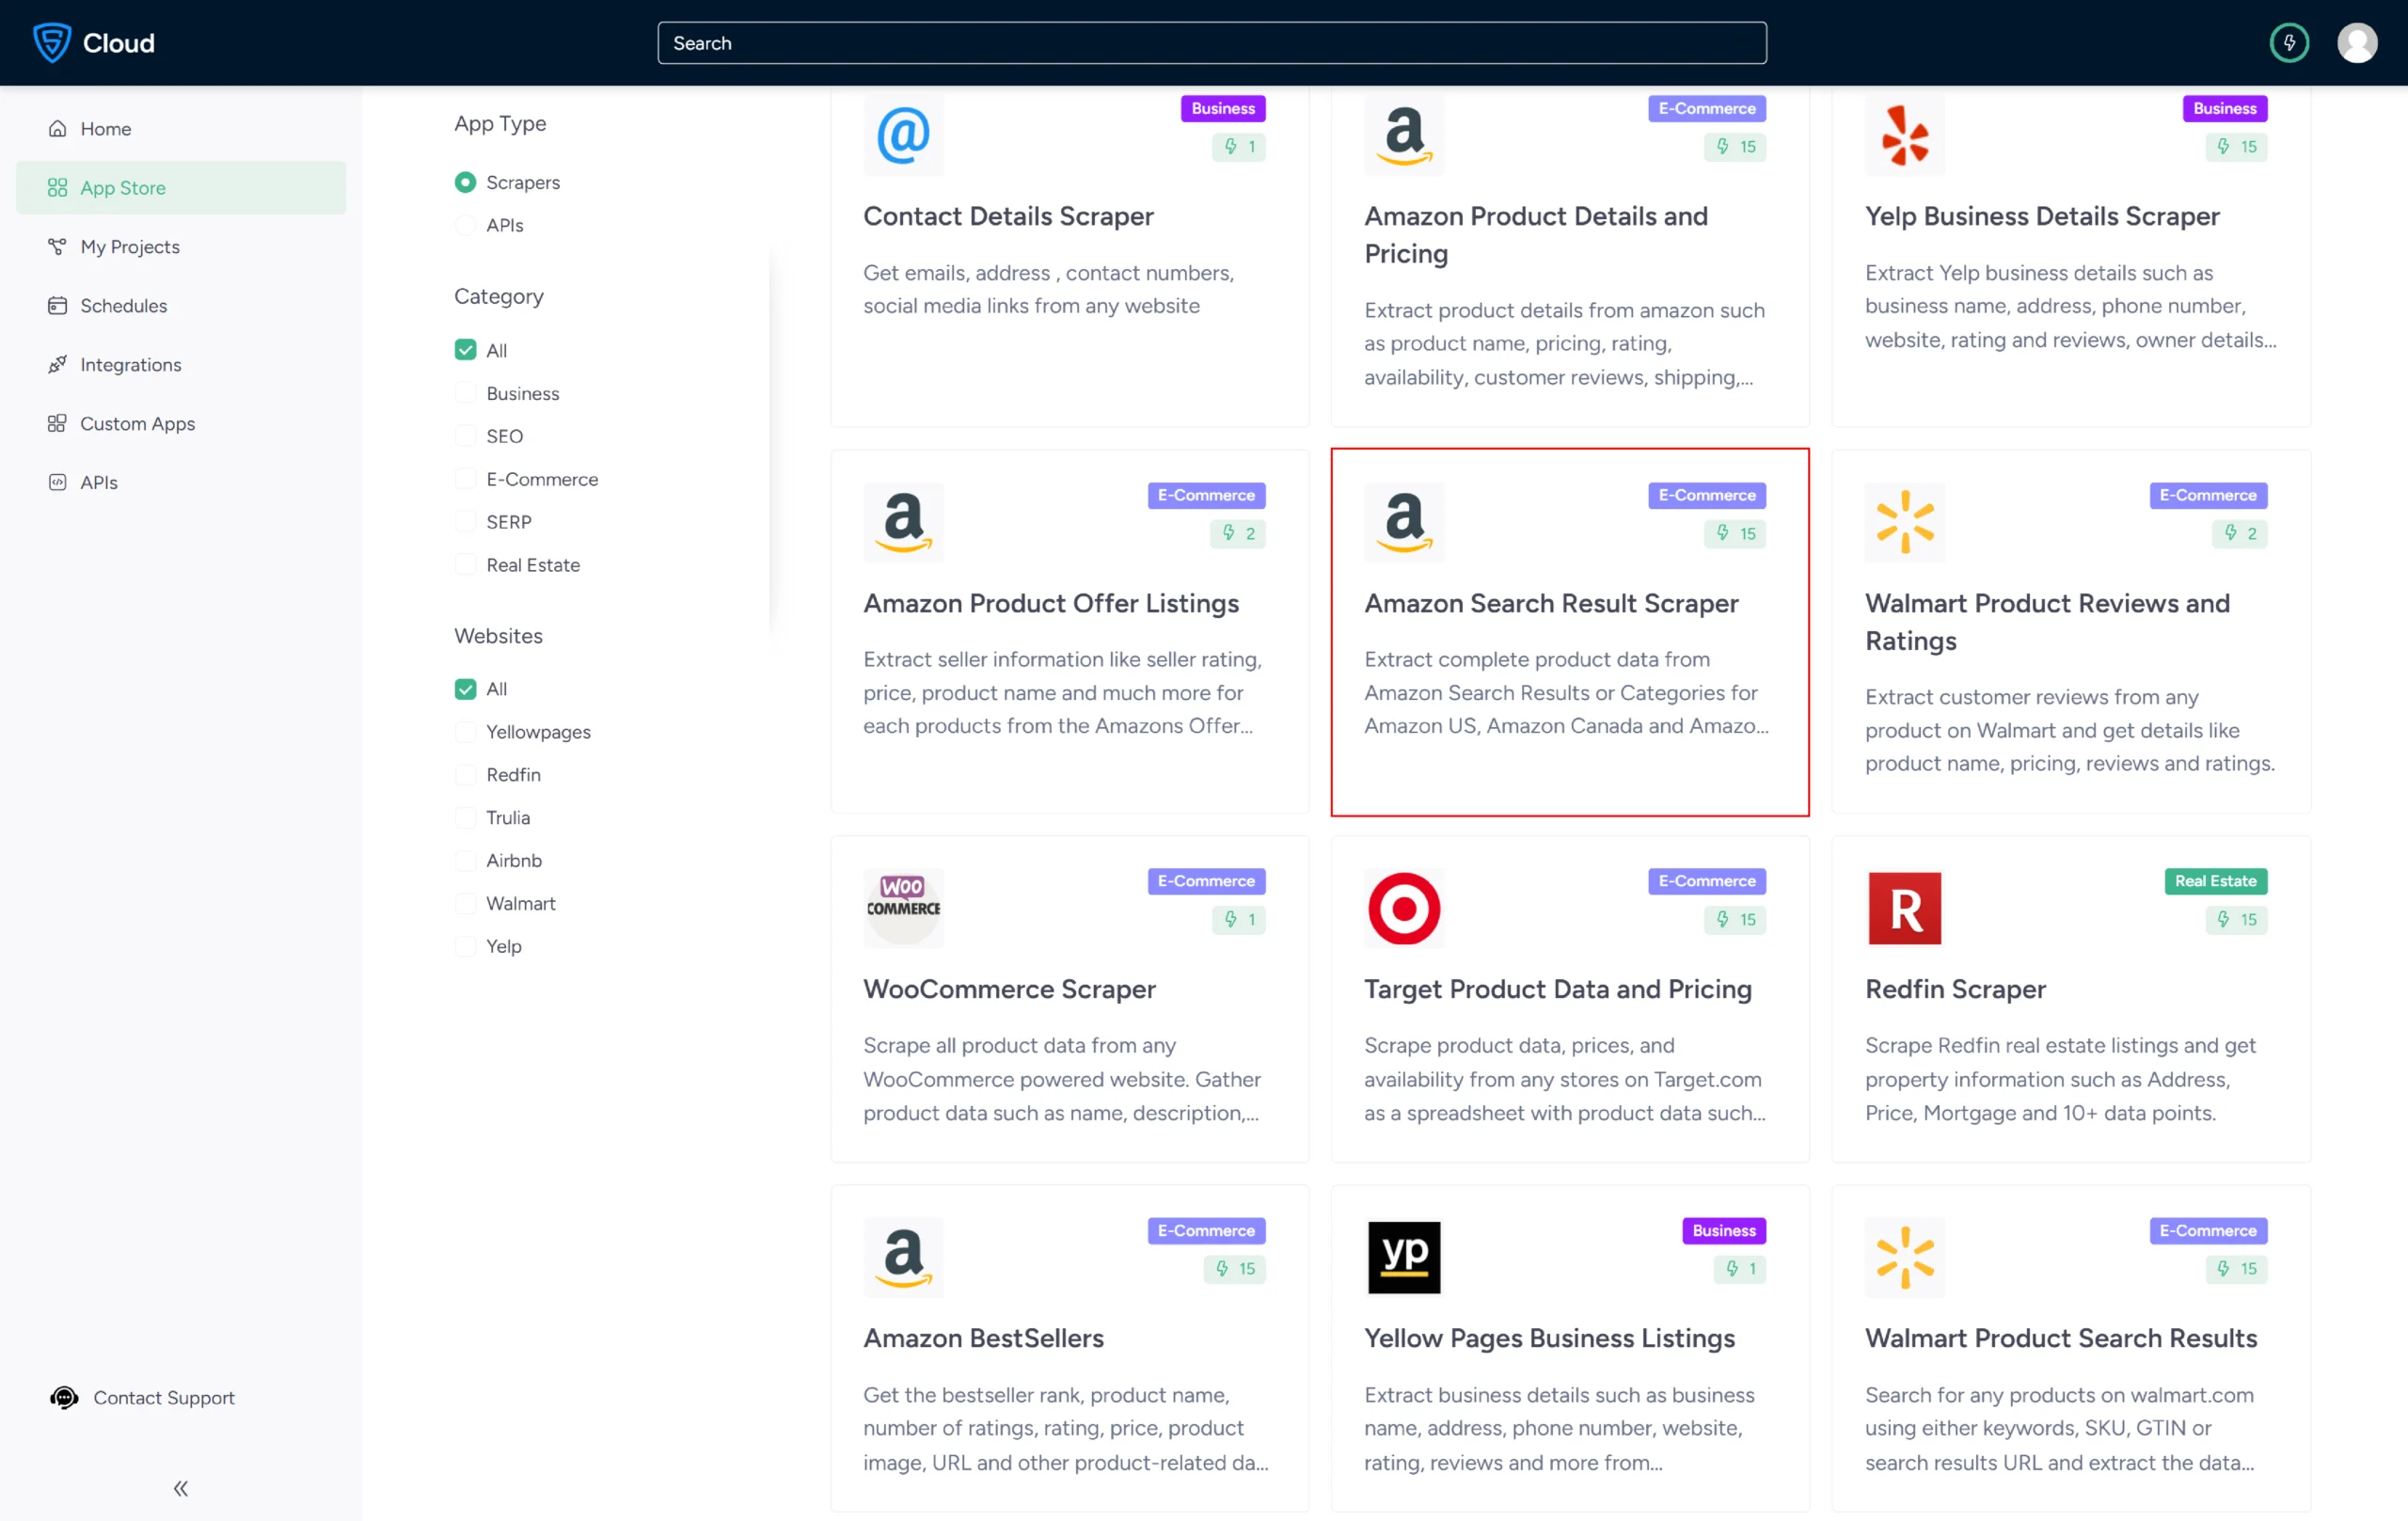
3. Click the Create New Project button.
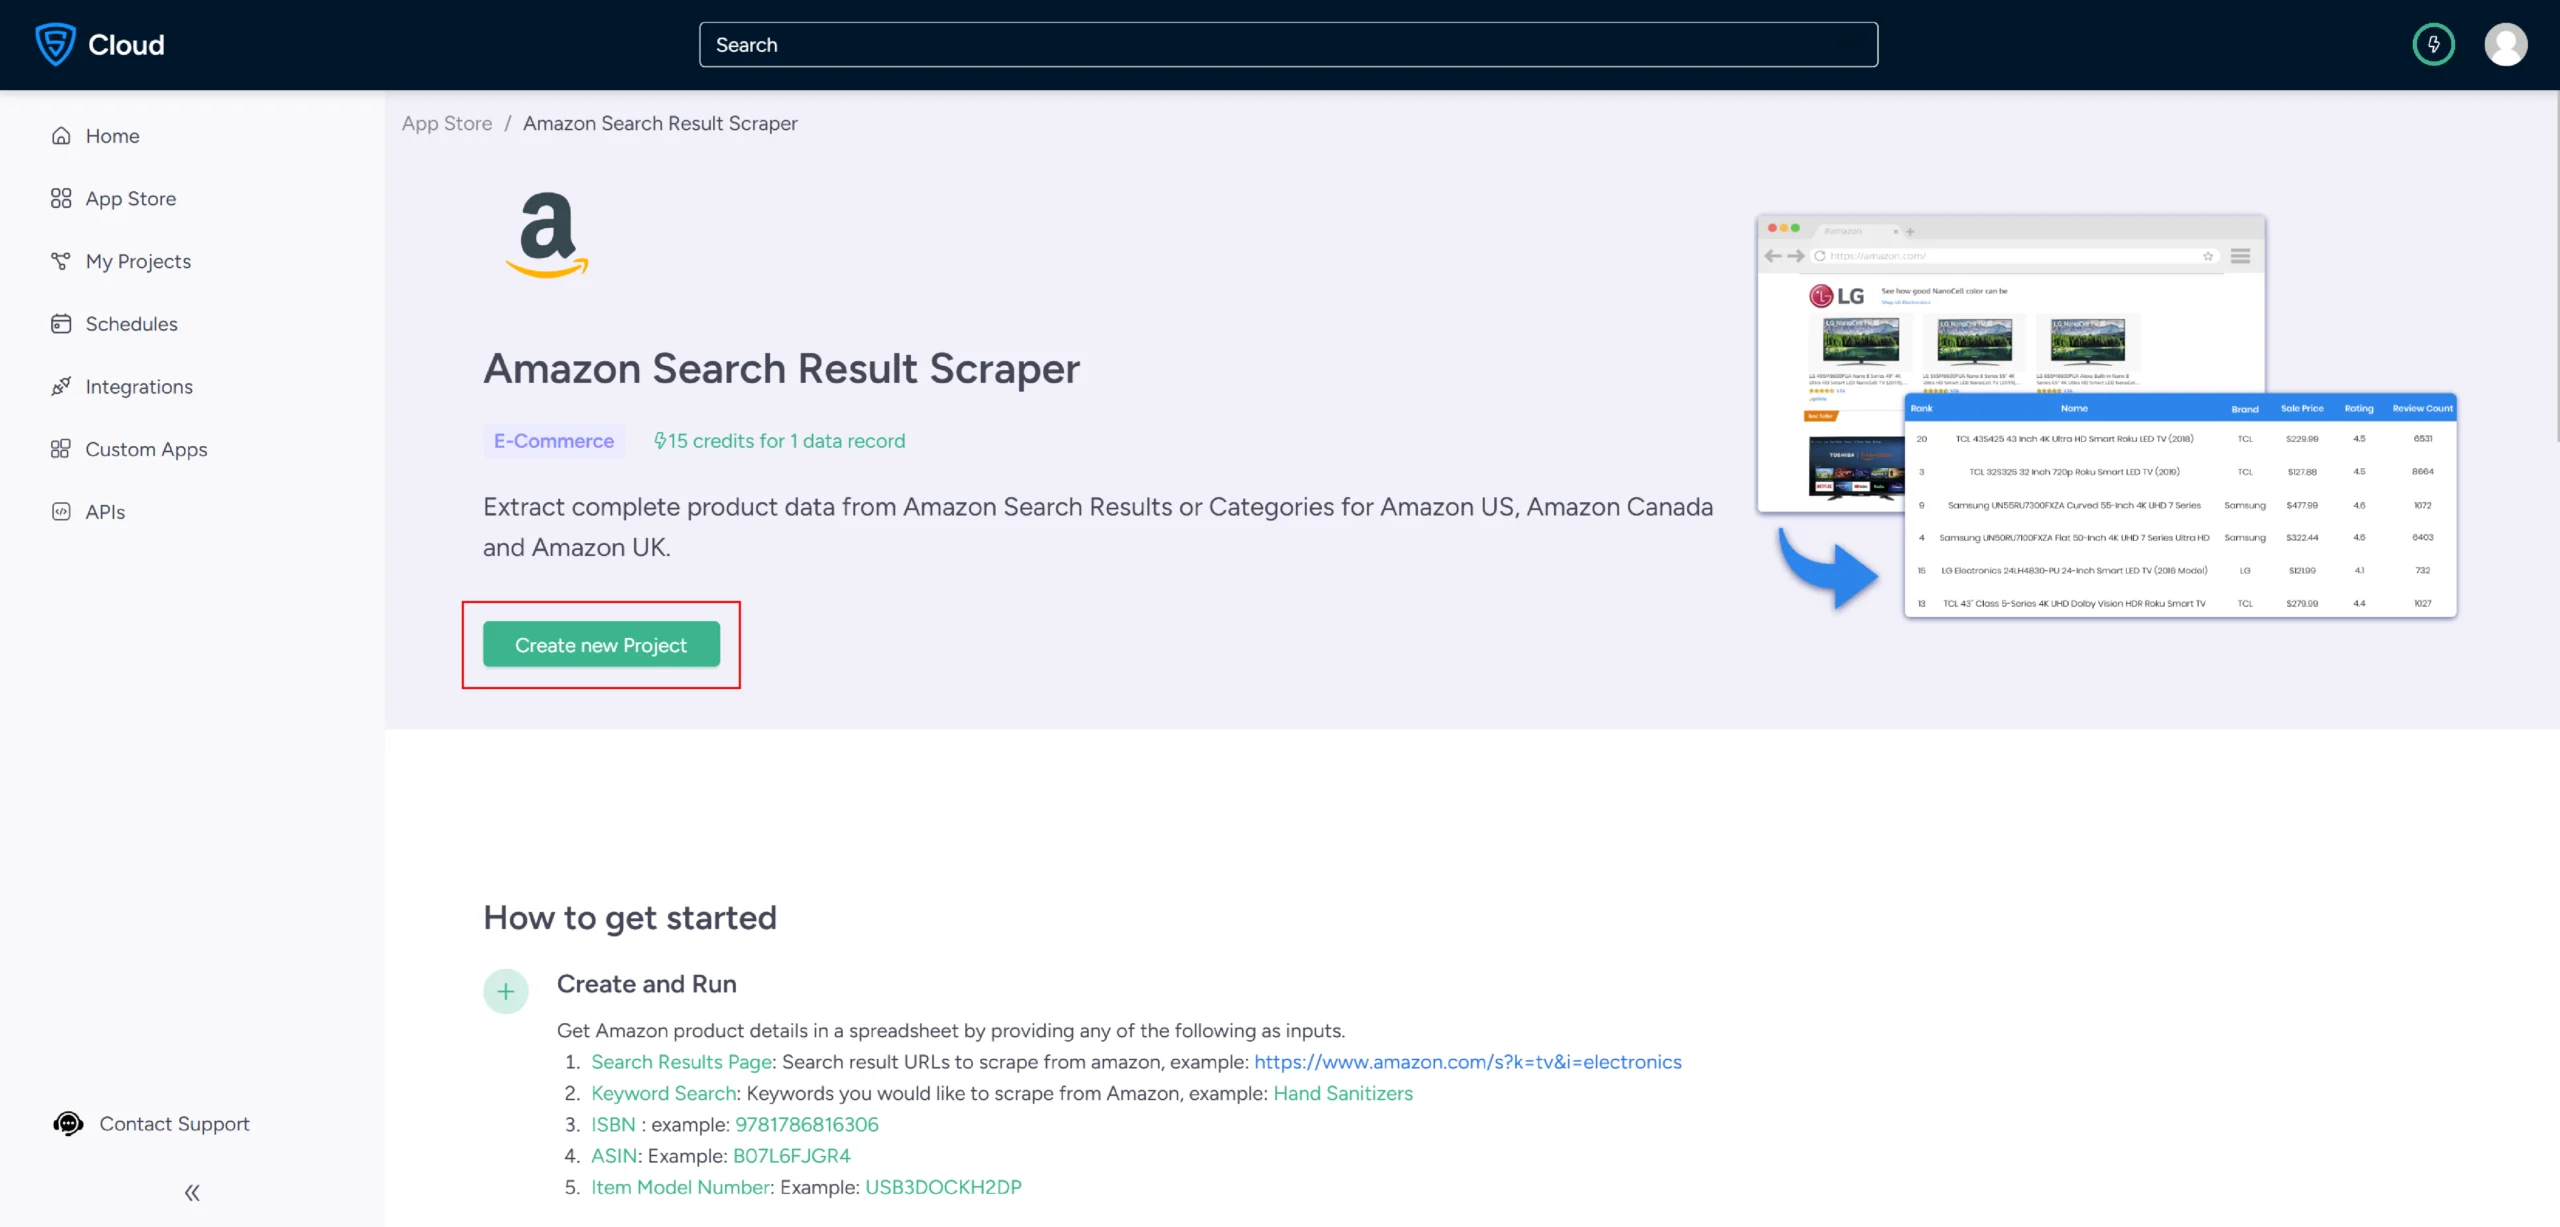
4. To scrape the details, you need to provide a product URL. You can get the product URL from the Amazon search results page.
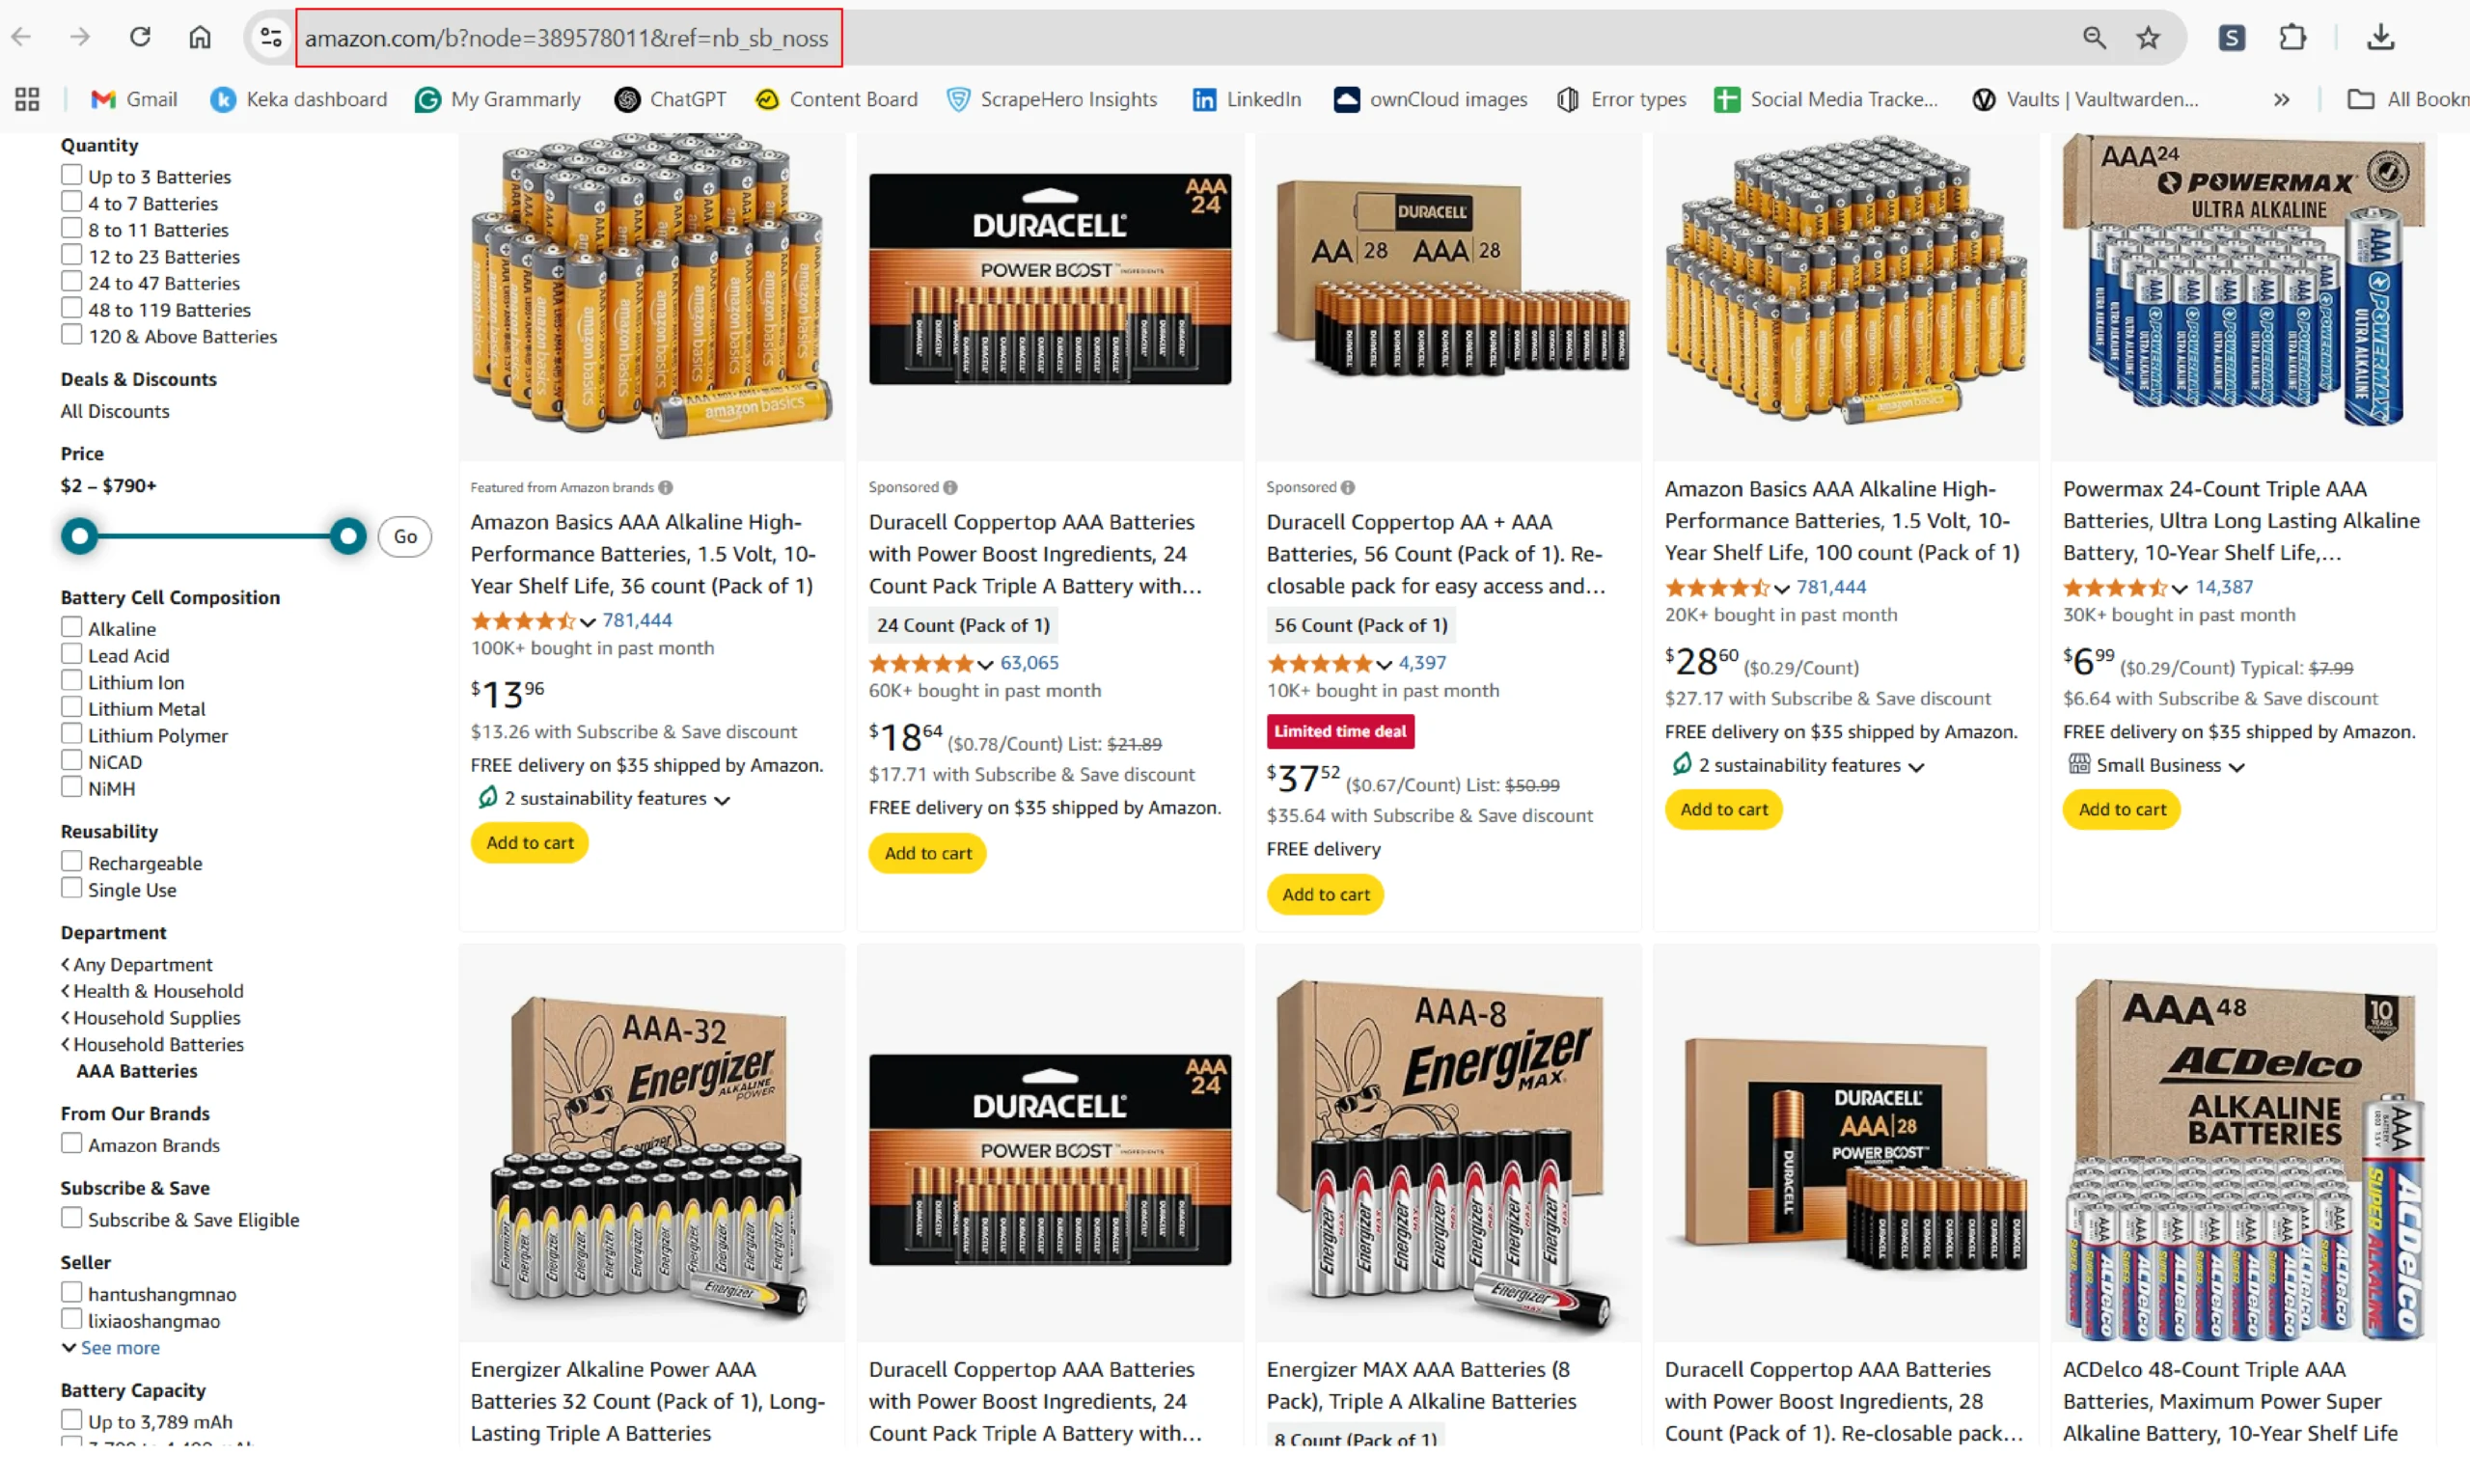
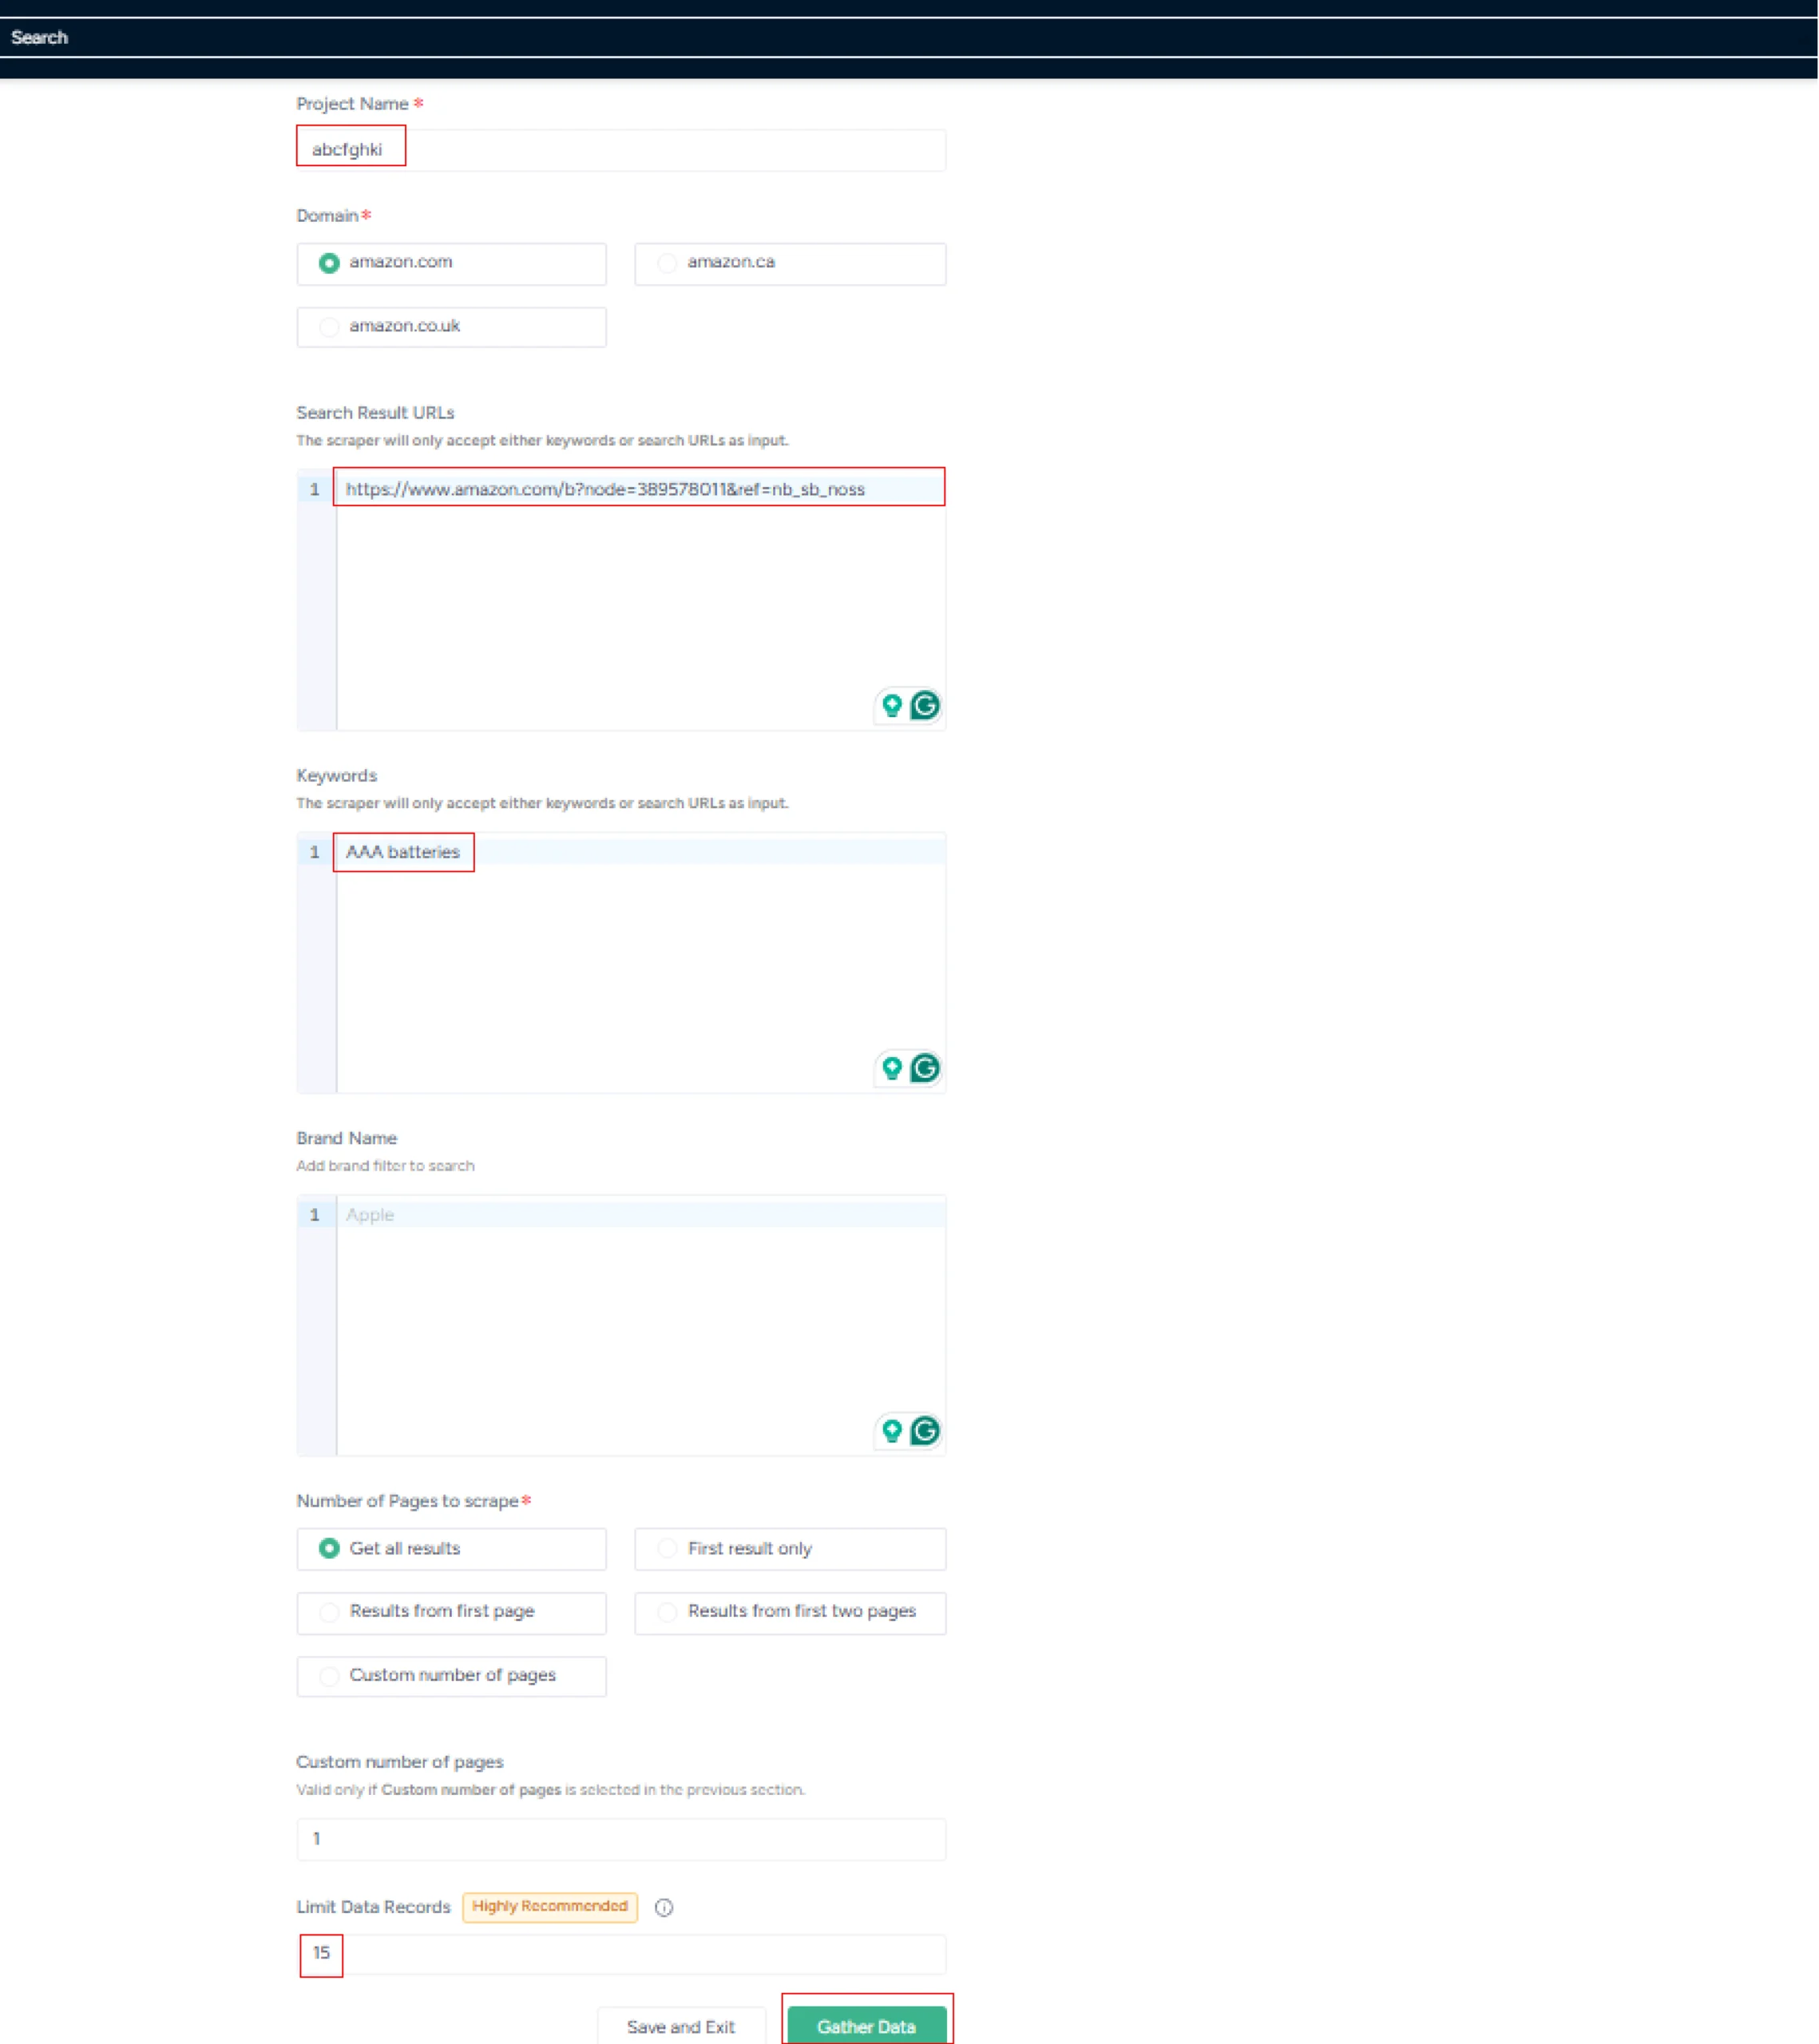
5. In the field provided, enter a project name, search URL, and other details. Then, click the Gather Data button to start the scraper.
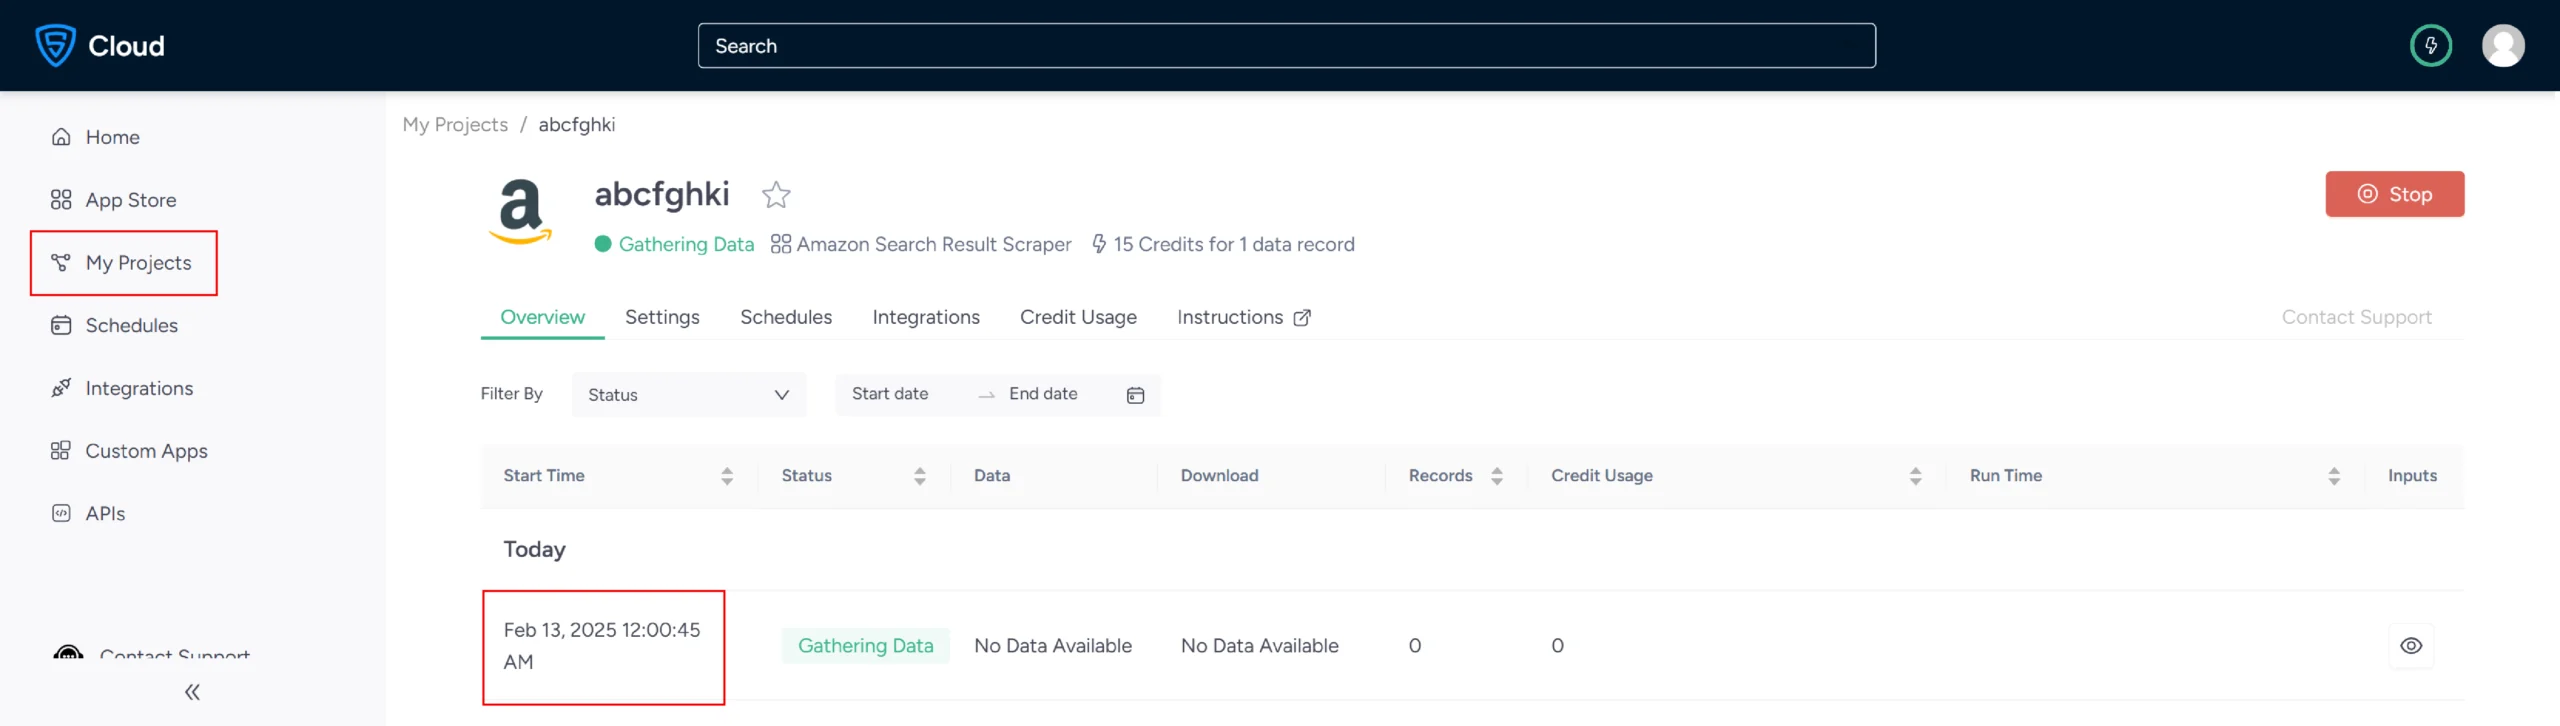
6. The scraper will start fetching data for your queries, and you can track its progress under the Projects tab.
7. Once it is finished, you can view the data by clicking on the project name. A new page will appear, and under the Overview tab, you can see and download the data.
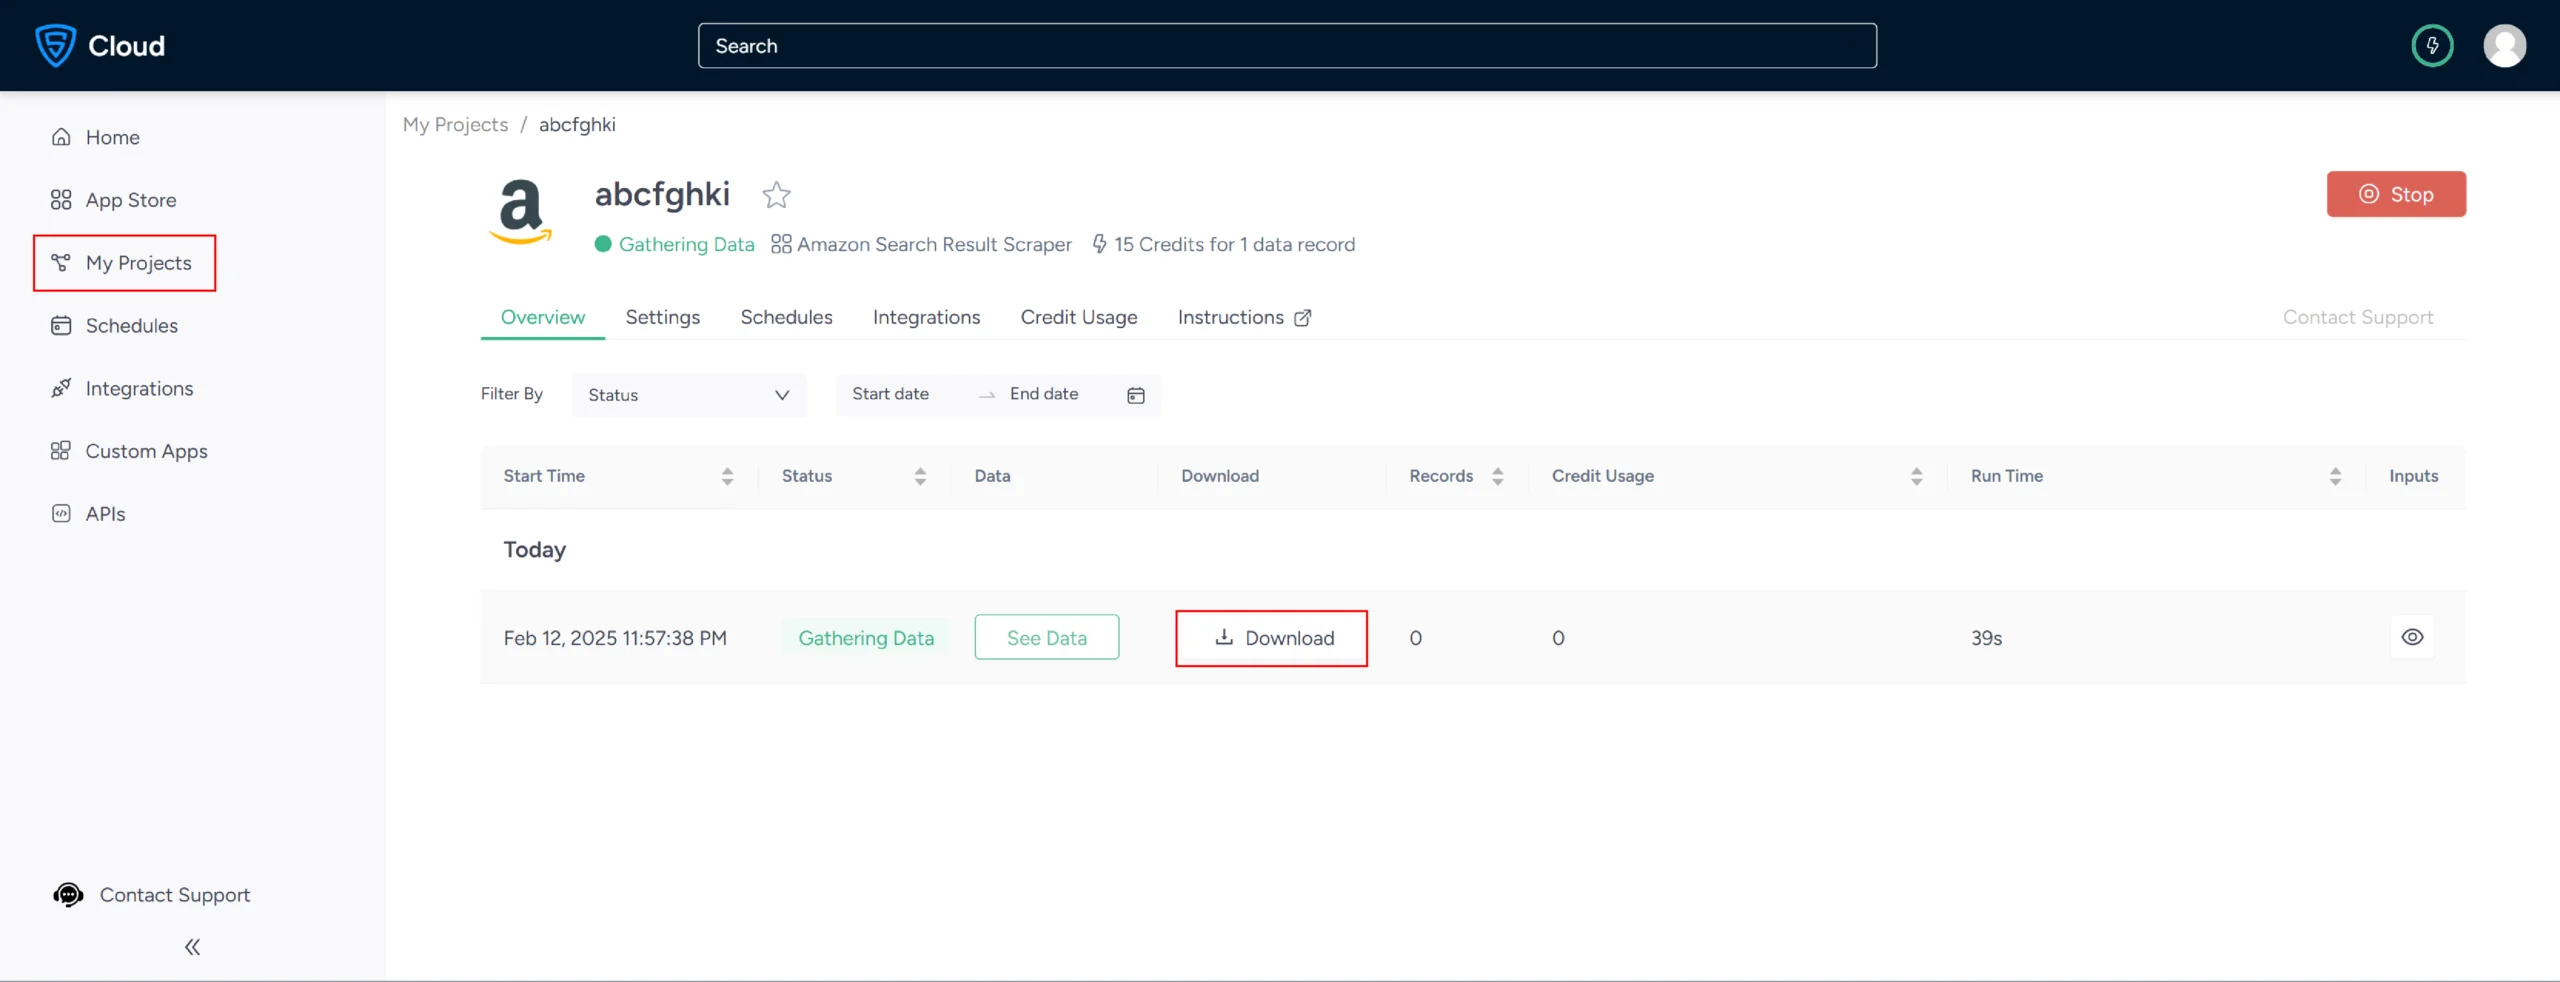
8. You can also pull the data into a spreadsheet from here. Just click on Download Data, select Excel, and open the downloaded file using Microsoft Excel.
Similarly, for scraping data from Target and Walmart, you can use the Target Search Scraper and the Walmart Search Result Scraper, respectively.
Now, let’s move on to visualizing the data.
Visualize Scraped Data Using Microsoft PowerBI
Microsoft Power BI is a cloud-based solution that enables users to analyze and visualize data with incredible speed and efficiency. It works with content packs and pre-built dashboards, which makes up for new, easier ways of collecting data.
Power BI is a perfect platform for e-commerce businesses that either start with analytics or are ready to switch to advanced BI tools.
With the data collected, you can compare products from Amazon, Walmart, and Target and create an e-commerce price monitoring dashboard without coding.
Understanding the Requirements
From the data, you have a list of measures and metrics such as product name, price, seller, availability, rating, reviews, and more.
After collecting the data, you can import the files into the PowerBI platform. This will automatically create a dataset. When you develop visualizations in reports and dashboards, you’re often looking at data in the dataset.
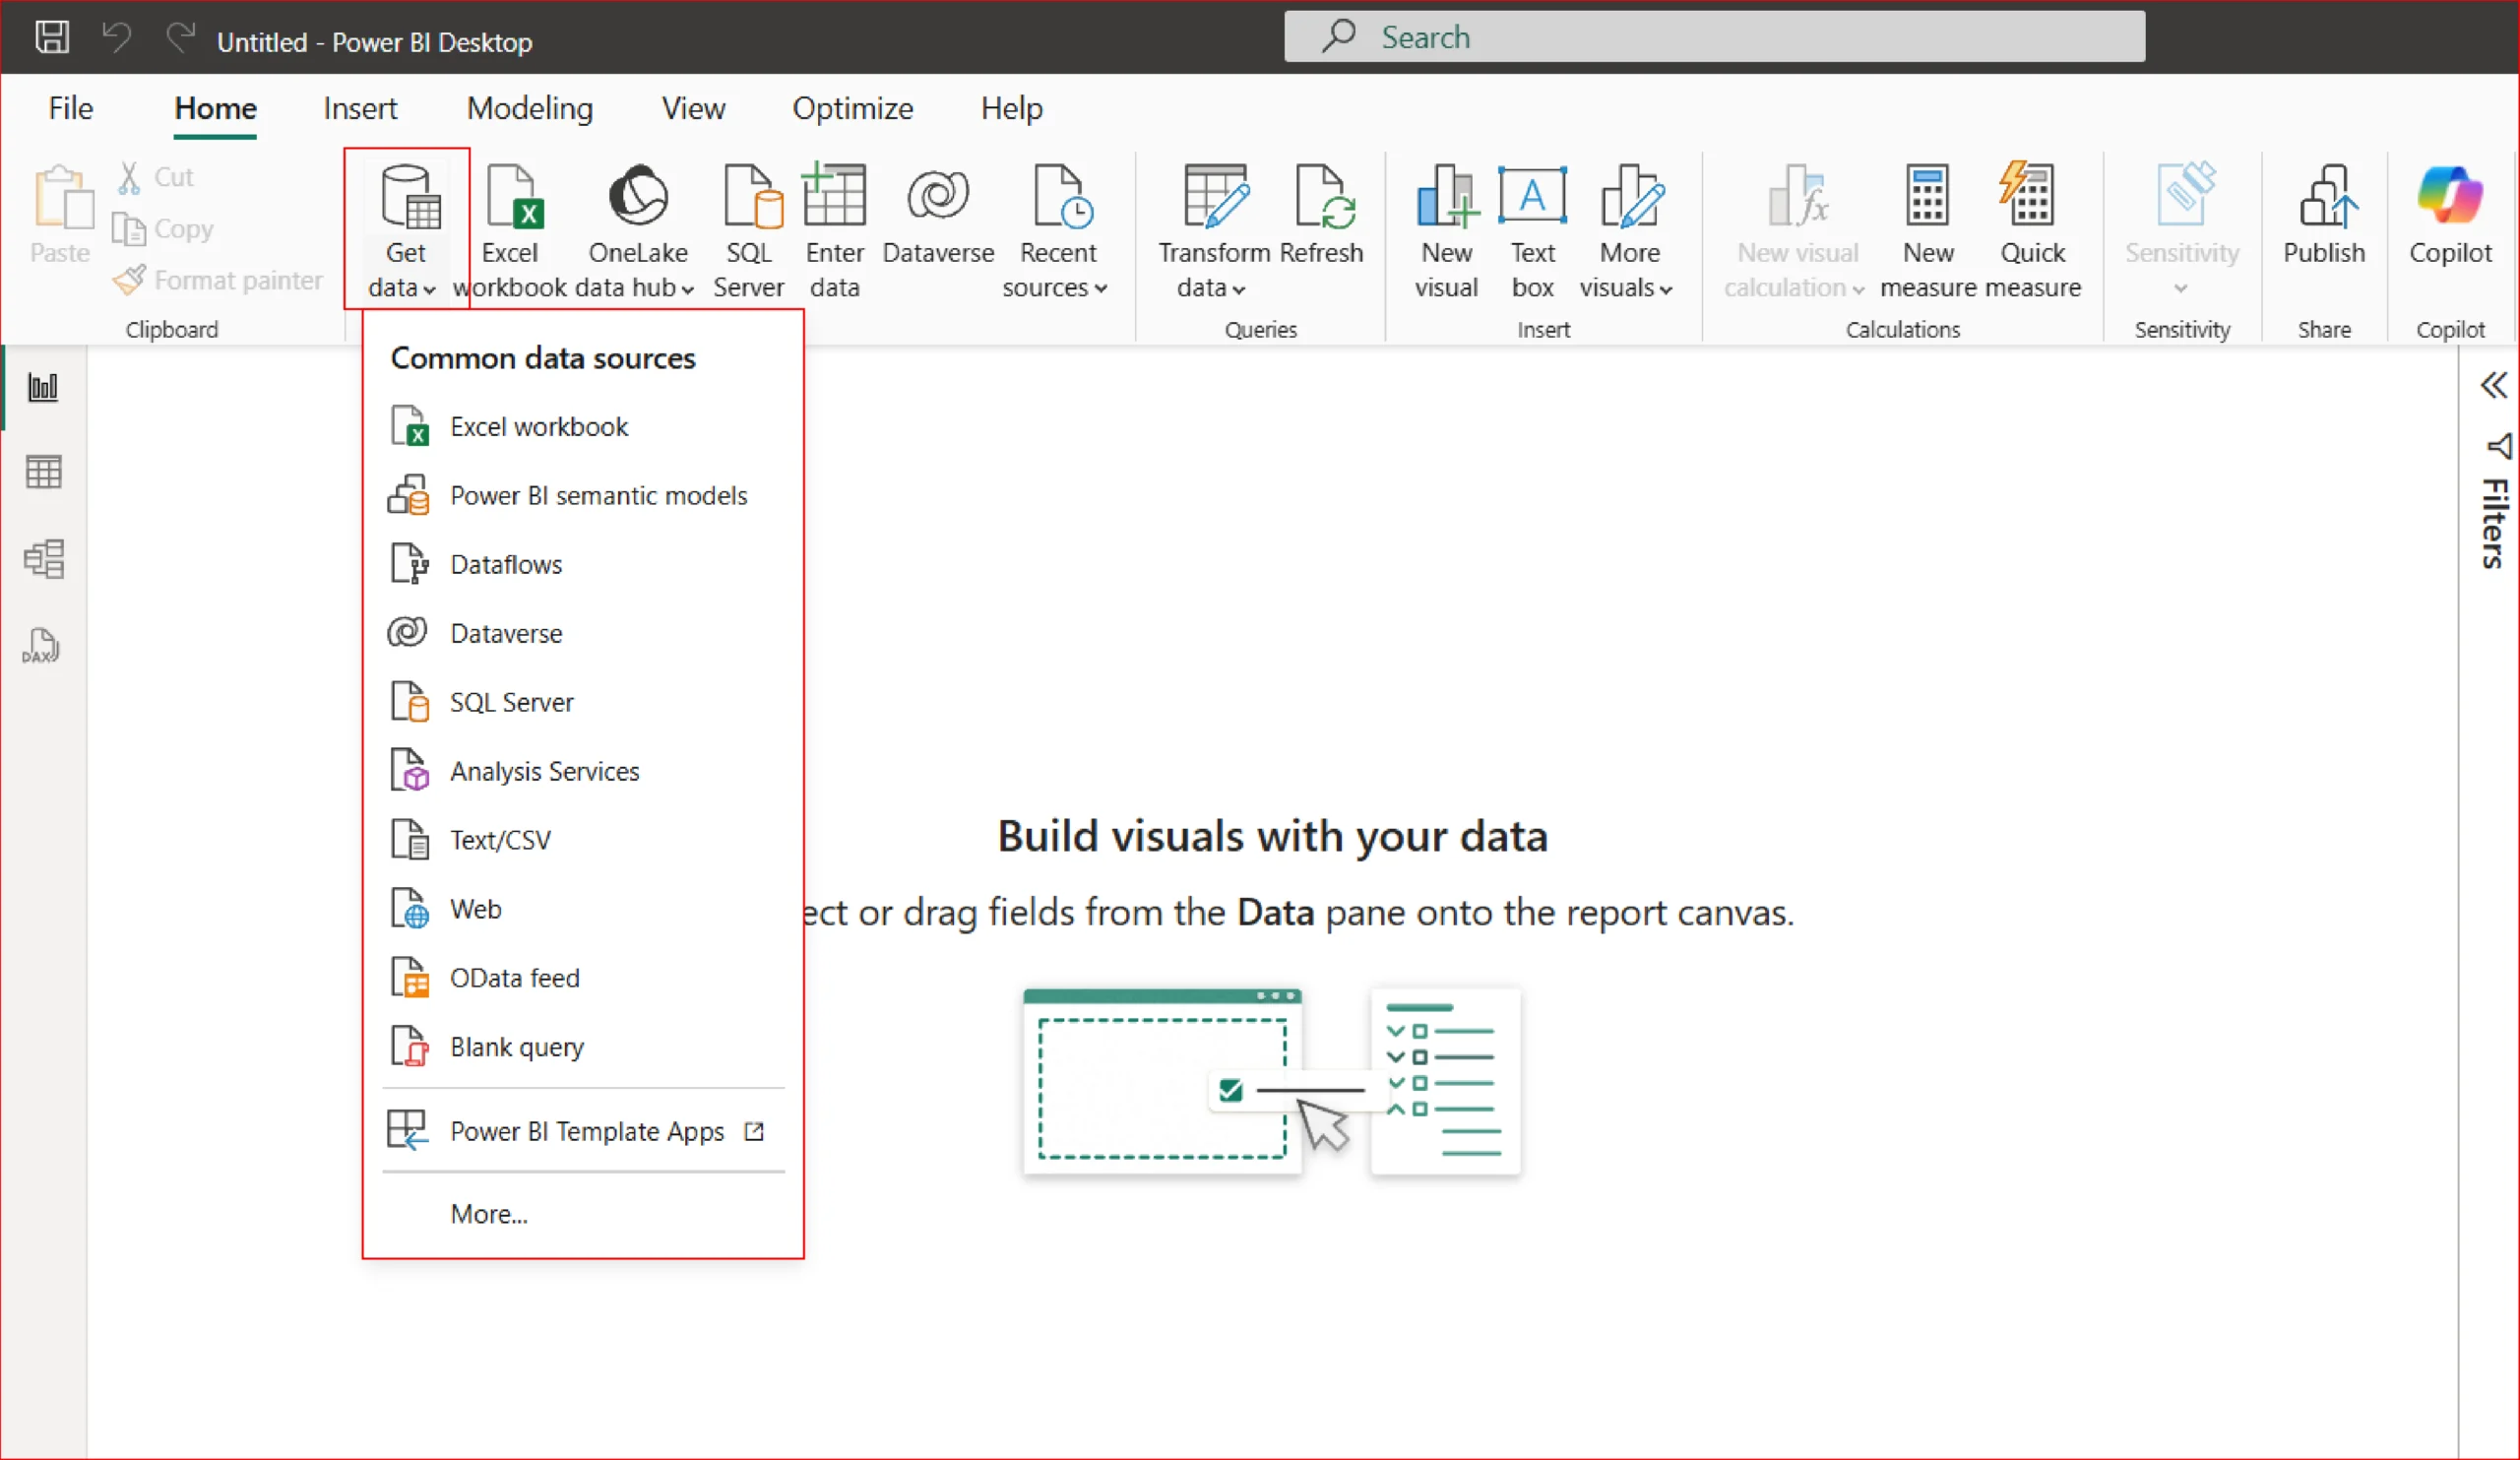
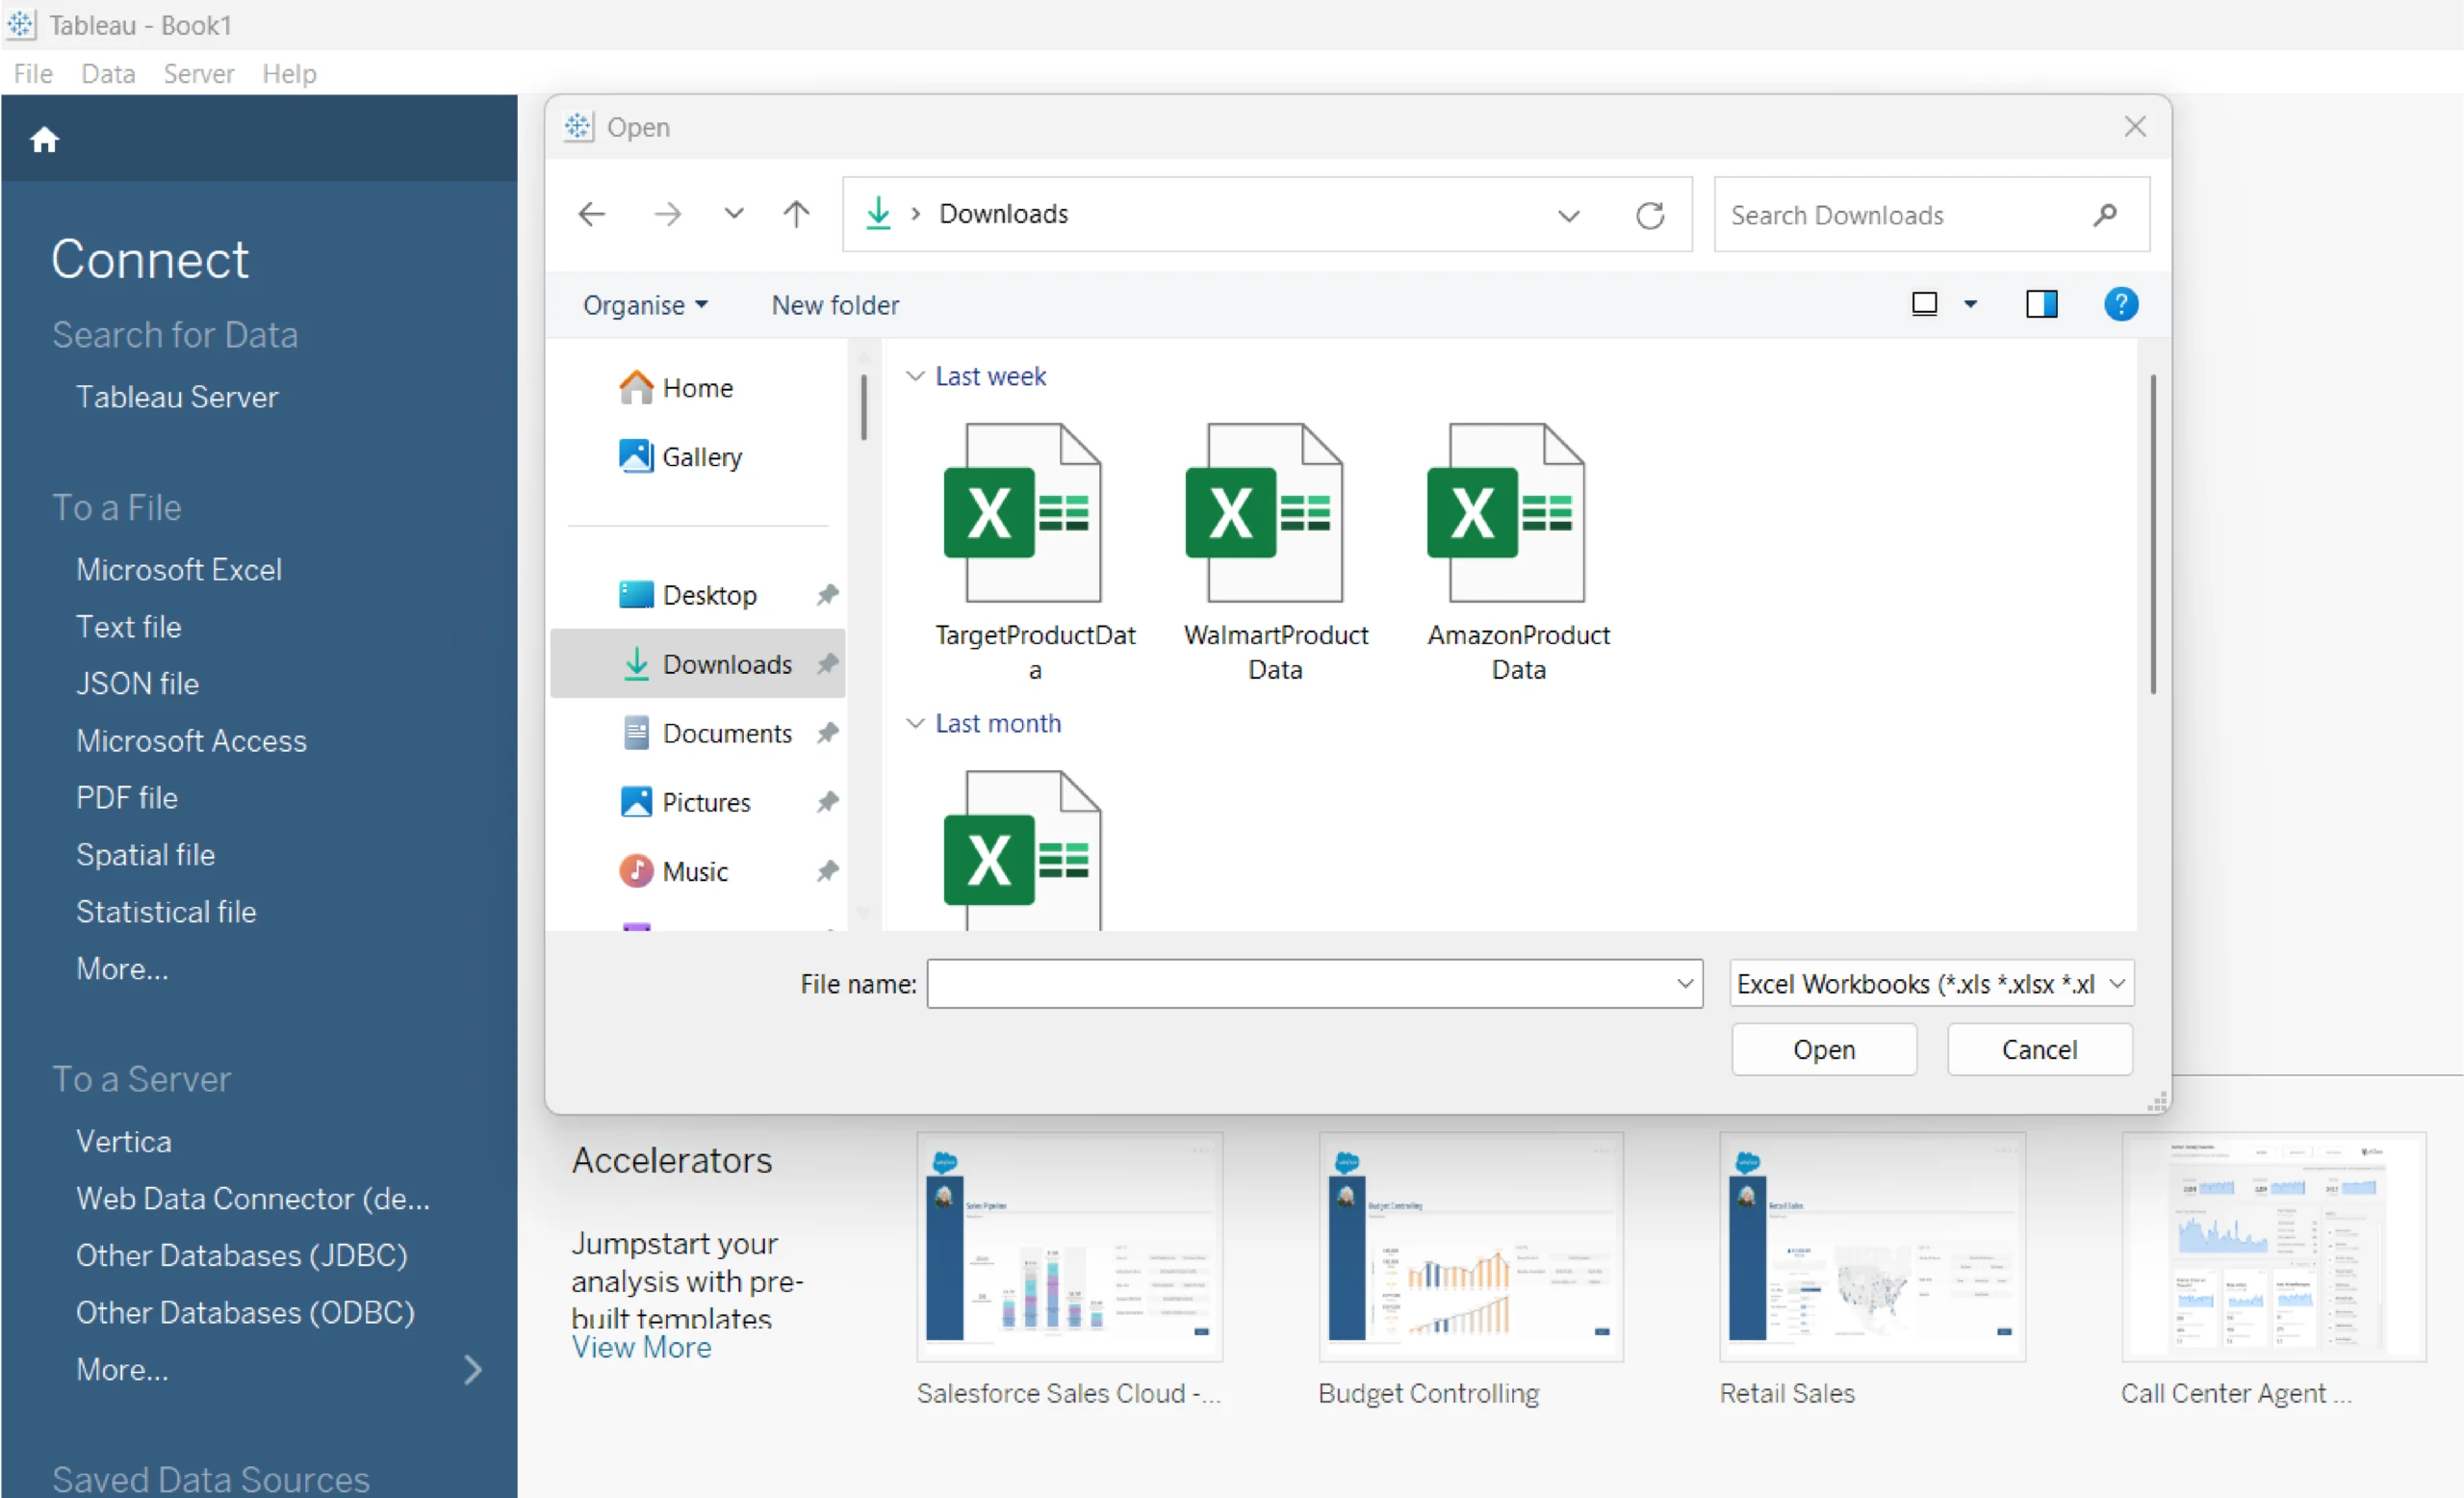
To import the data, open the PowerBI desktop and click on Get Data. You will see the possible file formats you can import your data file as.
Developing Insights on PowerBI
Below are some insights you can create to build a price tracking dashboard with no code:
- Number of Brands vs Website
- Brands vs Number of Products
- Brands vs. Total Customer Reviews
- Brands vs. Rating
- Pricing Histogram
- Brands vs. Sale Price
- Brands vs. Regular Price
Here, let’s take into consideration Brands vs. Rating, Brands vs. Sale Price, and Brands vs. Regular Price.
Build a Price Monitoring Dashboard Without Coding on Power BI
Once the necessary calculated columns and measures are developed, the next step is to create charts and dashboards to deliver key insights. Power BI provides visualizations that can help give these insights.
There are many different ways to build a price monitoring dashboard. For example, you can create a dashboard from scratch, a report, or a dataset.
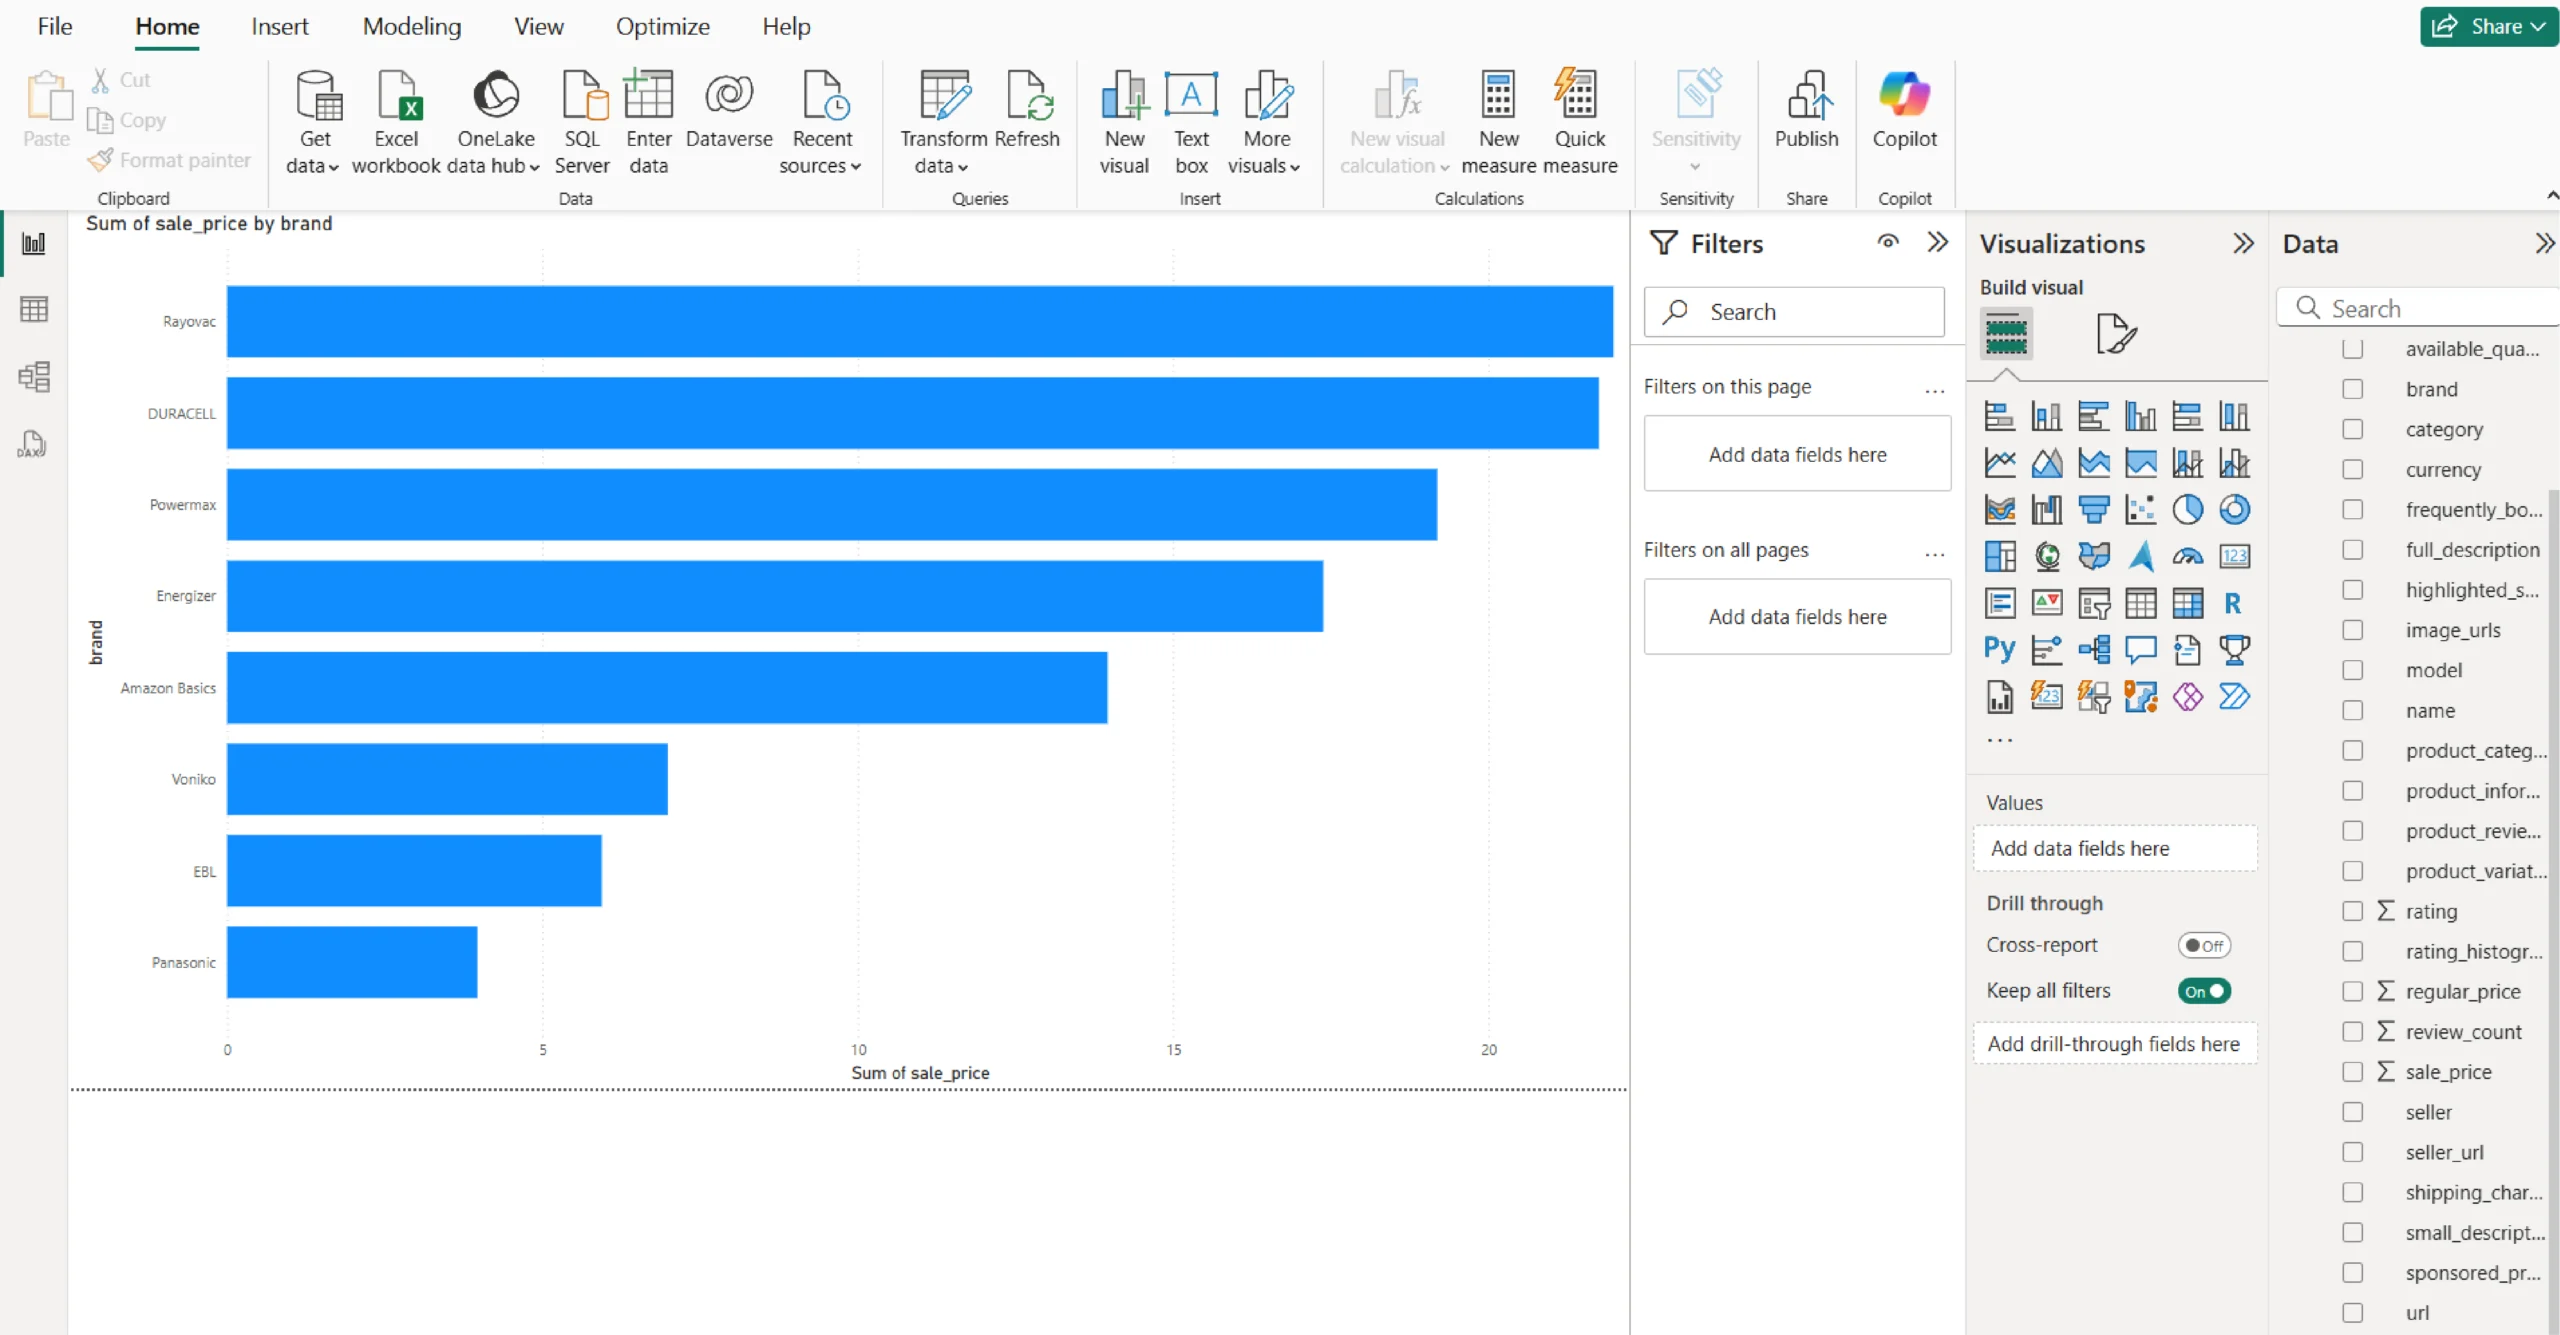
To create a simple chart, you can go to the PowerBI workspace and select a particular visualization. Then, you can drag and drop the measure and values onto the axis to create a chart.
The image below shows the sum of the sale price by each brand under ‘Batteries’ on Amazon, visualized as a bar chart.
Using the e-commerce data, you can build a price monitoring dashboard for each website. You can also track price fluctuations over time, visualize brand-wise product counts, and compare pricing trends with histograms.
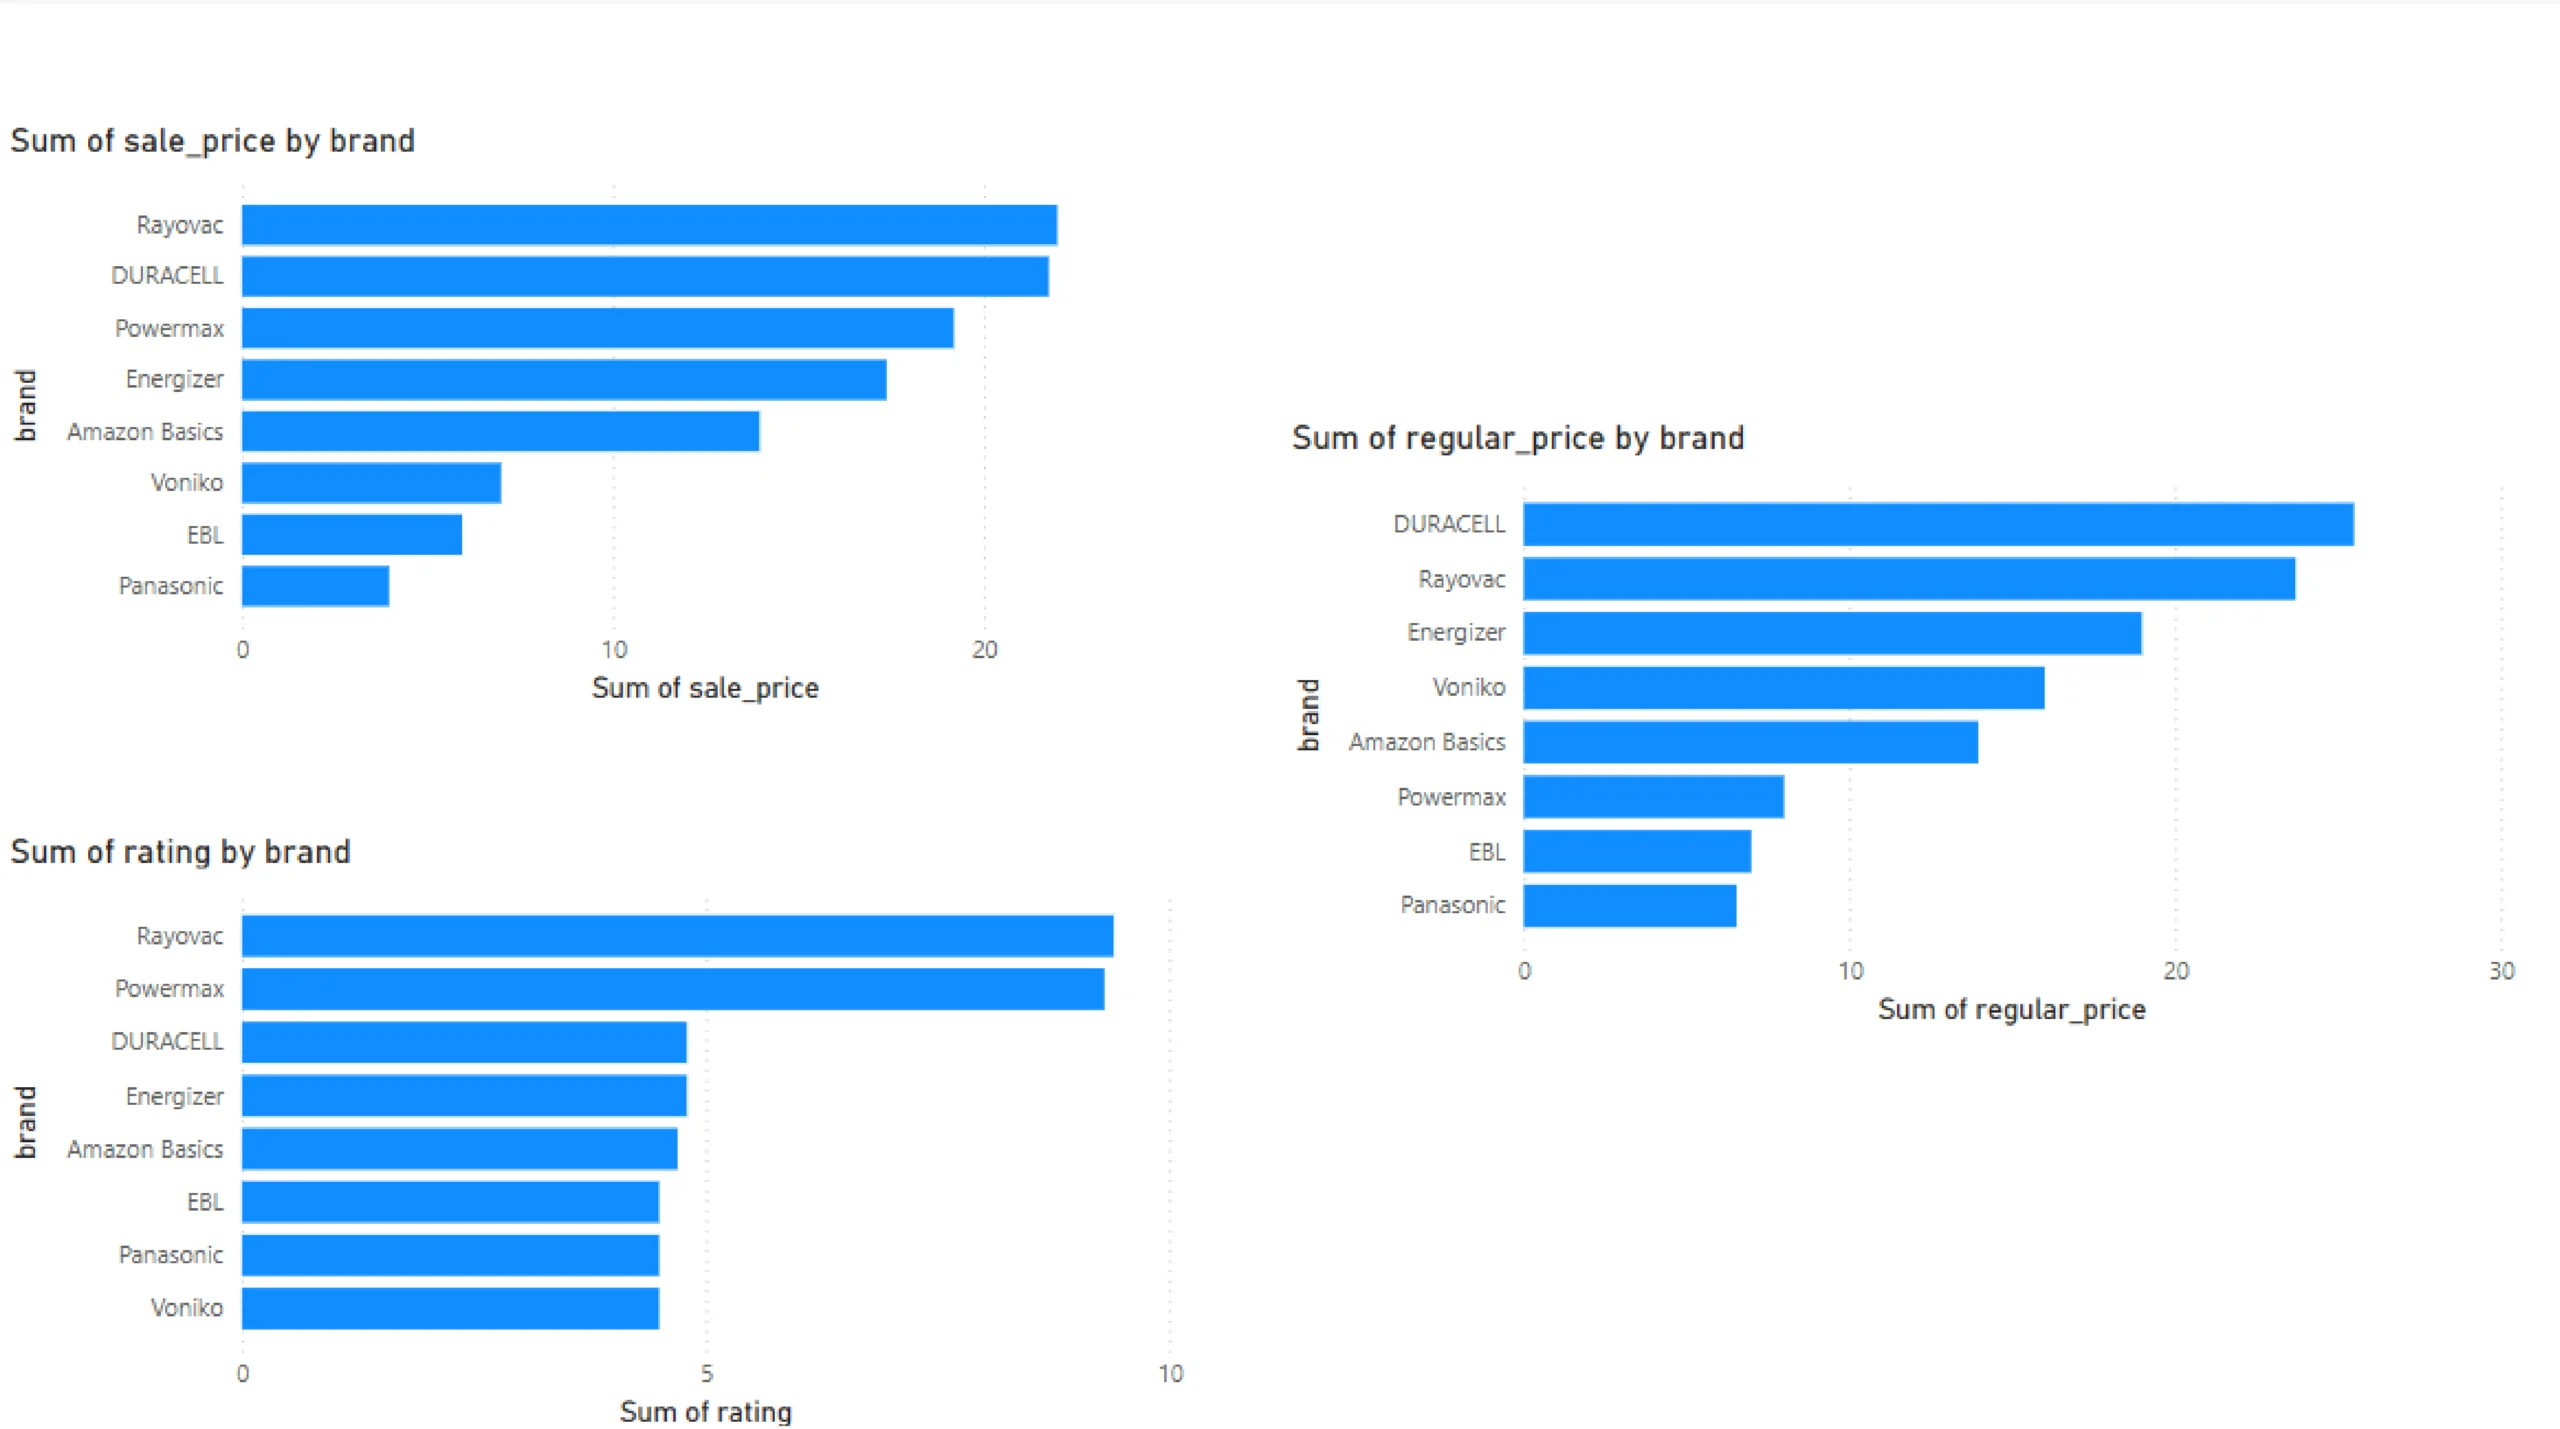
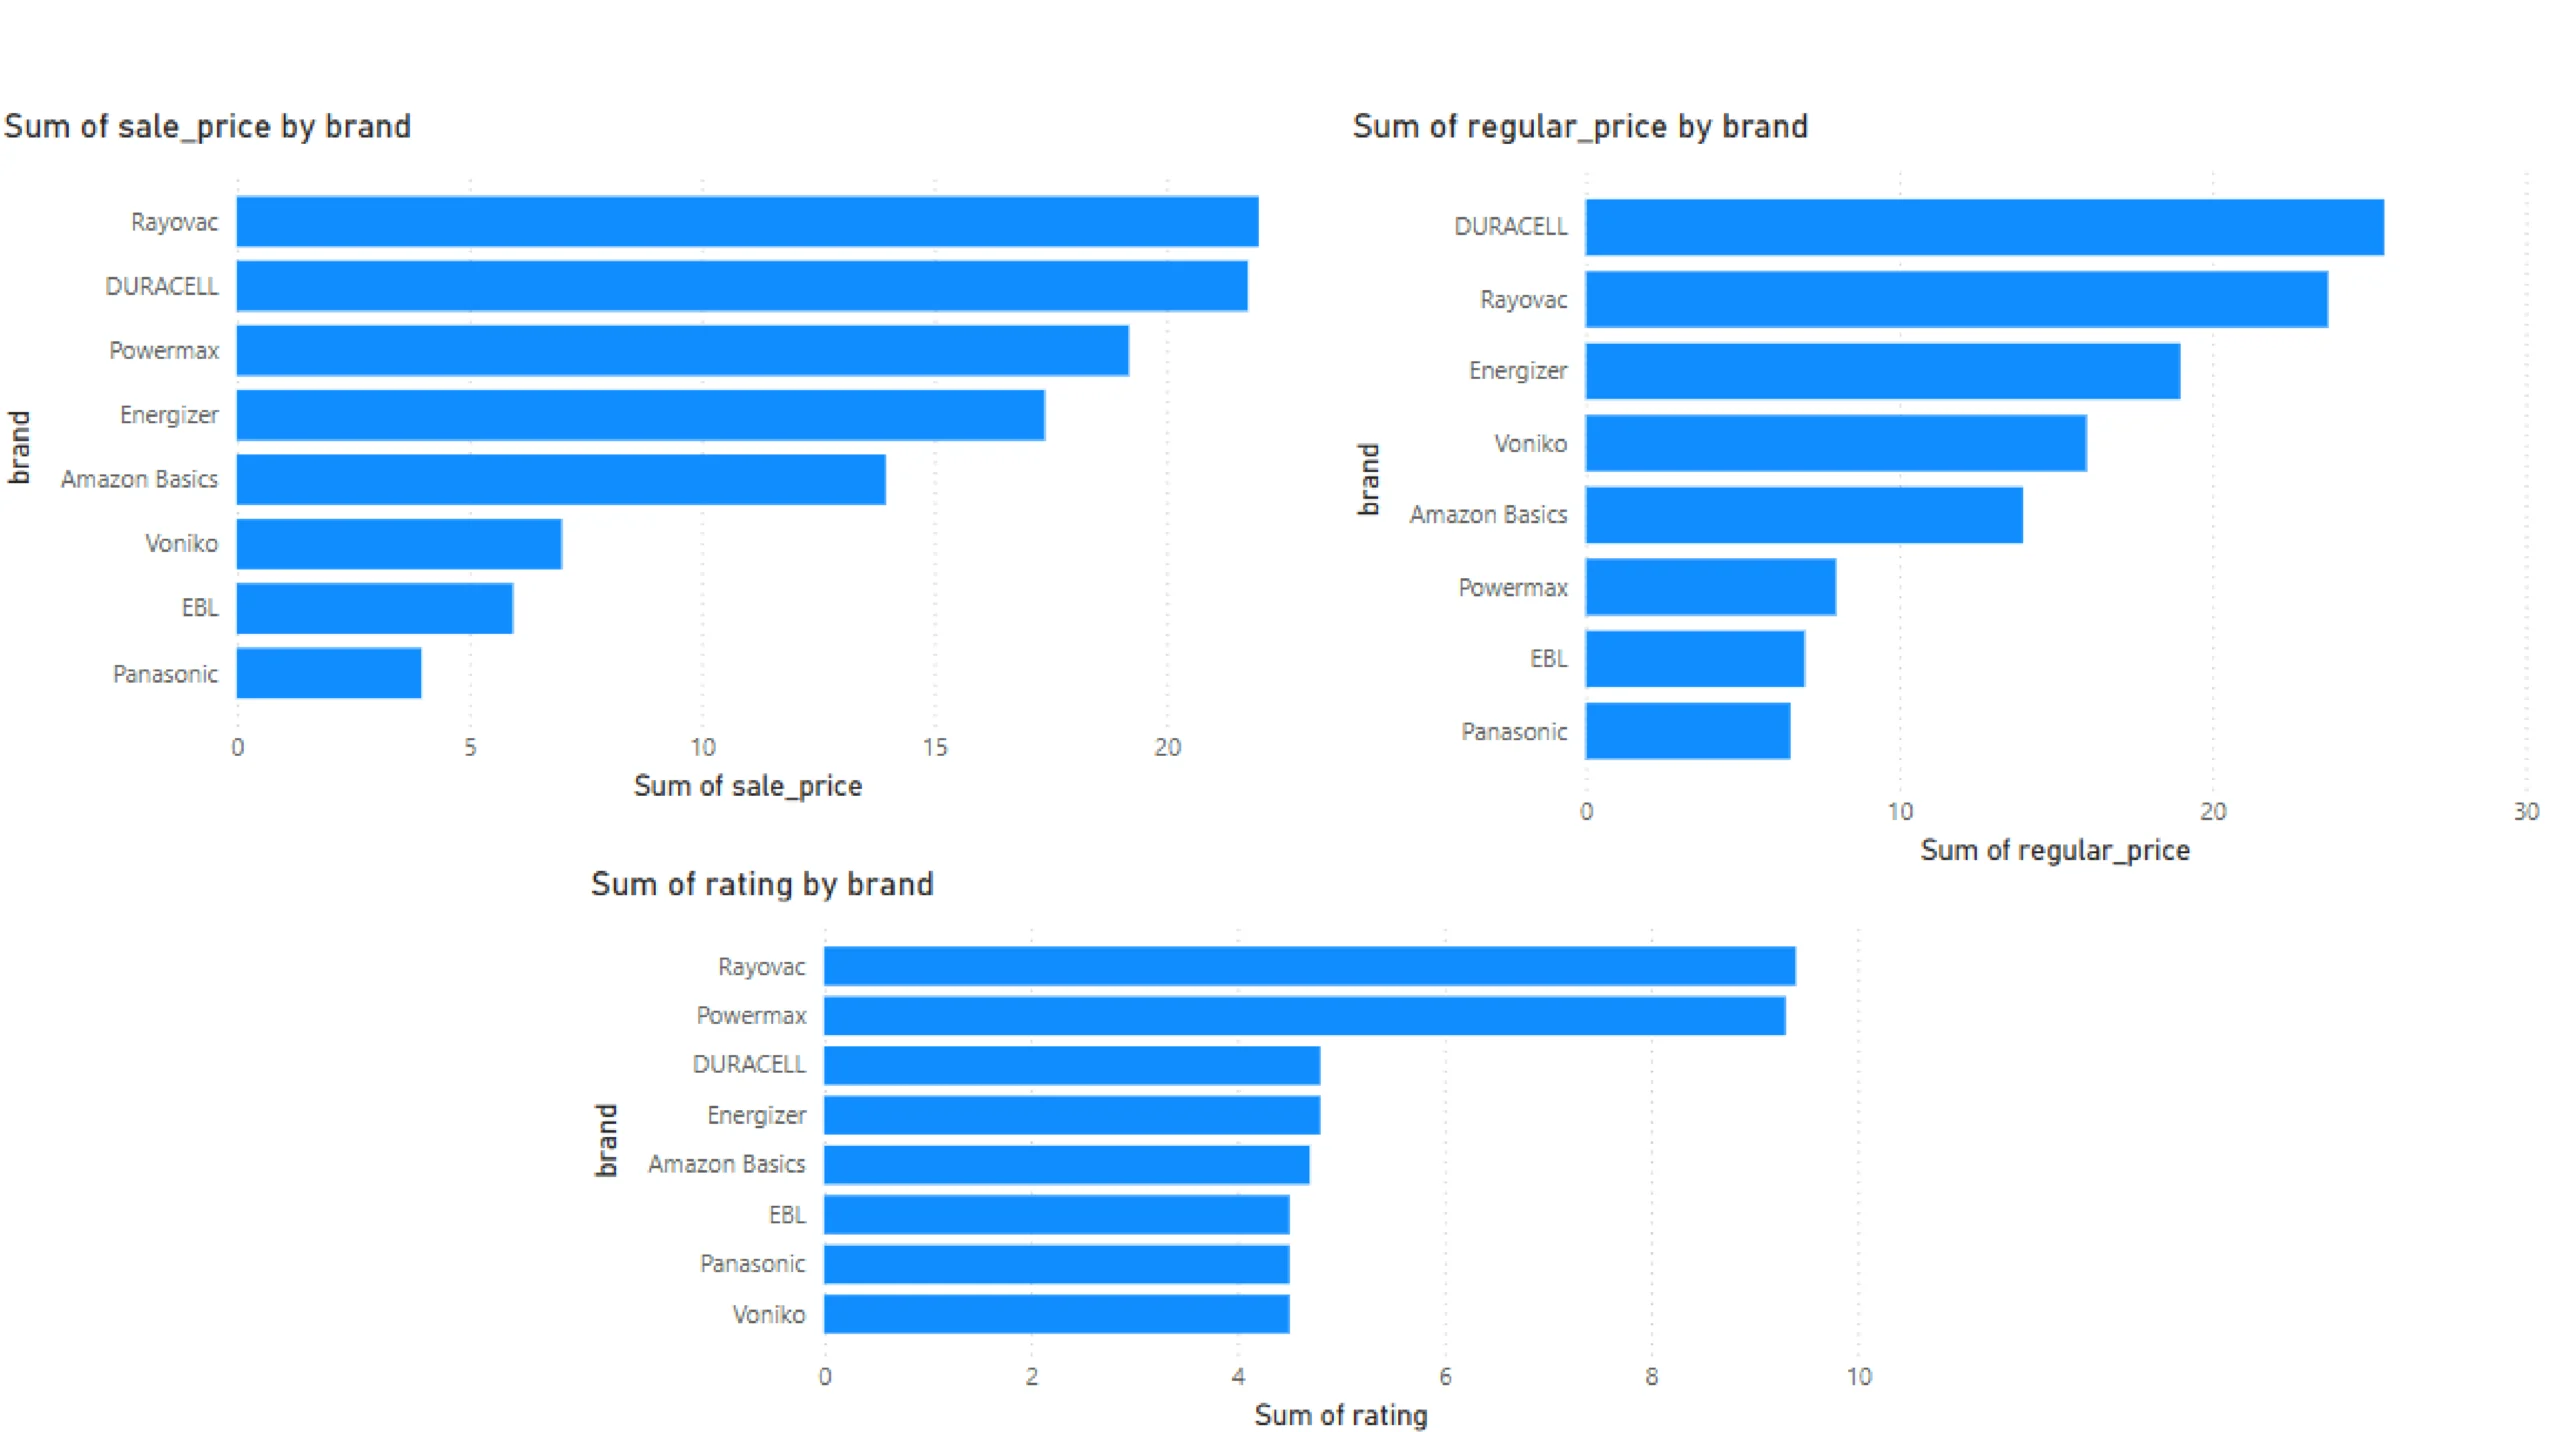
E-Commerce Price Dashboard
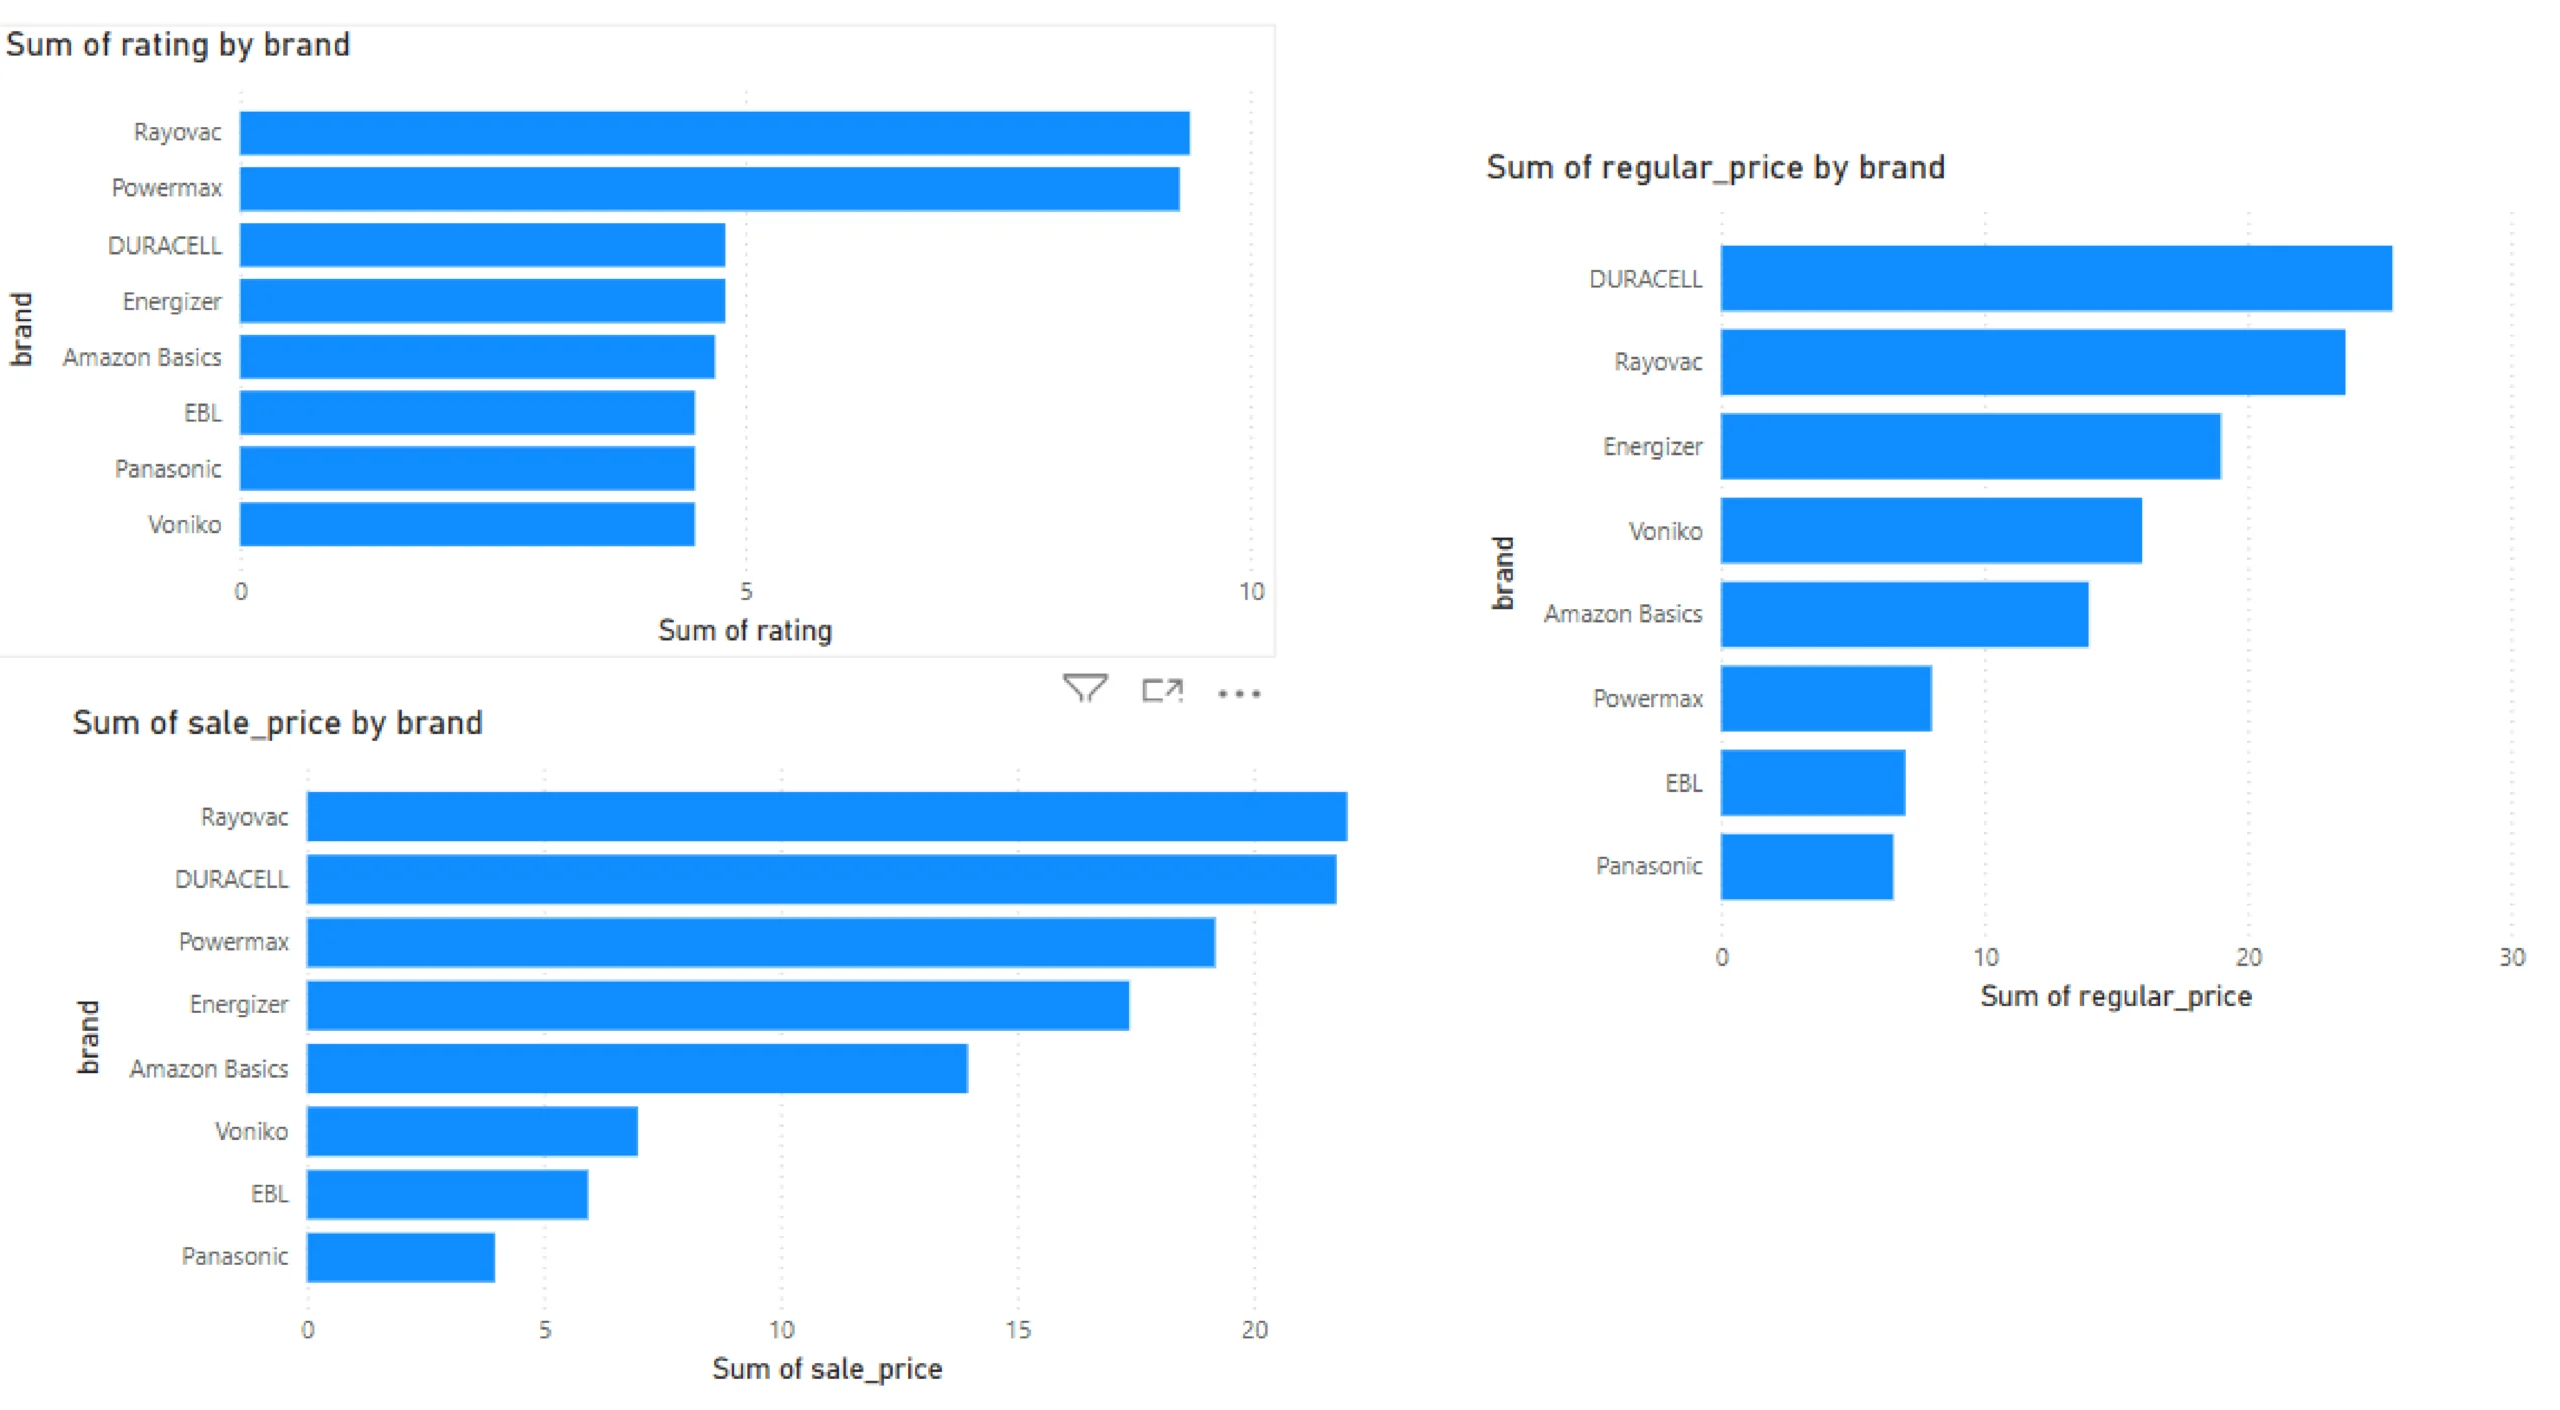
The dashboards below can monitor the brands available for sale prices, regular prices, and ratings on one day.
You can also collect data from scrapers on different days and then compare the pricing accordingly.
Amazon:
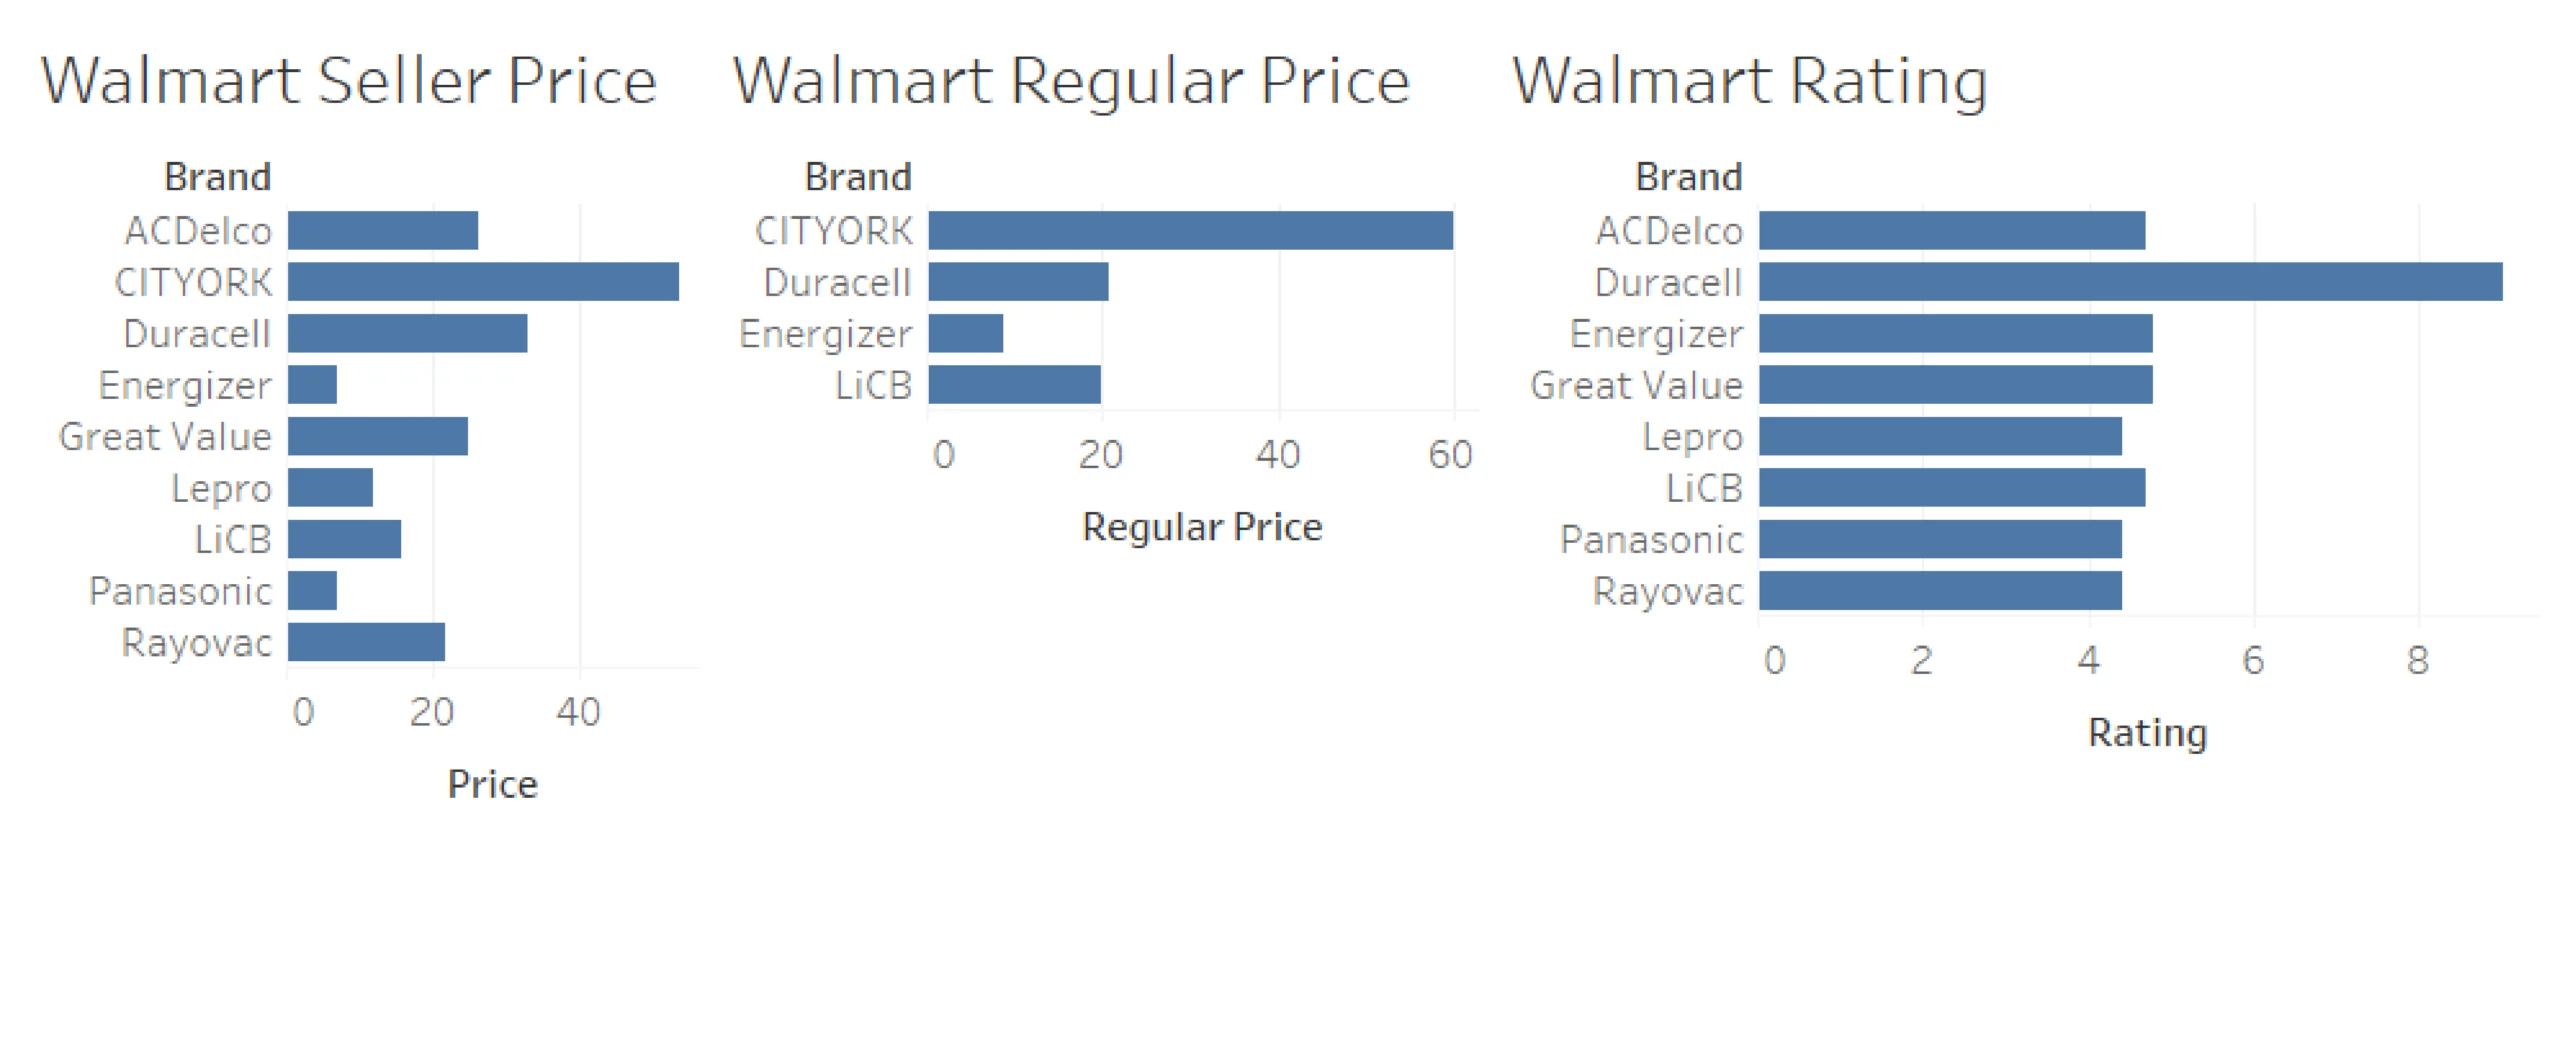
Walmart:
Target:
Visualizing Scraped Data Using Tableau
Tableau is one of the top enterprise data visualization tools. Tableau has a lot of flexibility when it comes to creating graphical representations with data. It is also an excellent option for those who want to create maps in addition to other types of charts.Once you have installed the tool, you can import your data files. Click on File->New Data Source and select the type of file you will be importing.
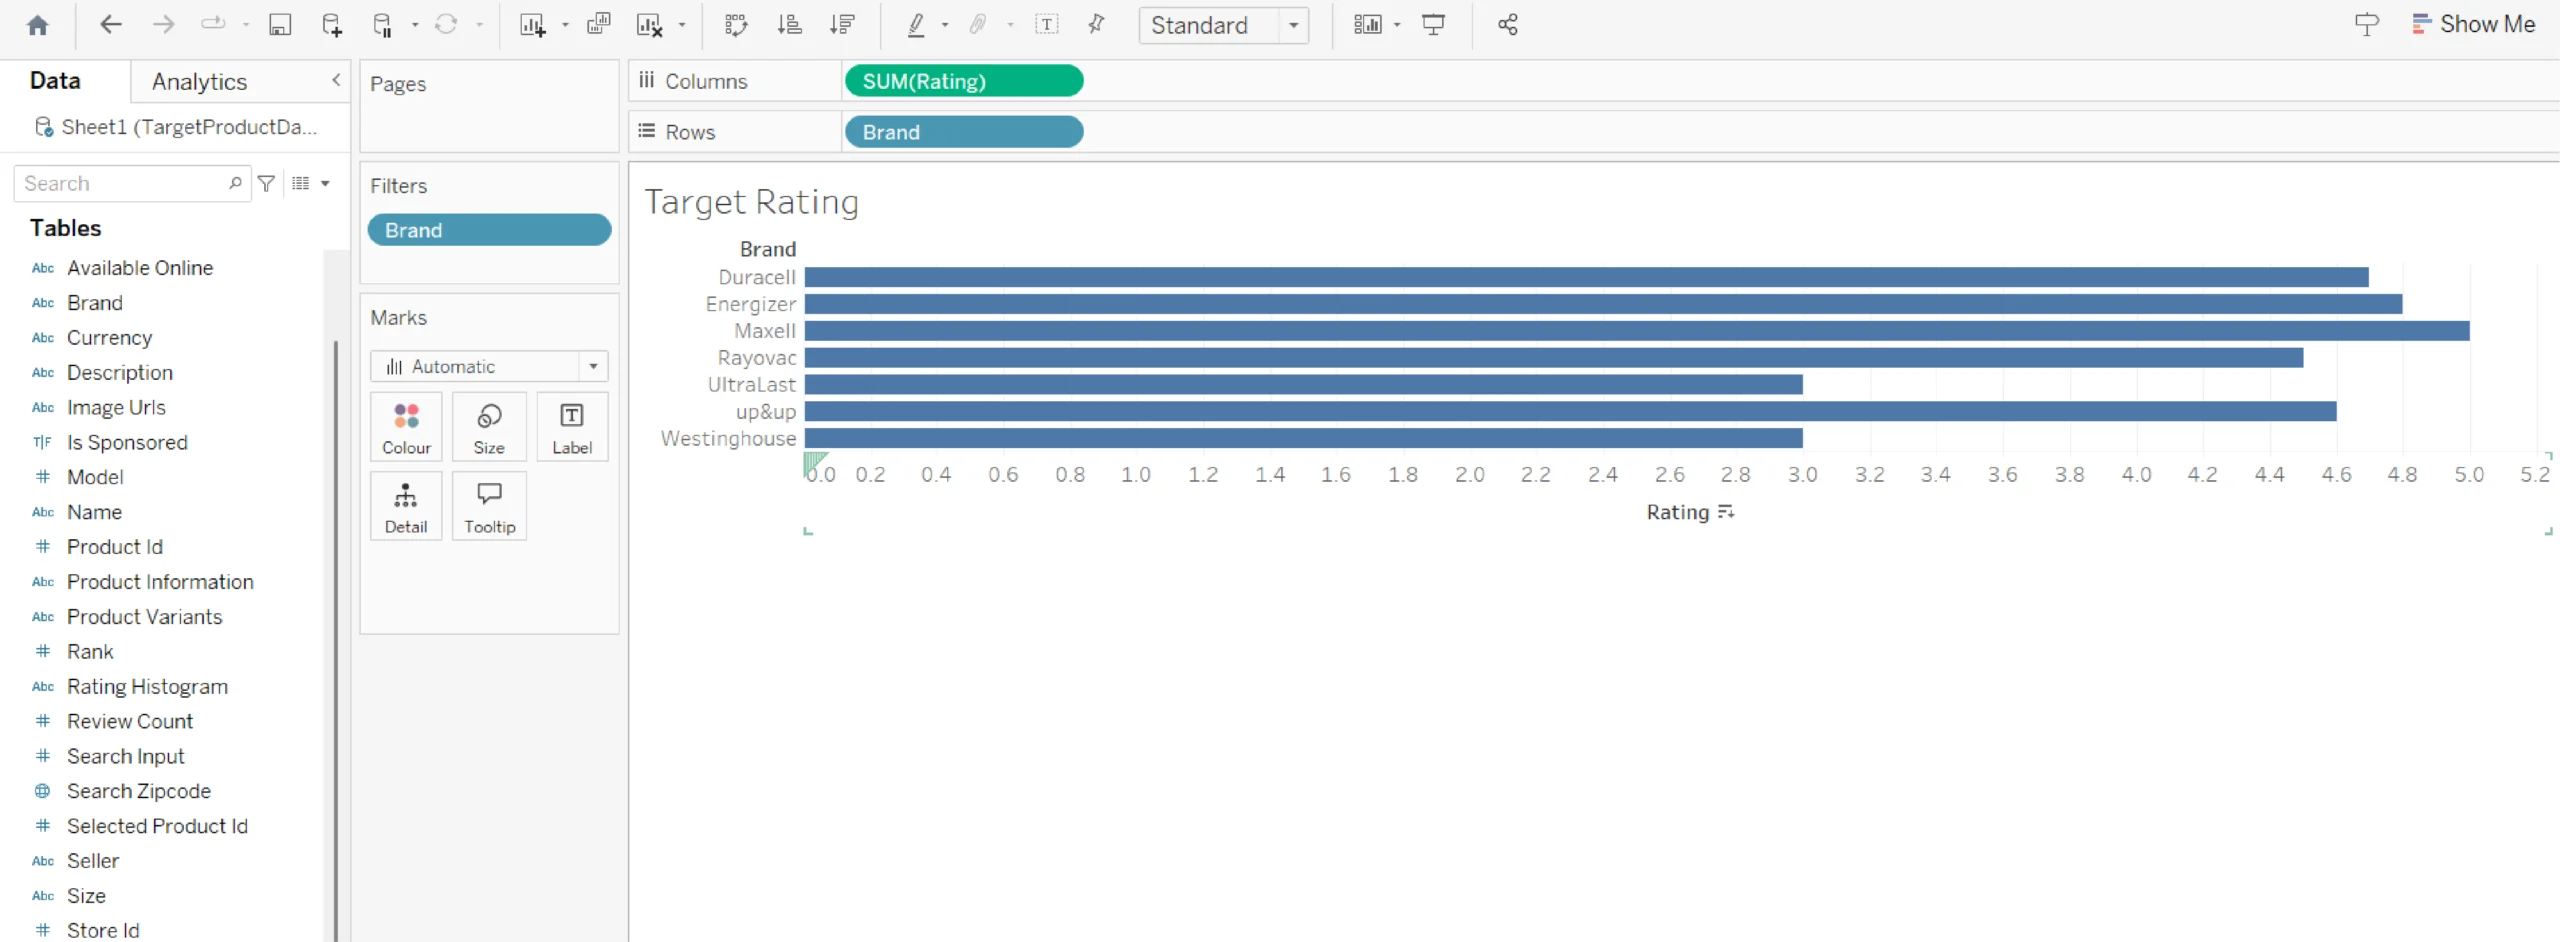
Then, you can move on to creating charts in a worksheet.
After that, add the measures and attributes needed to create the visualizations. Here is what a worksheet looks like:
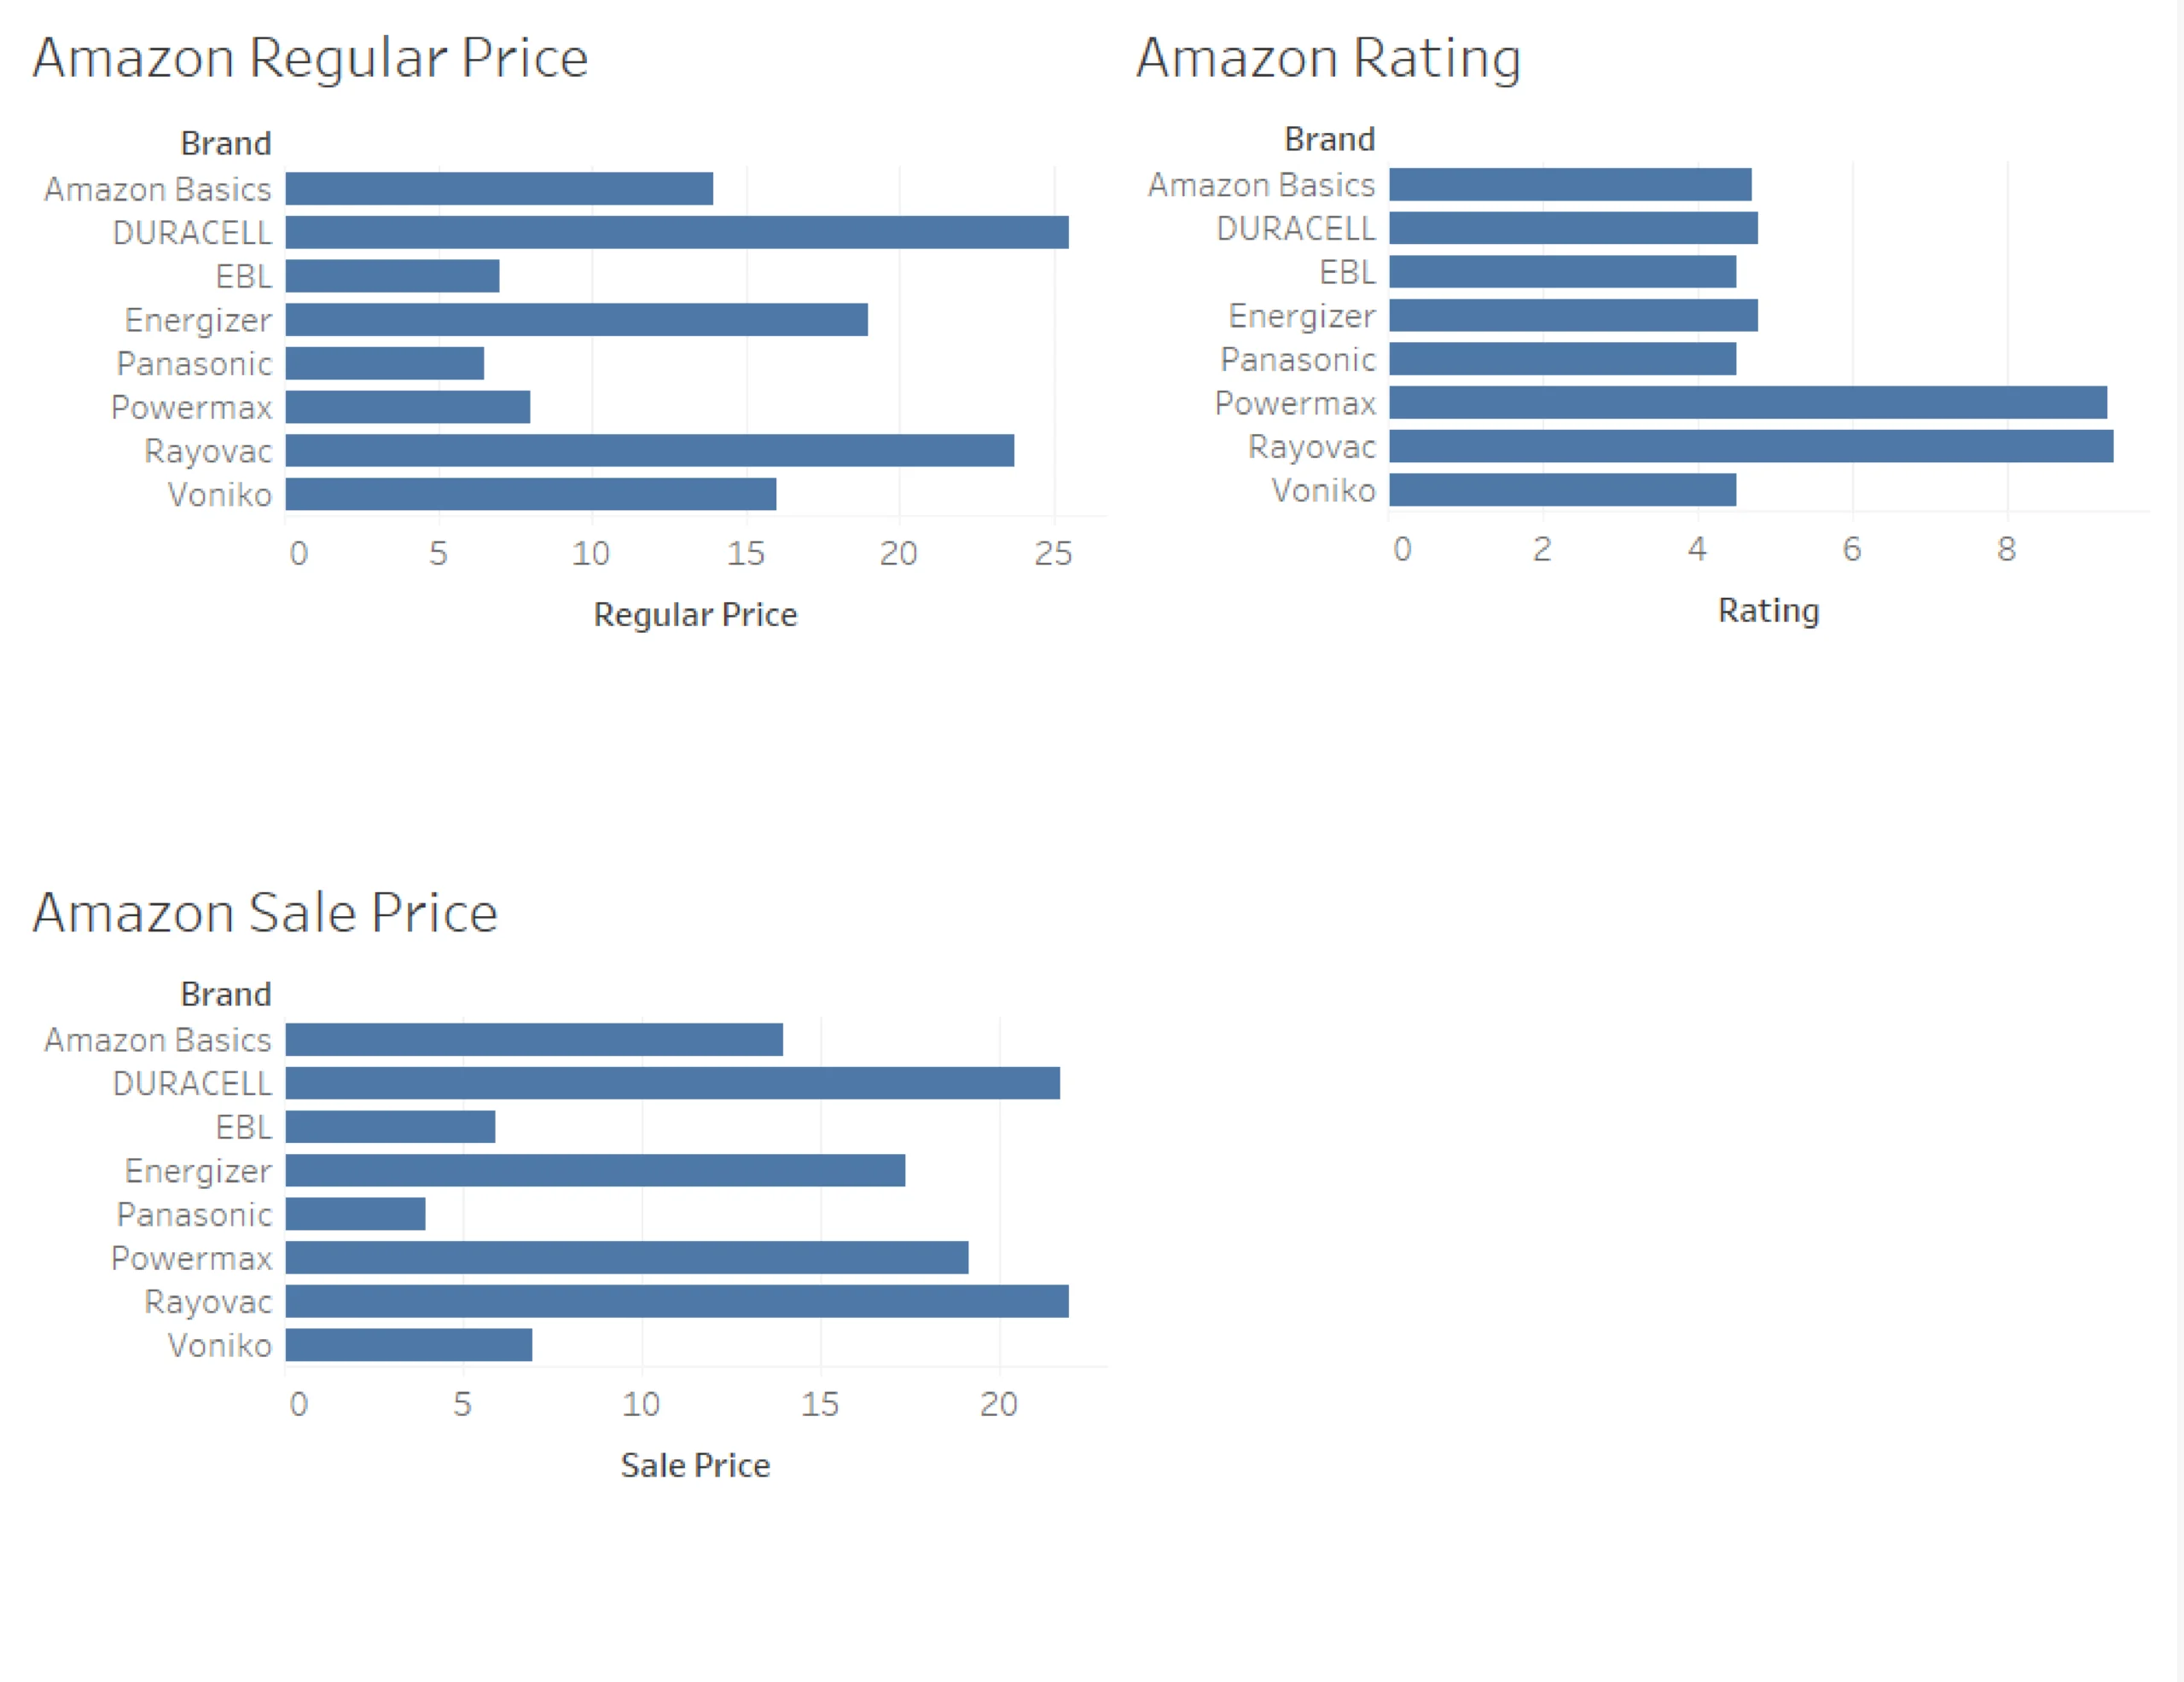
After creating all the worksheets, the visualizations can be combined into a complete no-code dashboard like:
Amazon:
Walmart:
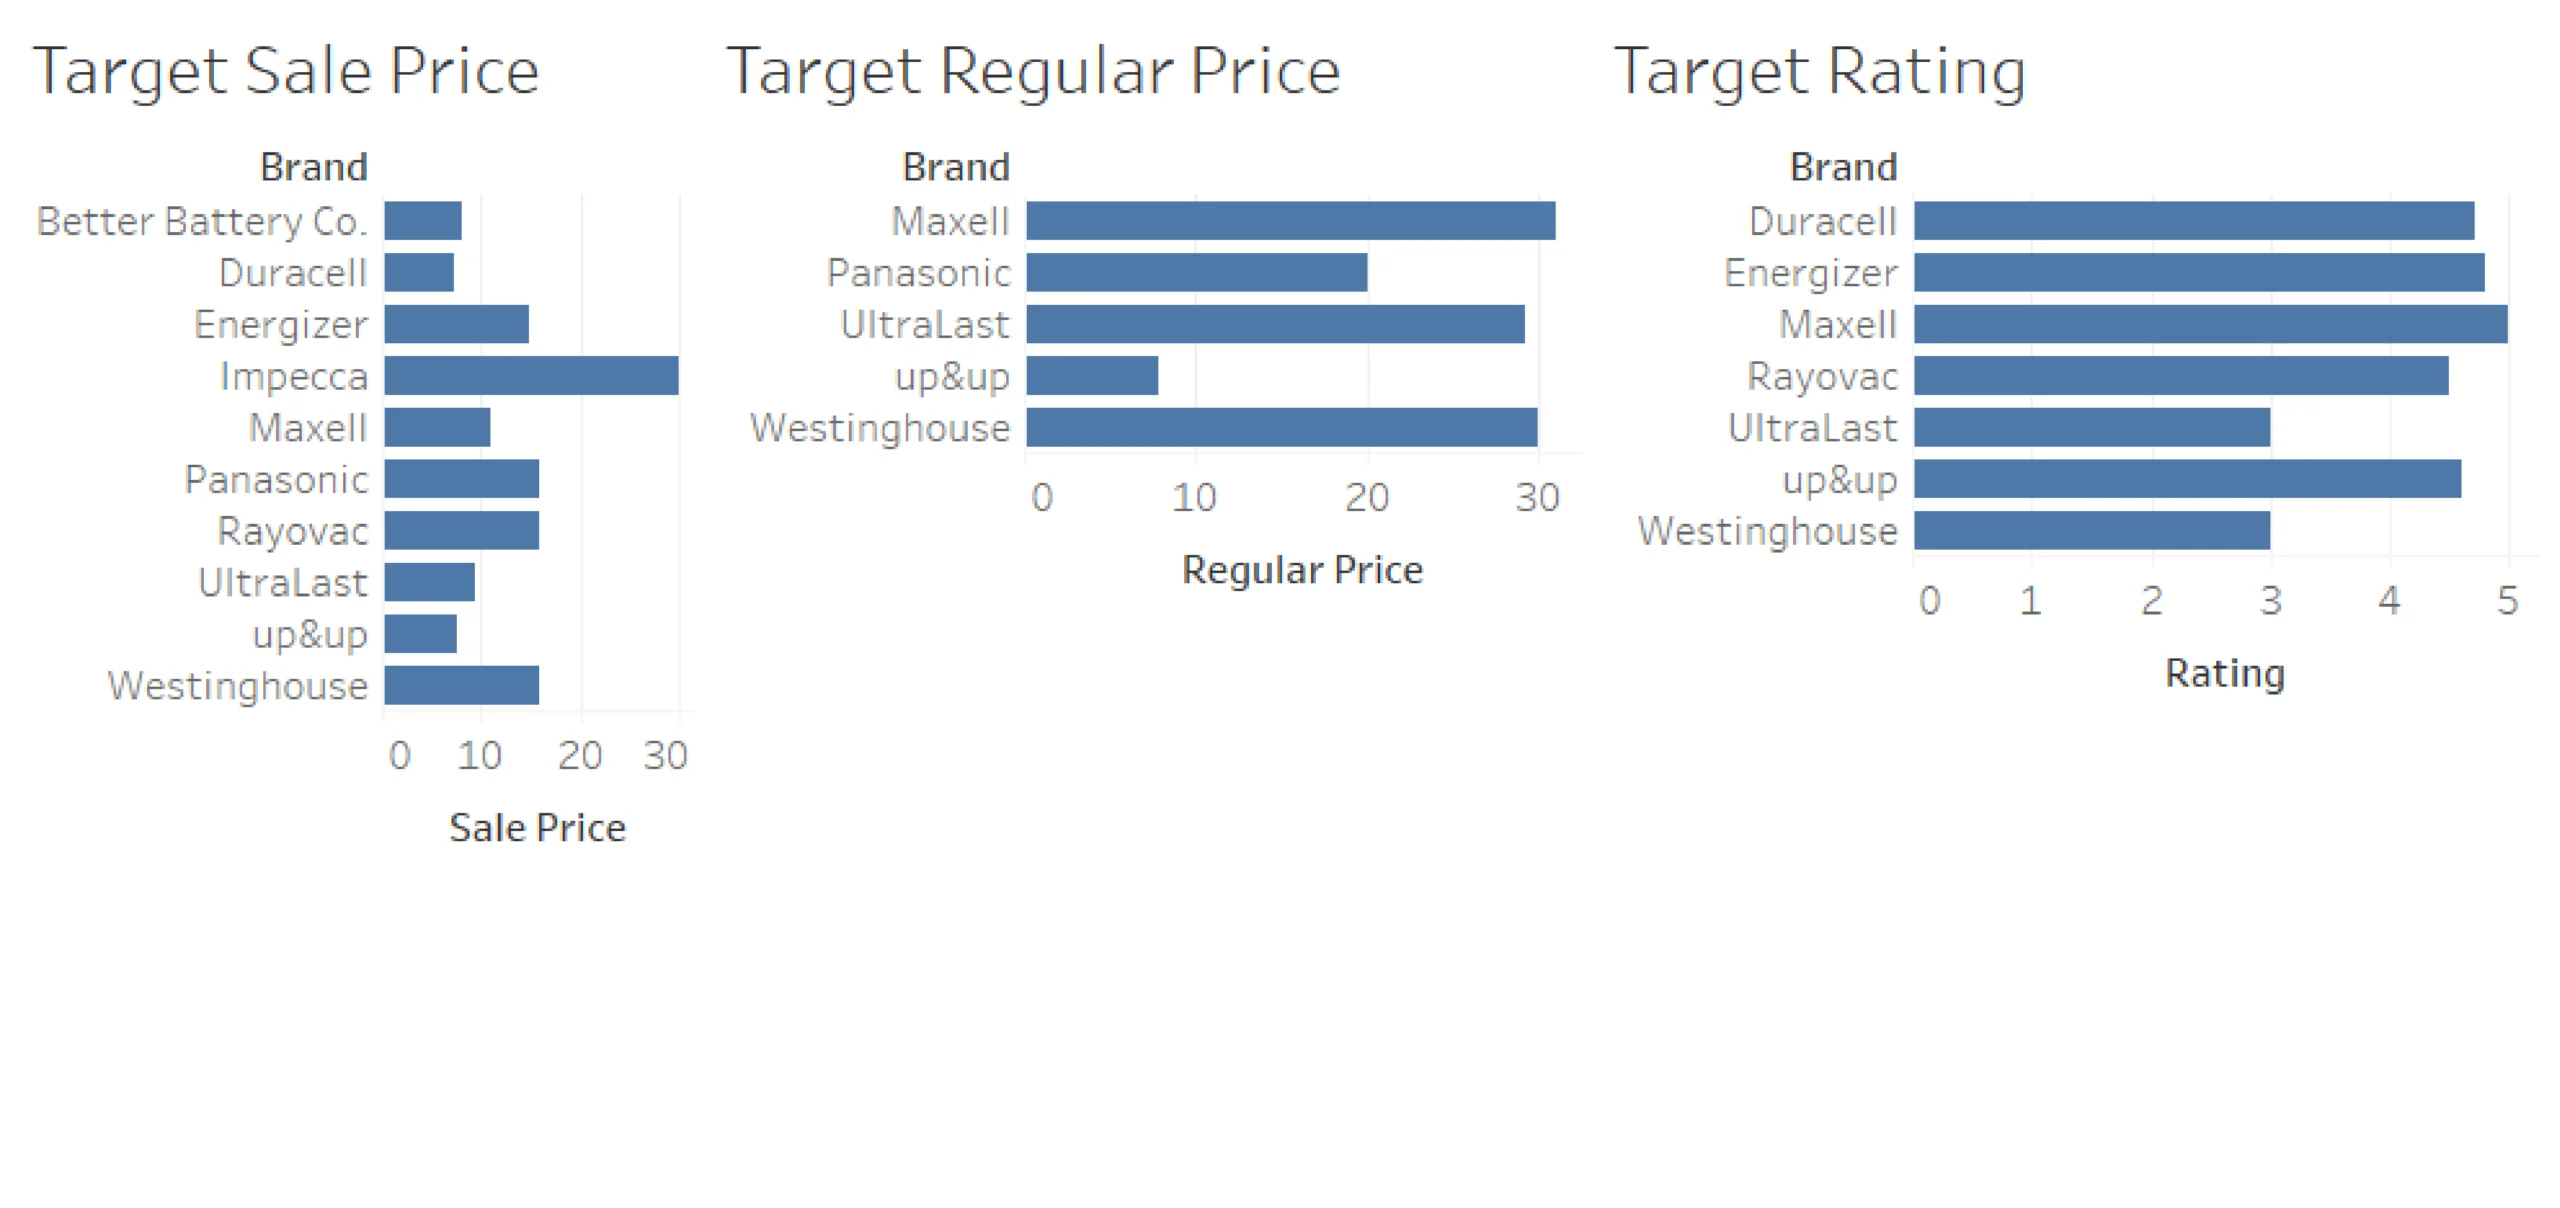
Target:
Visualizing Scraped Data Using Looker Studio
Looker Studio (previously Google Data Studio) is a free data visualization tool. The Looker Studio can sync all your data sources into a single report.
A majority of its features are easy to use, share, and schedule. The Data Studio is similar to Google Analytics but is limited to certain features.
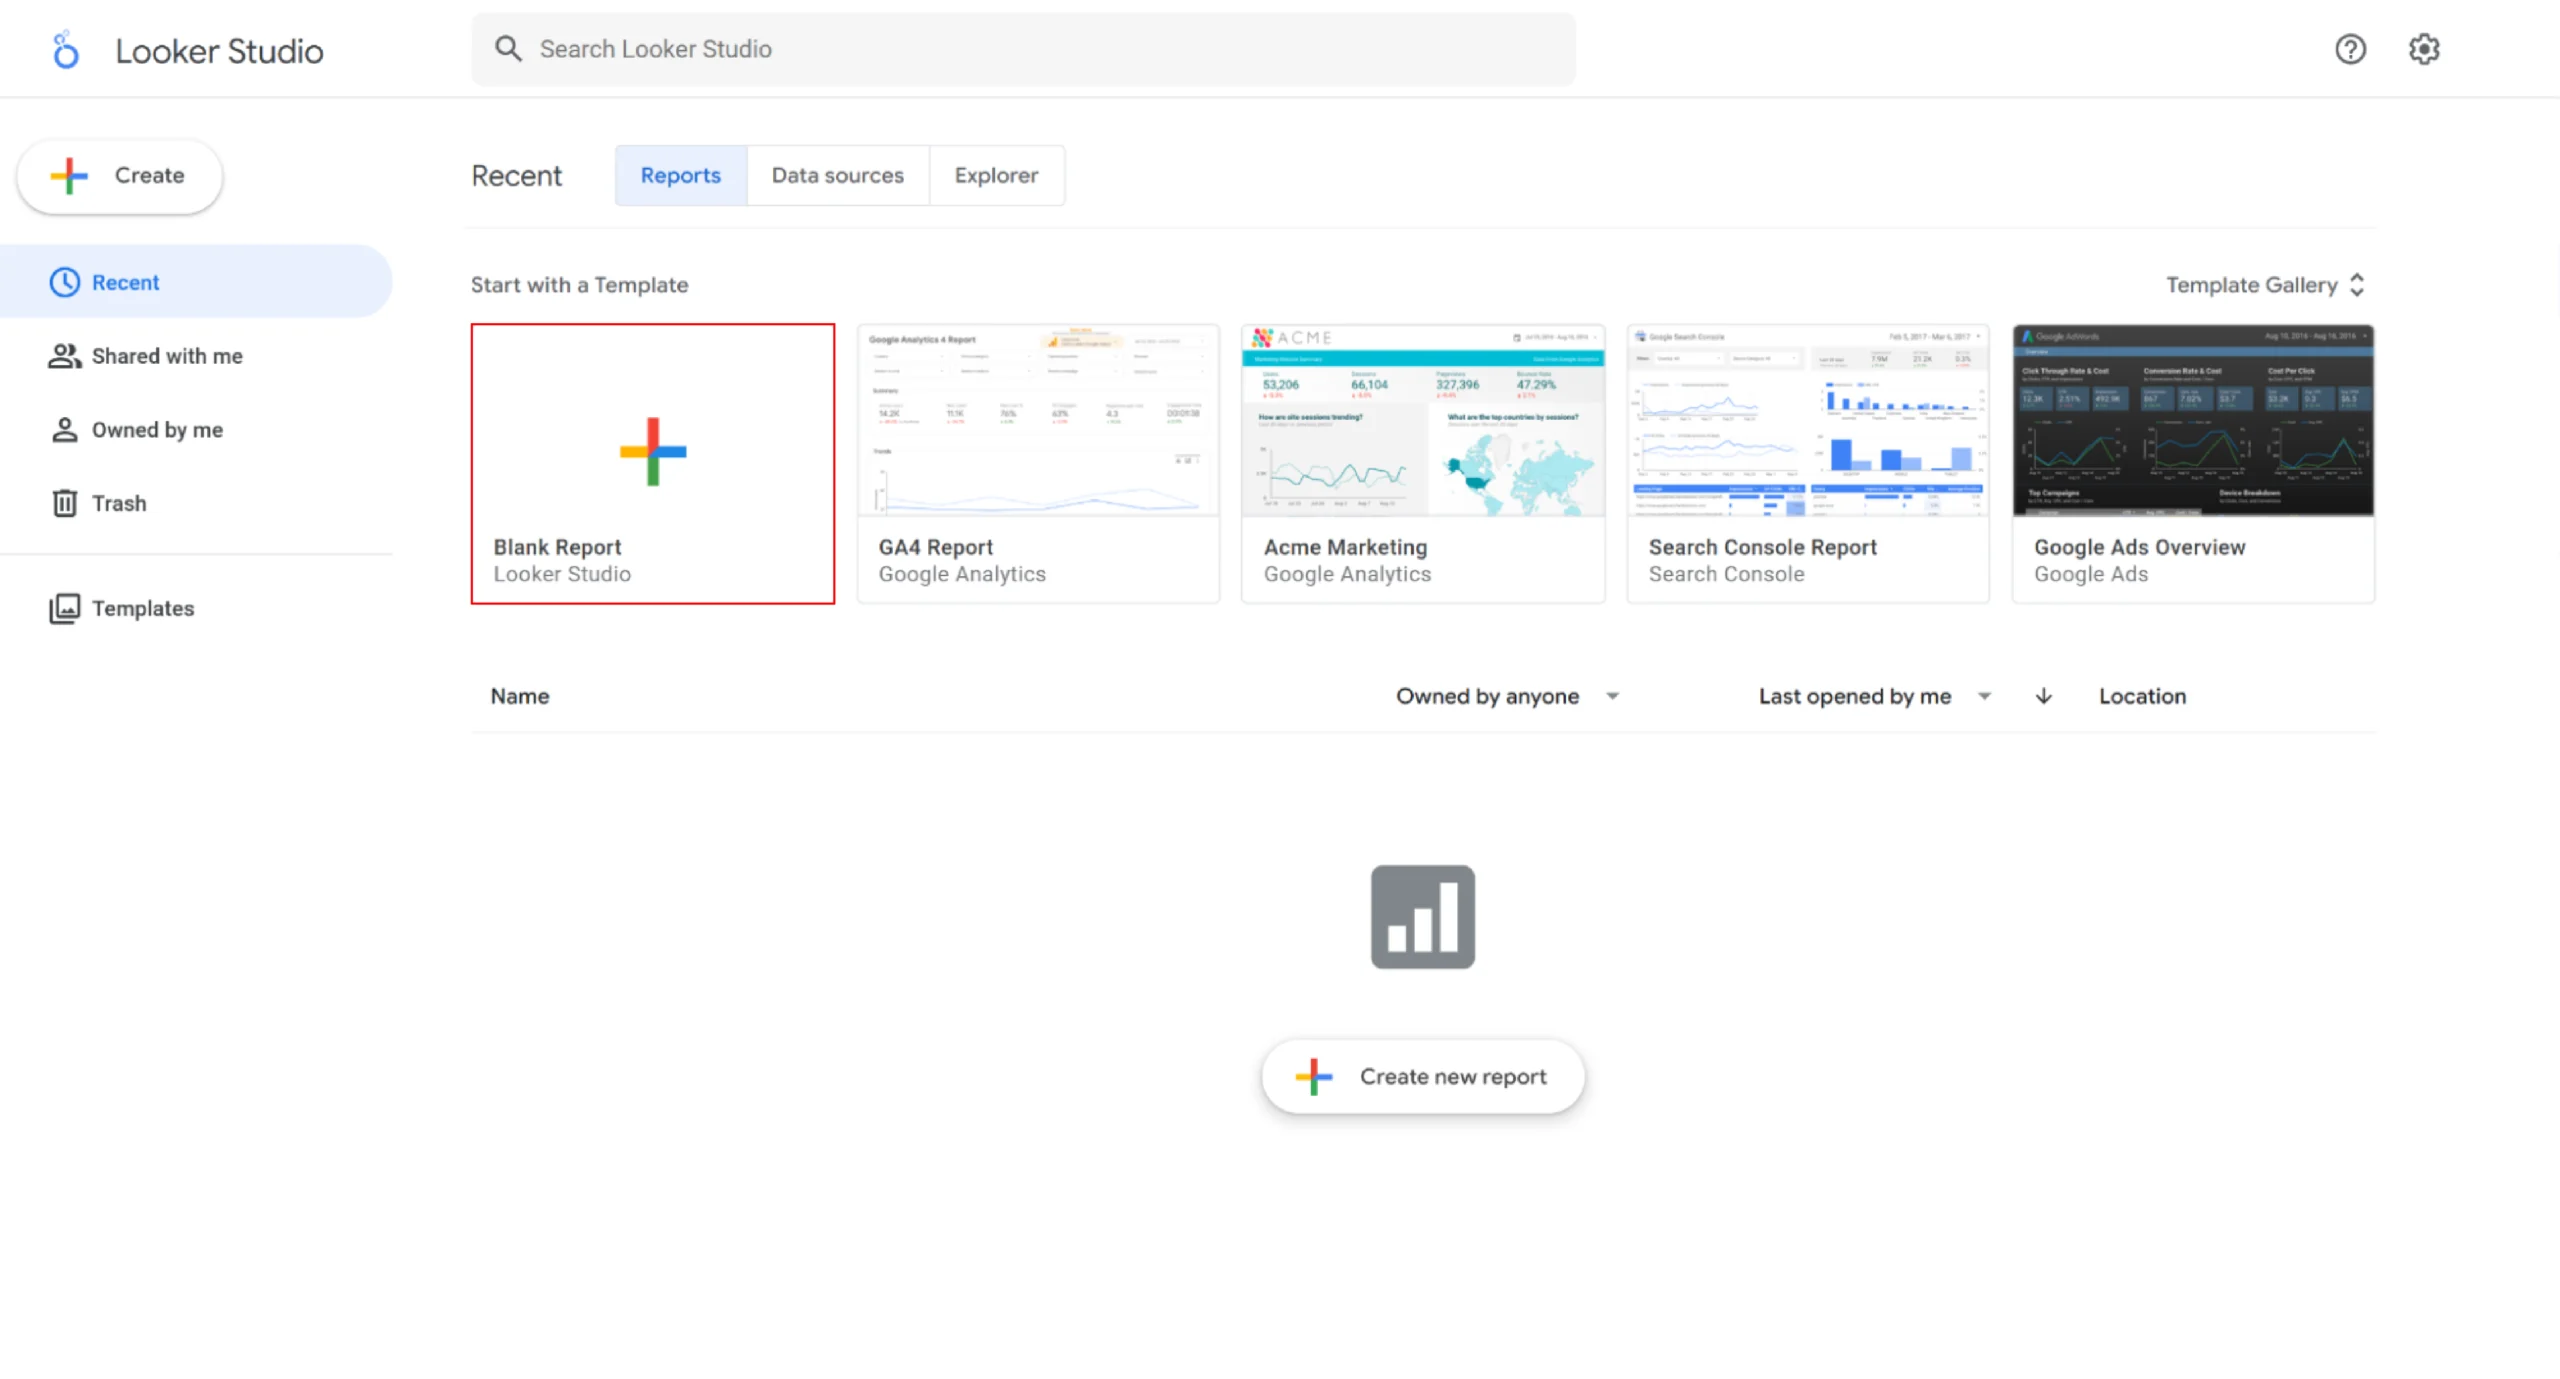
To get started, you must have an existing Google account and sign in to Looker Studio. On the home page, you will find the reports and the data sources tool.
Reports let you create interactive data visualizations and data sources connected to the underlying data, such as Google Sheets, AdWords, Analytics, etc.
1. To create a report, click on Blank Report.
2. Then click on Add Data to connect to your data sources.
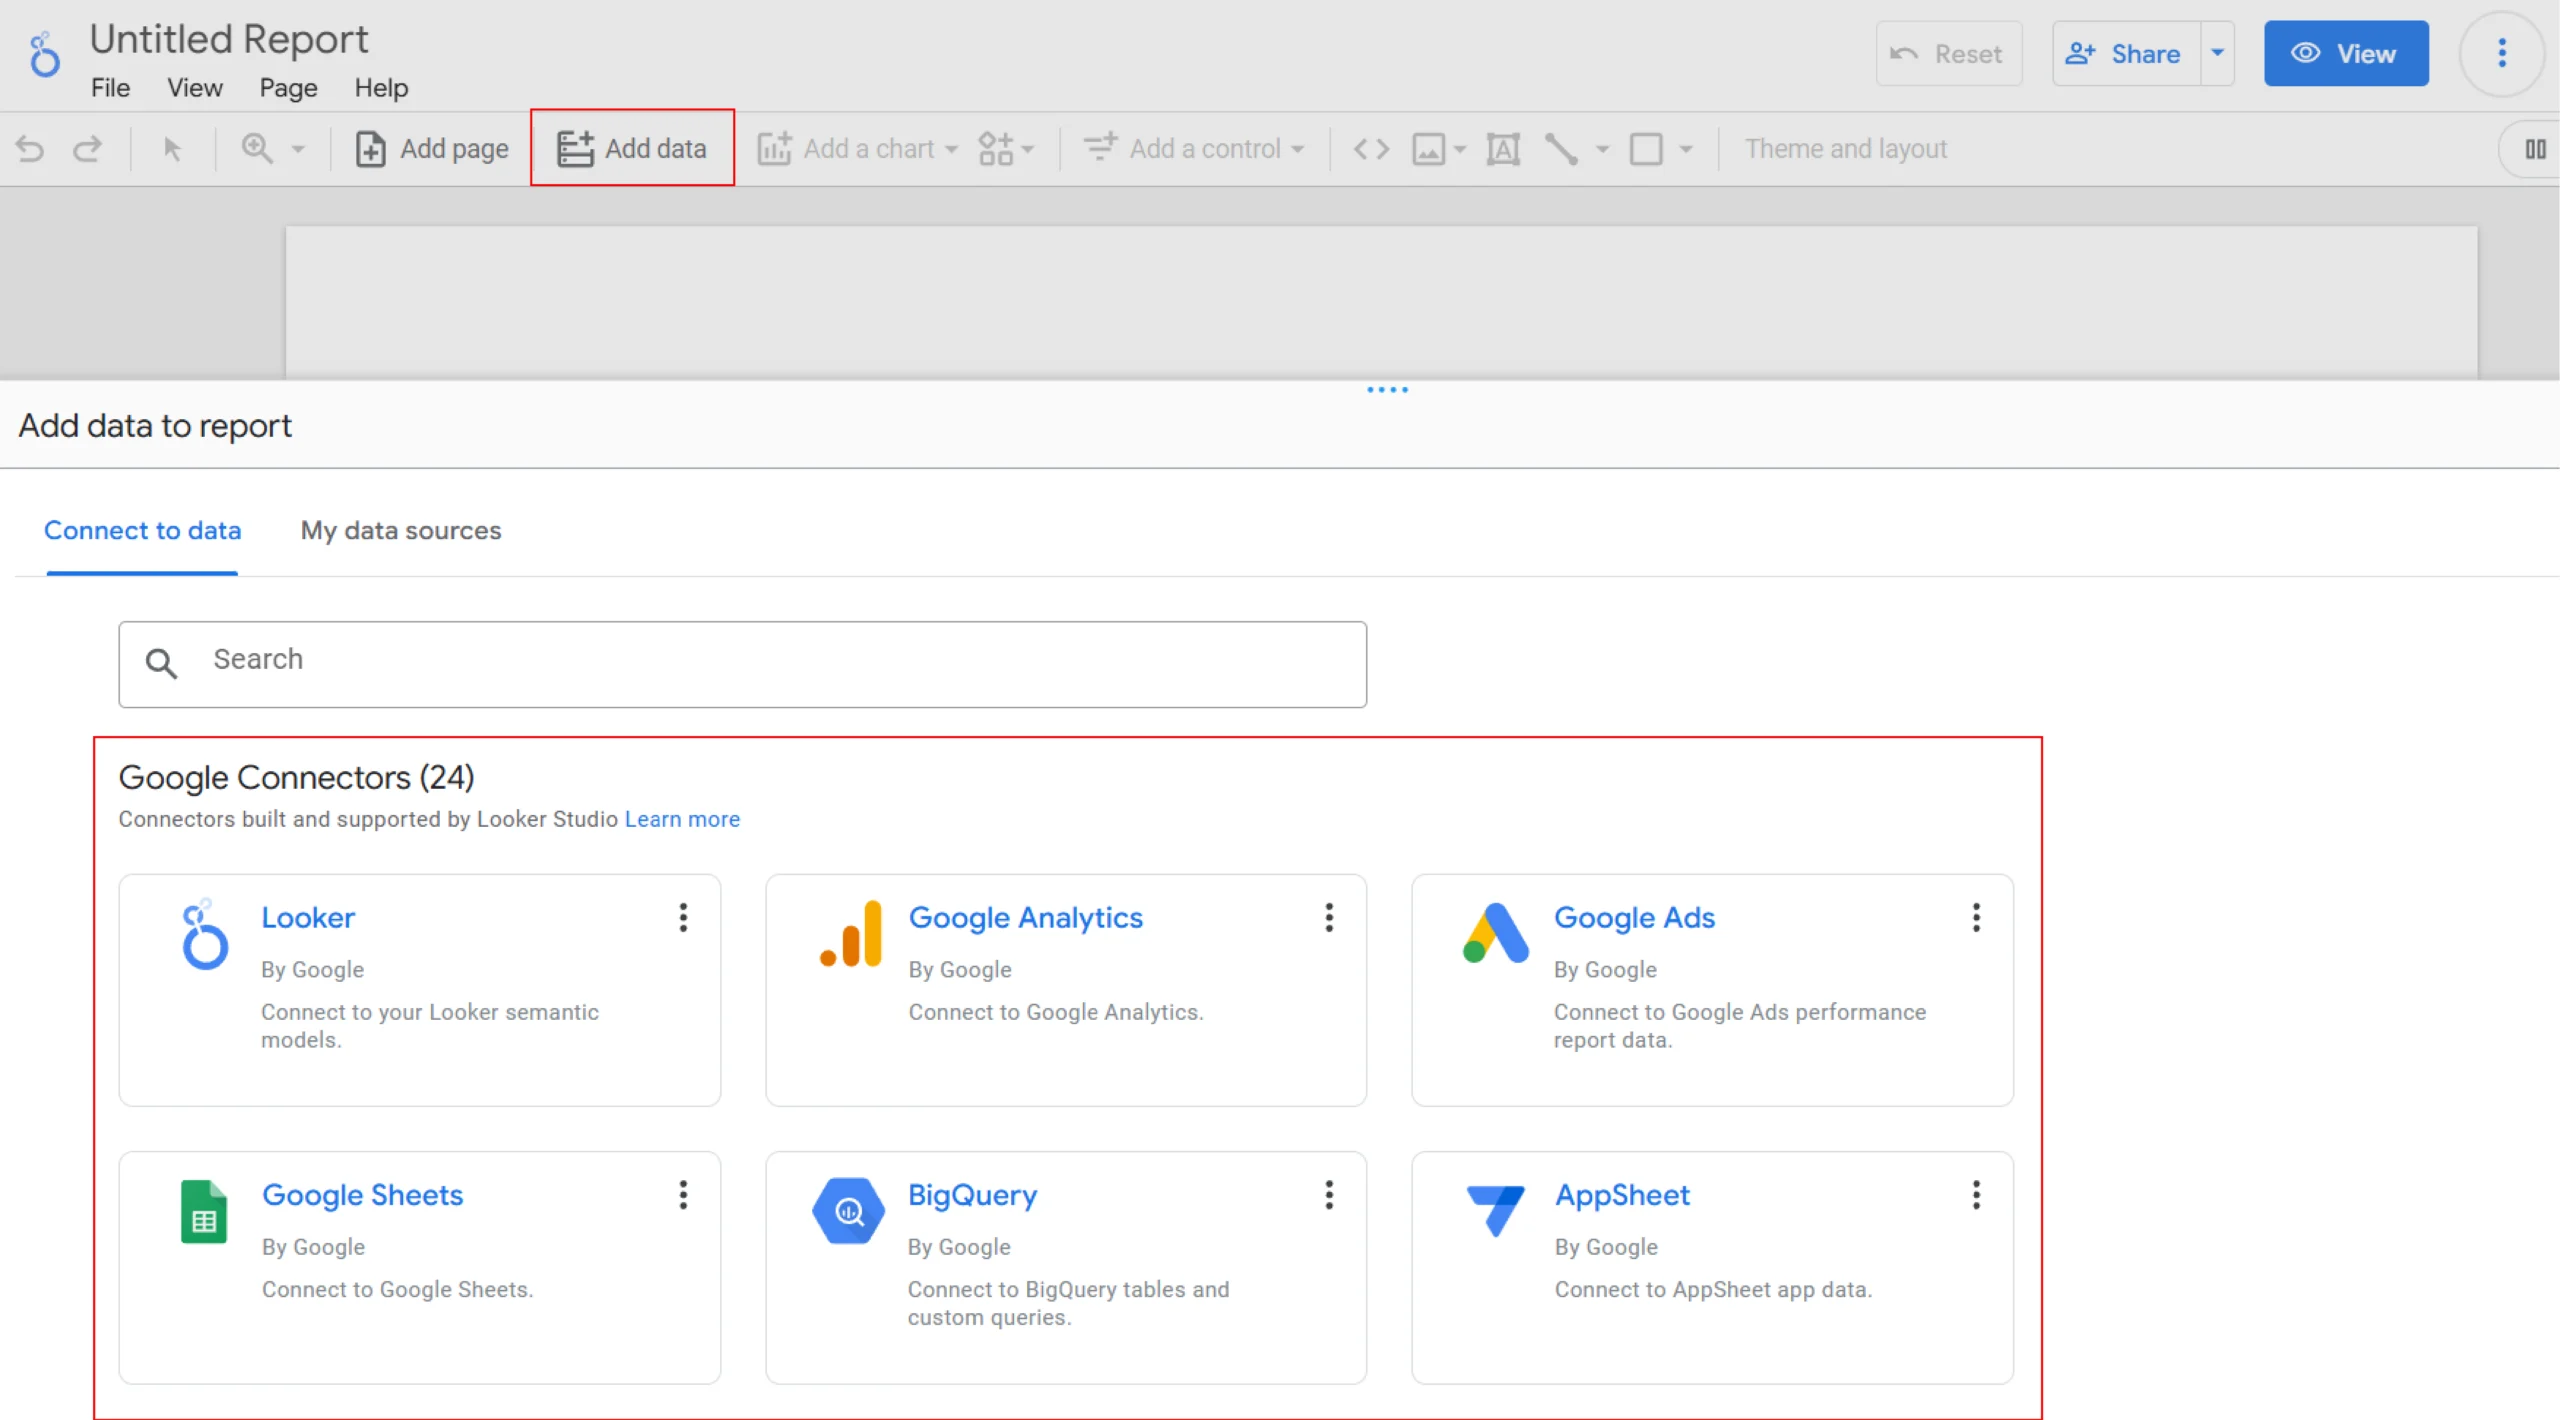
3. After adding the data, you can start creating a data report. You can click on Add a chart to select the visualization needed.
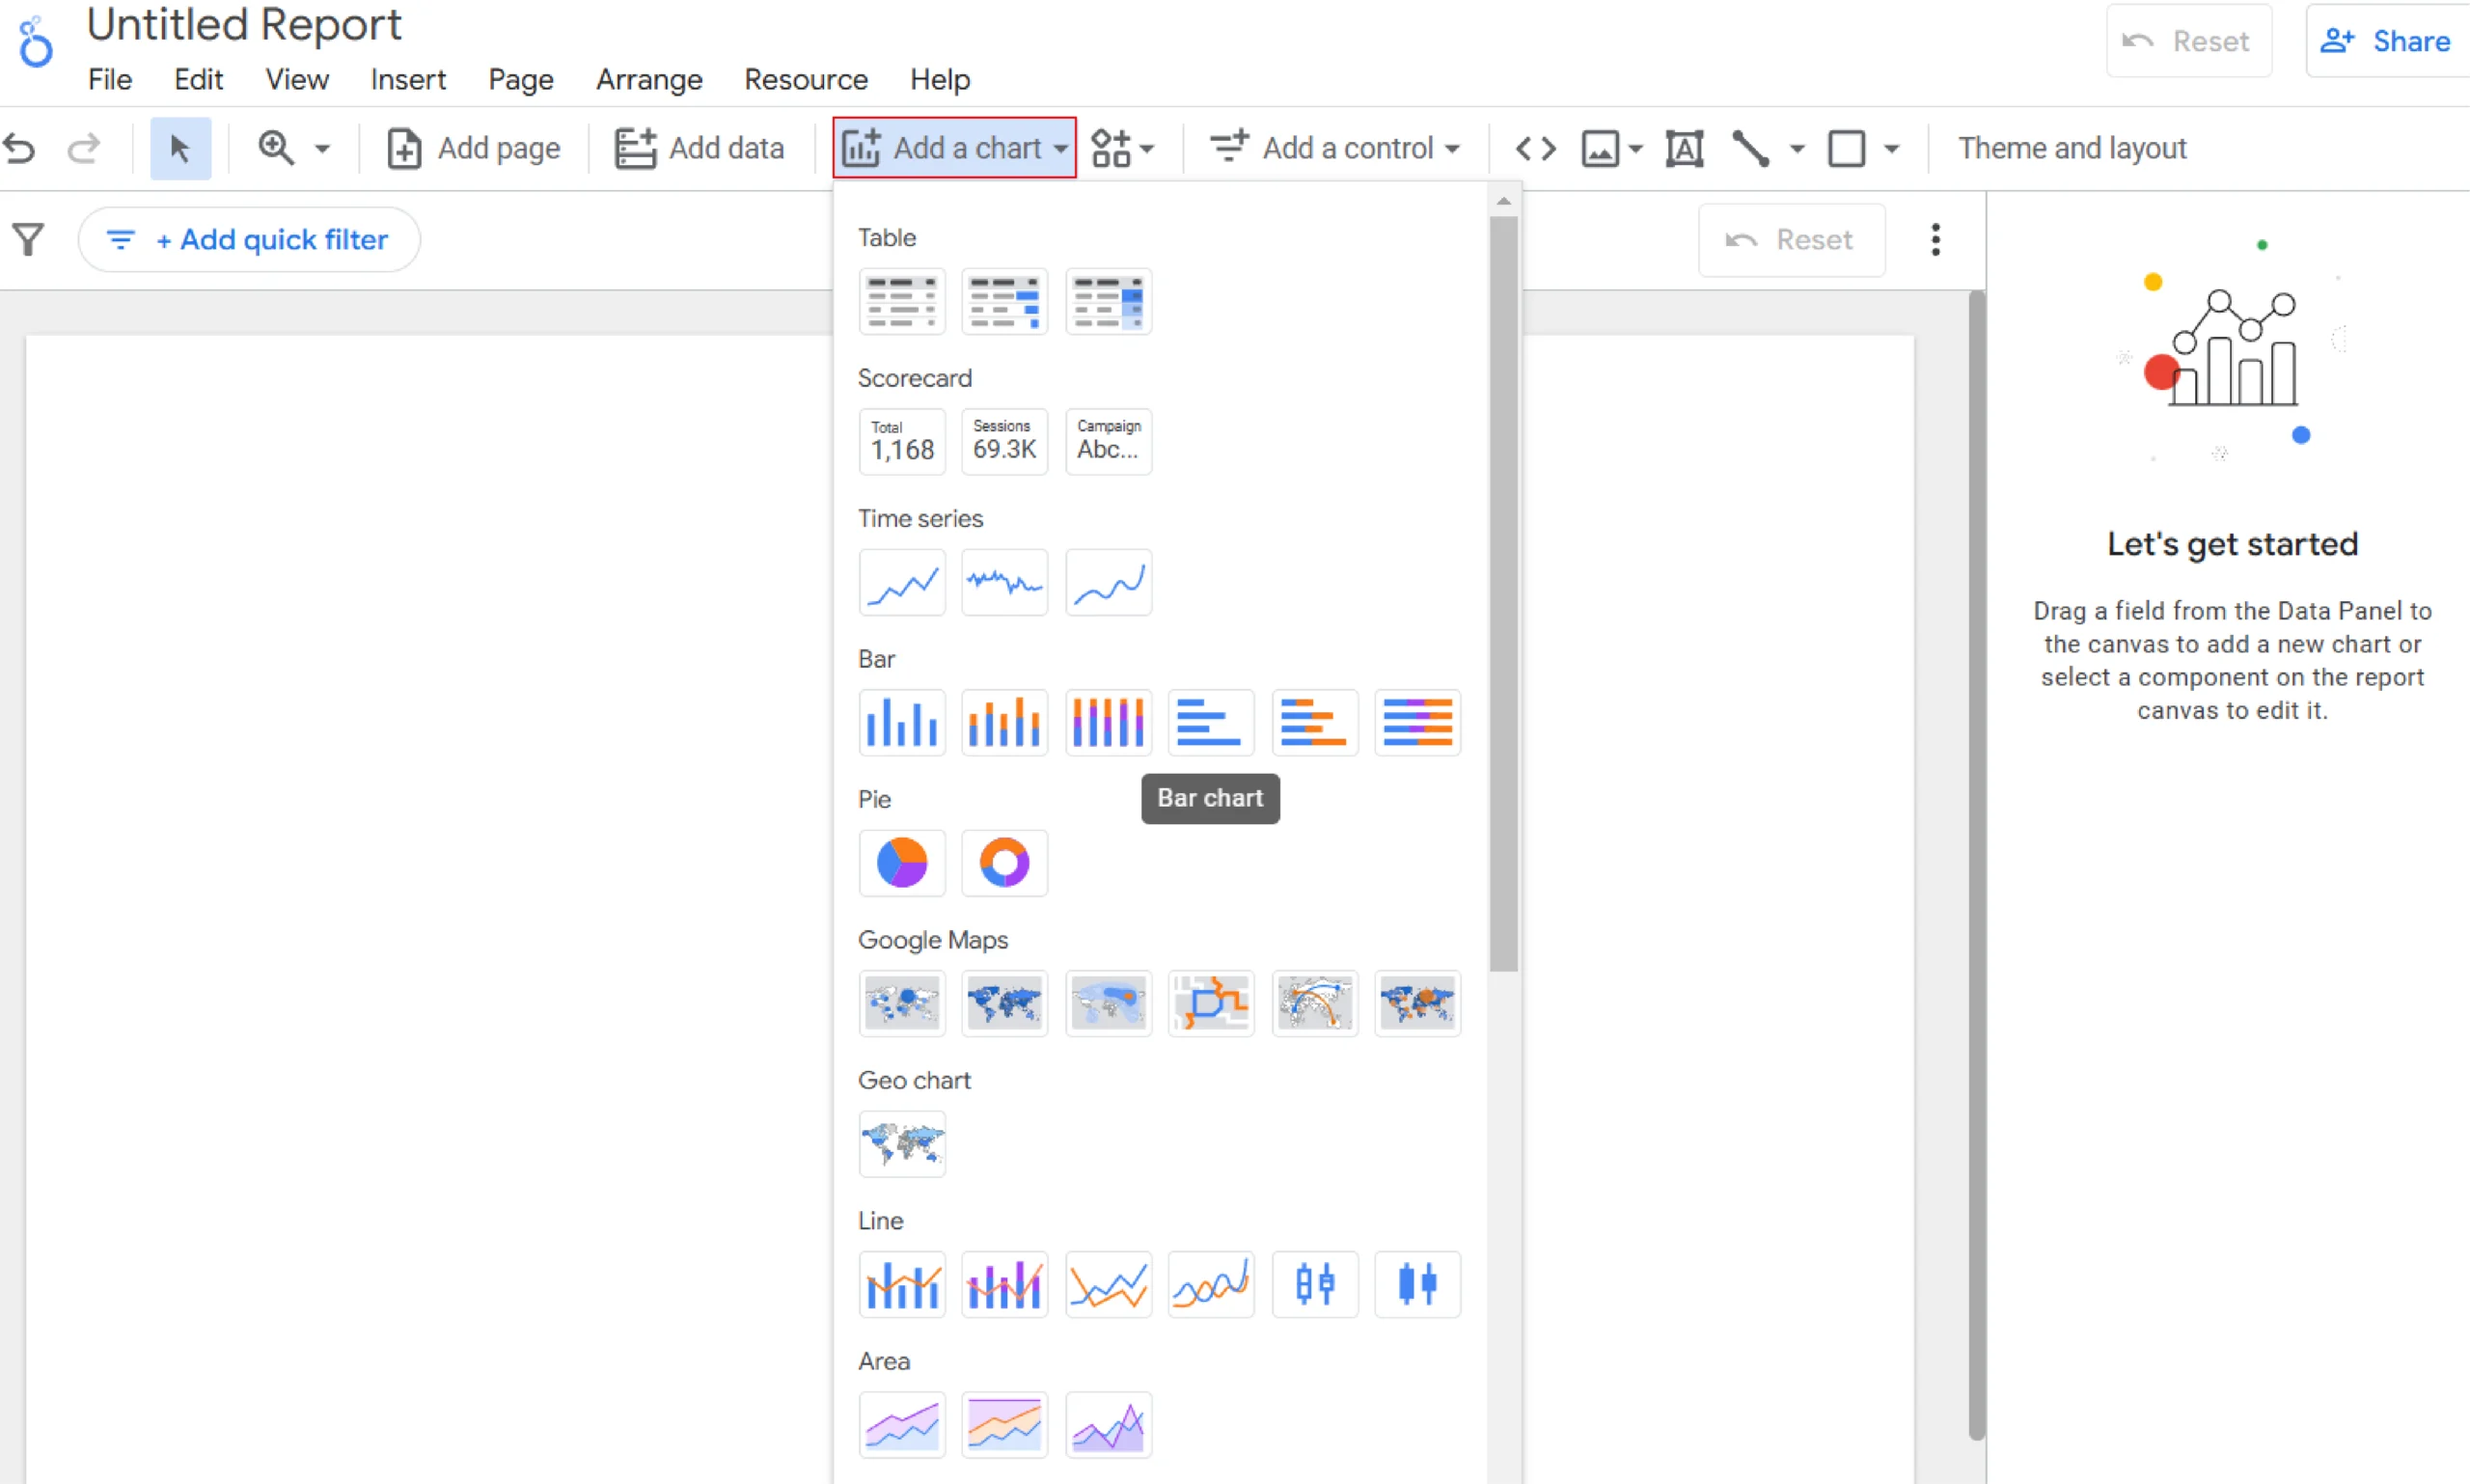
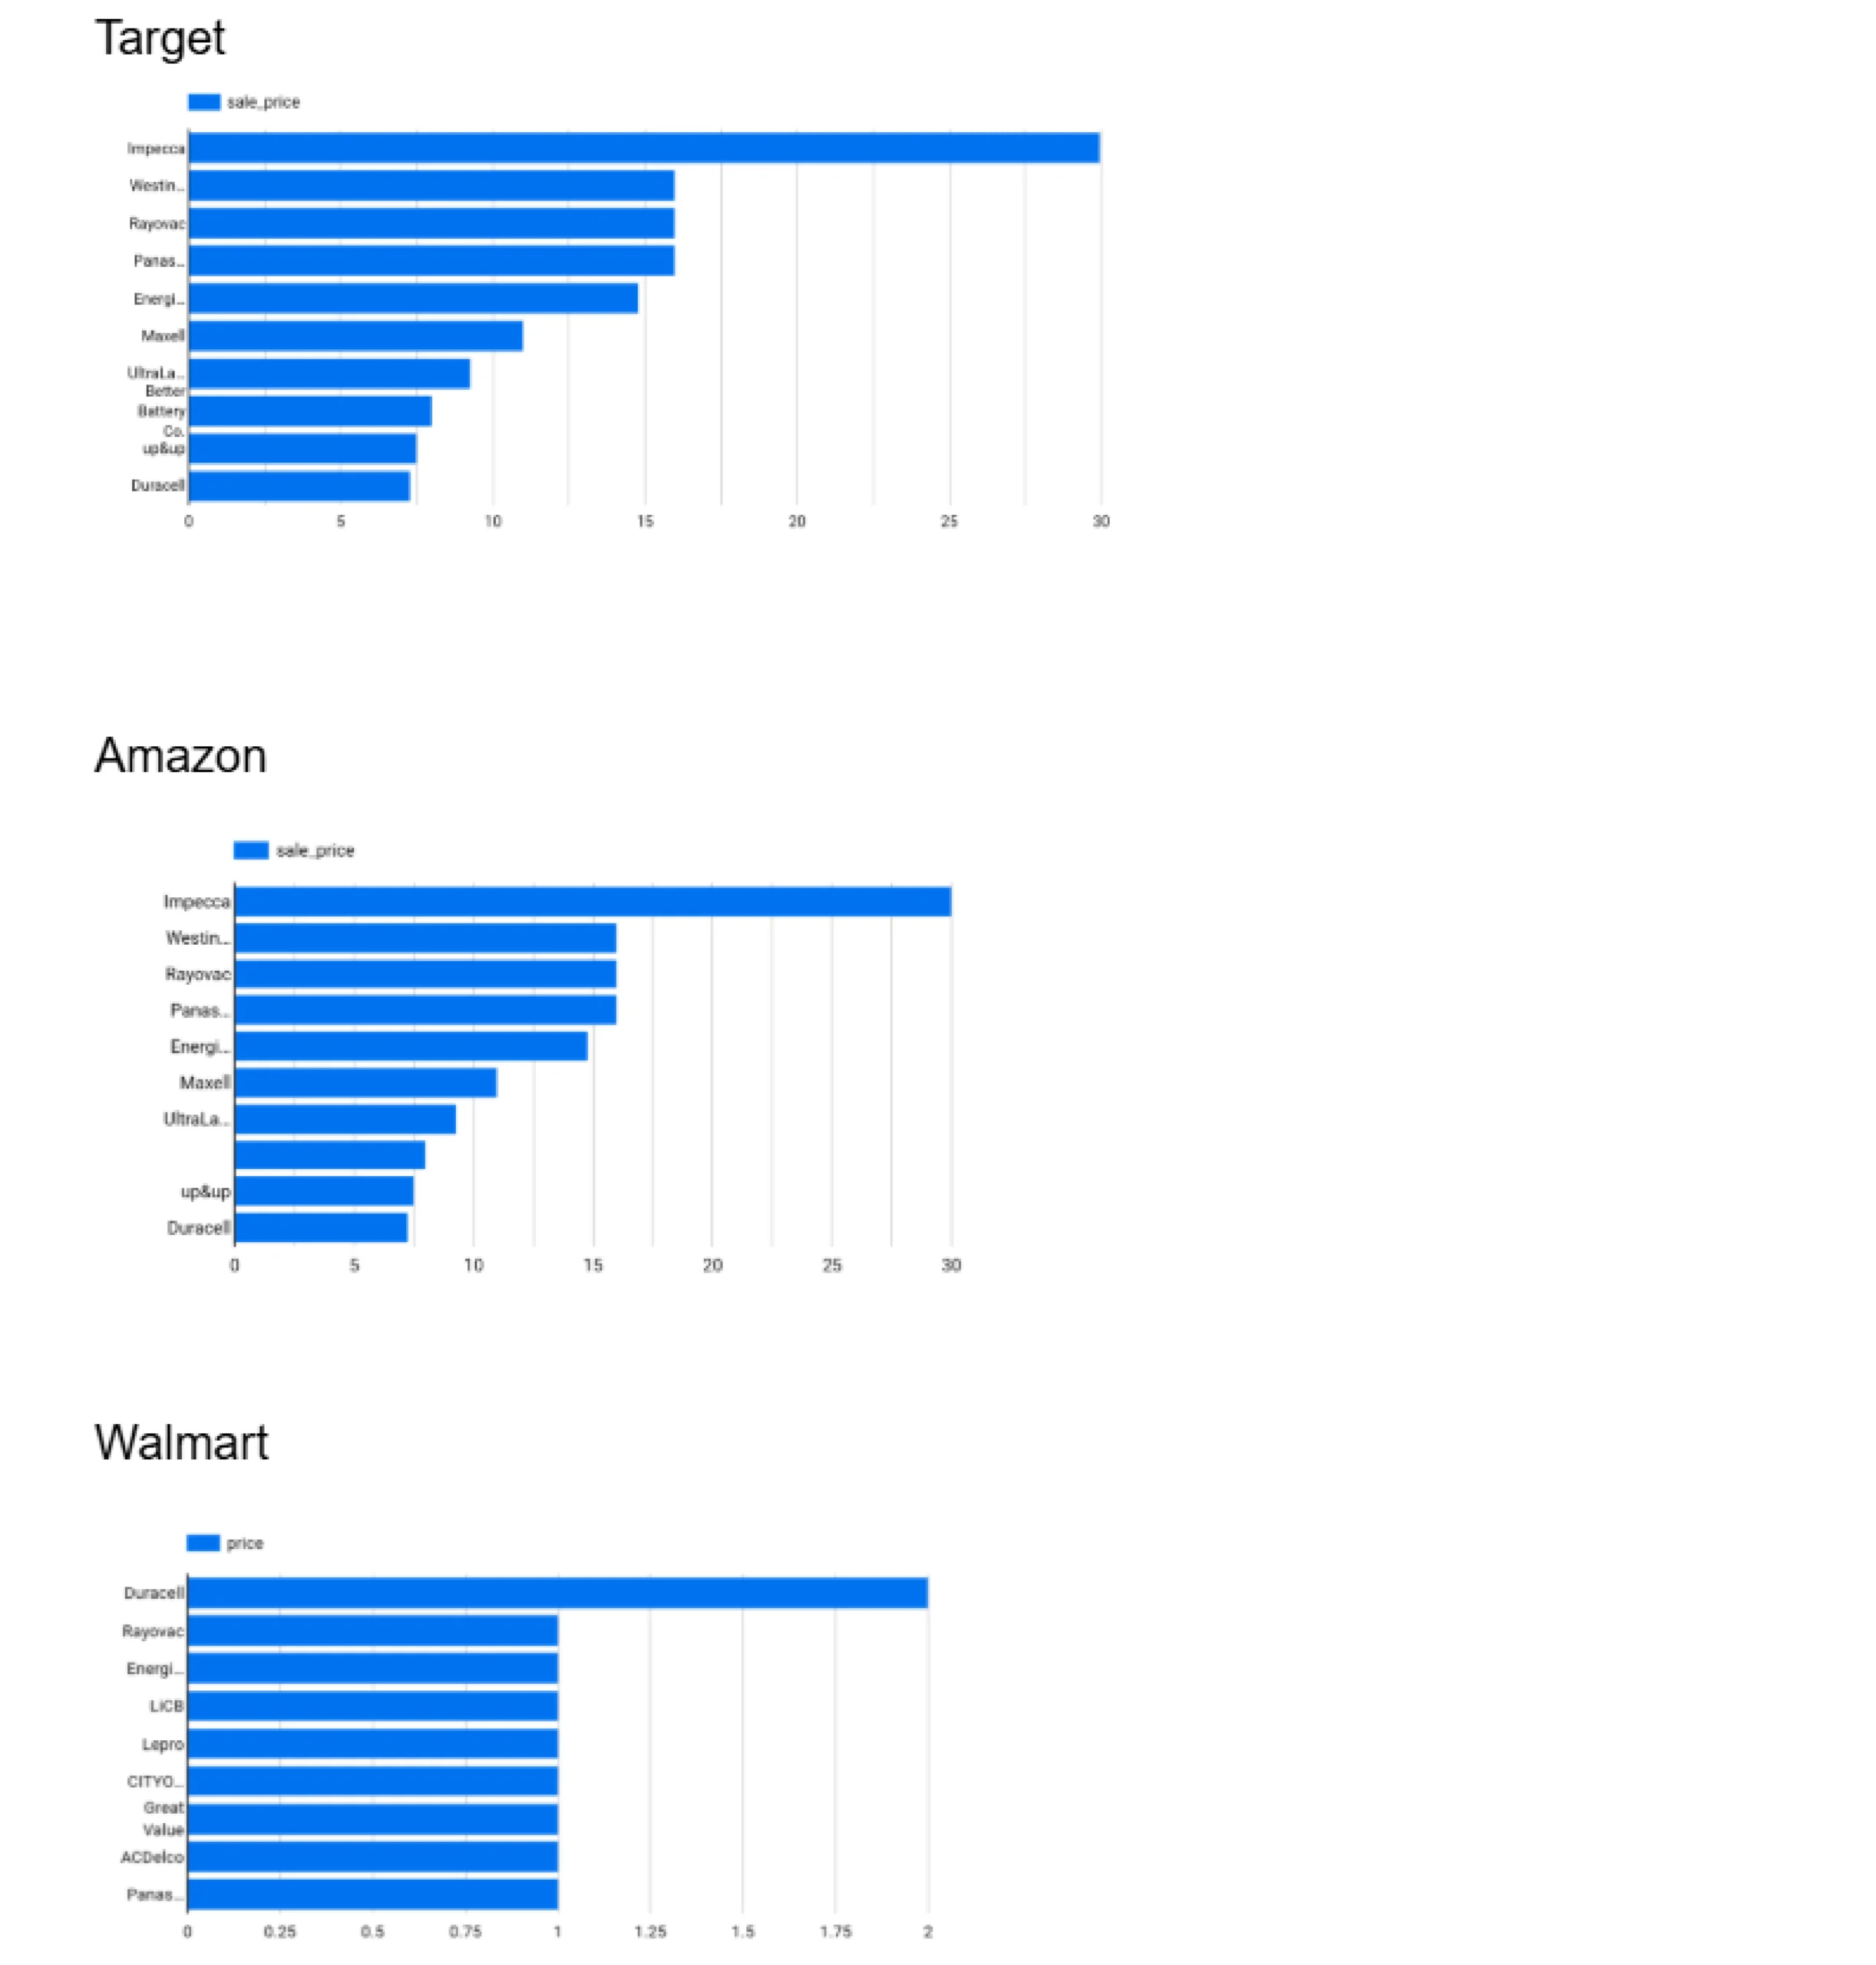
Here is how you can monitor brands under Amazon, Walmart, and Target:
Get Accurate Price Monitoring Data With ScrapeHero
For effective price monitoring, you require reliable data. The foundation of any price tracking or competitor analysis strategy depends on accurate, up-to-date product information.
ScrapeHero web scraping service can deliver high-quality e-commerce data for your visualization and analysis, which ensures the latest market insights.
We can also create tailored solutions, gathering data from multiple e-commerce websites at scale. Whether you need regular updates or more data points, we provide the precise data required to keep your pricing strategy competitive.
Frequently Asked Questions
A no-code dashboard analytics platform allows you to build data visualizations without programming. Some examples include Power BI and Zoho Analytics.
The best platform to create a dashboard depends on your needs. Microsoft Power BI Tableau and Looker Studio are some popular choices for creating interactive dashboards.
To create a program dashboard, you have to integrate data sources, design visual elements, and set up real-time updates using analytics tools like Power BI or Tableau.