What You Will Learn
- What is the Amazon US protein powder market?
- How big is the protein powder market on Amazon?
- What are the best-selling protein powders on Amazon?
- Which protein powder brands have the most listings on Amazon?
- What is the average price of protein powder on Amazon?
- How was this data collected?
What Is the Amazon US Protein Powder Market?
This analysis uses Amazon’s category labels, which include some ready-to-drink and supplement products. See the scope note for details.
The Amazon US protein powder market is a catalog of protein powder listings sold on Amazon US. It is not the total US protein powder market, so the figures below describe Amazon shoppers only.
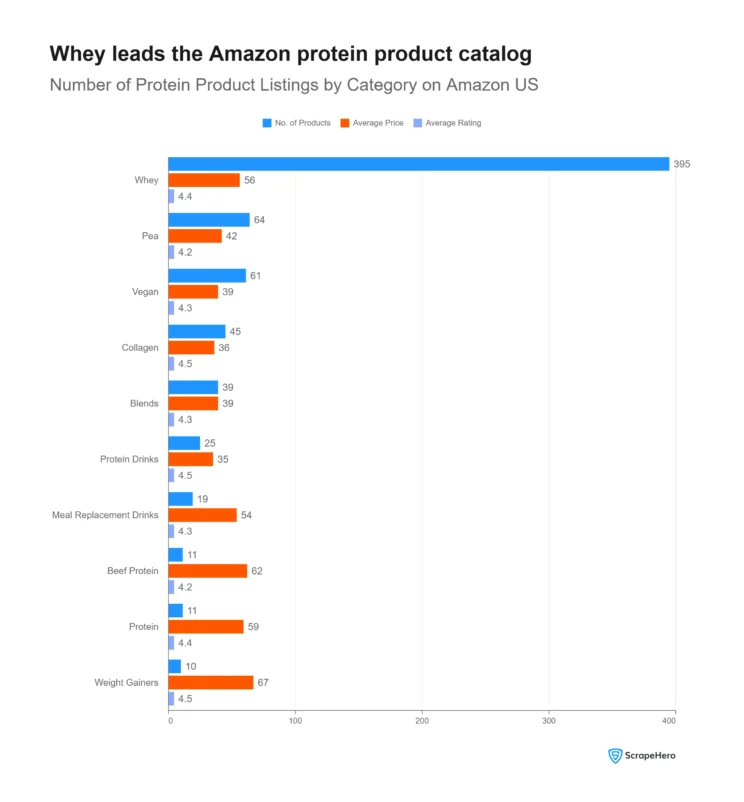
Whey protein is the dominant category. Of the 771 products analyzed, 395 are whey products, which is more than the next several categories combined. Pea protein follows with 64 products, and vegan protein has 61.
| Category | Number of Products | Average Price | Average Rating |
|---|---|---|---|
| Whey | 395 | $56 | 4.4 |
| Pea | 64 | $42 | 4.2 |
| Vegan | 61 | $39 | 4.3 |
| Collagen | 45 | $36 | 4.5 |
| Blends | 39 | $43 | 4.3 |
| Protein Drinks | 25 | $35 | 4.5 |
Protein drinks, meal replacement drinks, and other non-powder items are included as Amazon categorizes them.
Every major category averages above 4 stars. Ratings are not what separates products here. Buyers rate most protein powders well, so shoppers usually choose based on other factors like price, flavor, and brand.
How Big Is the Protein Powder Market on Amazon?
The protein powder market on Amazon US includes 771 products from 190 brands, sold by 185 sellers. These are listing counts, not sales revenue, so the numbers show how crowded the market is, not how much money it makes.
Here is the scale at a glance:
| Metric | Count |
|---|---|
| Products Analyzed | 771 |
| Categories | 40 |
| Brands | 190 |
| Sellers | 185 |
| Prime-Eligible Products | 759 |
| Sponsored Products | 174 |
| Total Reviews | 17 million |
Most of the catalog is available with fast shipping. 759 of the 771 products are Prime-eligible, so nearly every listing in the dataset qualifies for Amazon’s Prime shipping.
Reviews are heavy. The 17 million total reviews show that buyers actively rate these products. Across the dataset, that works out to an average of roughly 22,000 reviews per product, though a few high-volume products account for much of that total.
Sponsored listings are a small share. Only 174 products (about 23%) are sponsored, so most of the market shows up in organic results.
What Are the Best-Selling Protein Powders on Amazon?
The best-selling products on Amazon US are mostly ready-to-drink shakes and collagen powders, not standard whey tubs. The report groups these products by sales volume bands, with the highest bands starting at 40,000 units.
The most common sales band is 1K+, which describes 198 products that sold at least 1,000 units. Only 12 products fall in the 9K+ band, so the top of the market is small.
| Product | Brand | Category | Average Price | Total Reviews |
|---|---|---|---|---|
| Core Power Elite High Protein Shake, Chocolate, 12 Pack | Core Power | Protein Drinks | $50.98 | 74,793 |
| Vital Proteins Collagen Peptides Powder Advanced, Unflavored, 20 oz | Vital Proteins | Collagen | $42.99 | 214,596 |
| Sports Research Collagen Peptides Powder, Unflavored, 16 oz | Sports Research | Collagen | $32.95 | 129,849 |
| Optimum Nutrition Creatine Monohydrate Powder, 60 Servings | Optimum Nutrition | Creatine | $14.68 | 311,189 |
Most of these products have strong review counts. Except for one product, each has more than 10,000 reviews, which suggests steady buyer activity.
The list is not a ranking. The report shows these products as a group, not in order of units sold, so avoid calling any one product “the top seller.”
Several top sellers are not powders. Core Power products are shakes, and the creatine and collagen products are supplements.
Which Protein Powder Brands Have the Most Listings on Amazon?
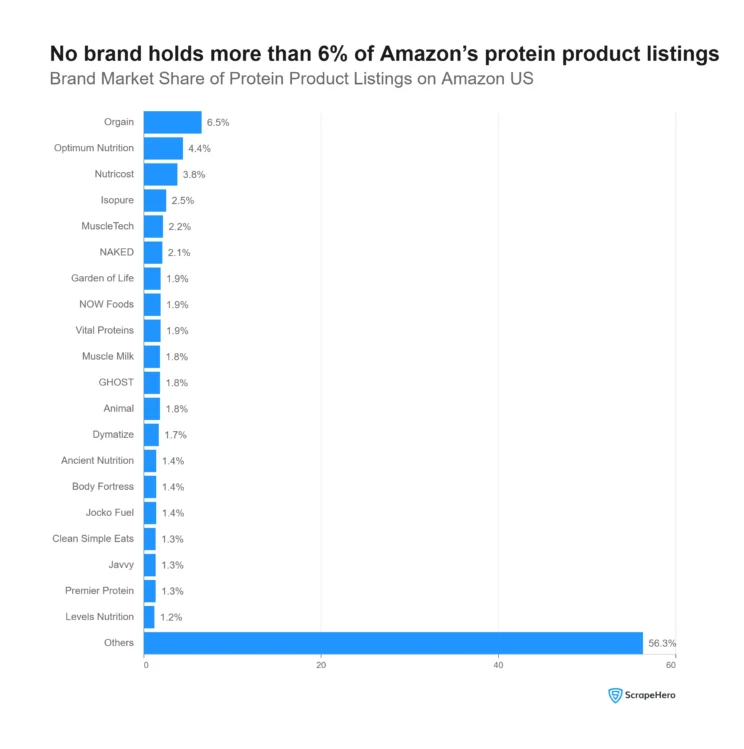
Orgain has the most listings on Amazon US, with 50 products, followed by Optimum Nutrition with 34. These counts measure how many products each brand lists, not how many units they sell.
[Note: We scraped these details using ScrapeHero Cloud’s Amazon Search Result Scraper]
| Brand | Number of Products | Average Price | Average Rating |
|---|---|---|---|
| Orgain | 50 | 30 | 4.5 |
| Optimum Nutrition | 34 | 72 | 4.6 |
| Nutricost | 29 | 66 | 4.3 |
| Isopure | 19 | 35 | 4.4 |
| MuscleTech | 17 | 71 | 4.5 |
| NAKED | 16 | 54 | 4.3 |
Product count and price don’t move together. Orgain has the most listings but one of the lowest average prices. Optimum Nutrition and MuscleTech have fewer listings but higher average prices, closer to $70 to $72.
No single brand controls the market. Across all 190 brands, the top 3 combined hold about 14% of listings. The remaining brands, grouped as “Others,” account for 56%. This tells you the market has many small players rather than a few dominant ones.
Amazon.com itself is the top seller. By product count, Amazon.com lists 268 protein products, more than any third-party seller. eSupplements follows with 30 listings at a higher average price of $66, while Vital Proteins lists 13 products at a lower average price of $30.
Sponsored listings favor different brands. Ancient Nutrition leads sponsored product count with 9, followed by Nutricost with 8.
What is the Average Price of Protein Powder on Amazon?
The average price across all 771 products analyzed is $49.07. This figure spans a wide range of pack sizes and product types, so it doesn’t reflect a like-for-like comparison, and it shouldn’t be read as a per-pound or per-serving price.
The most expensive listings cluster near $120 to $130. Nine of the ten priciest products fall in that range. The single most expensive product, an Optimum Nutrition Gold Standard Pro Gainer at $248.90, is a 10-pound combo pack, which explains why it stands well above the rest. Most other high-priced listings are 5-pound tubs, so size drives much of the difference here rather than the brand or ingredients.
The lowest-priced listings range from about $11 to $18. This range can reflect smaller pack sizes or a different product type, not necessarily a better value. A closer look shows why:
- The cheapest product on the list is a meal replacement shake, not a protein powder
- Several others are collagen powder and creatine powder, which are priced differently than whey or plant-based protein
- Pack sizes in this group are not consistent, so a lower price doesn’t always mean a lower cost per serving
| Category | Average Price |
|---|---|
| Weight Gainers | $67 |
| Beef Protein | $62 |
| Protein | $59 |
| Meal Replacement Drinks | $54 |
| Whey | $56 |
| Vegan | $39 |
| Blends | $43 |
| Pea | $42 |
| Protein Drinks | $35 |
| Collagen | $36 |
Weight gainers carry the highest average price, and protein drinks the lowest. This pattern holds across the sponsored listings too, where whey averages $70 and vegan averages $43.
A note on what this data can’t tell you. None of these figures account for pack size, so a $50 product could cost more or less per serving than a $30 product. A price-per-pound or price-per-serving comparison would give a more accurate read on value, but that wasn’t part of this analysis. Matching equivalent products across different pack sizes is exactly the kind of problem a price monitoring service is built to solve.
See the scope note below for how the dataset was built.
Key Takeaways from Amazon US Protein Powder Market Analysis by ScrapeHero
- Whey protein dominates the catalog. Of 771 products analyzed, 395 are whey, more than every other category combined.
- The market is fragmented. No single brand holds more than 6% of listings, and the top 3 brands together account for about 14%.
- Orgain leads by listing count, not by price. Orgain has the most products (50) but one of the lowest average prices ($30), while Optimum Nutrition and MuscleTech list fewer products at higher average prices (around $70 to $72).
- Amazon.com is the top seller by product count, with 268 listings, more than any third-party seller.
- Ratings stay high across the board. Every major category averages above 4 stars, so satisfaction isn’t what separates products in this market.
- Prices vary more by pack size and product type than by brand. The highest-priced listings are mostly large combo packs, and the lowest-priced listings include meal replacement, collagen, and creatine products, not just smaller whey tubs.
- Sales volume concentrates at the lower bands. The 1K+ band is the most common, with 198 products, while only 12 products reach the 9K+ band.
How Was this Data Collected?
This analysis is built from Amazon US protein product listings, gathered with ScrapeHero Cloud Amazon Search Result Scraper between August 12 and 19, 2026. The dataset covers 771 products across 40 categories, 190 brands, and 185 sellers.
Scope note: This analysis uses Amazon’s own category labels for protein products. The category set includes whey, pea, vegan, and collagen powders, along with protein drinks, meal replacement drinks, creatine, and weight gainers. Not every product in the dataset is a powder in the strict sense, so some figures include ready-to-drink and supplement products. Category labels are used as Amazon defines them, and figures are listing counts, not verified sales.
What the numbers represent:
- Product and brand counts come directly from Amazon’s listings during the collection window.
- Sales volume bands (like 1K+ or 2K+) are Amazon’s own display buckets, not exact unit sales.
- Review counts and ratings reflect what was live on each listing at the time of collection and can change as new reviews come in.
- Prices are the listed price per product, not adjusted for pack size or servings.
Why this matters for how you use the data. A snapshot like this shows the shape of the market at one point in time. It’s a starting point for understanding category size, brand concentration, and pricing patterns, not a real-time tracker or a verified sales report.
Gathering this much data by hand, across hundreds of listings and dozens of brands, isn’t practical. Automated collection at this scale is what makes an analysis like this possible in the first place.
Closing Thoughts
This snapshot shows what’s possible when you can pull structured data from hundreds of product listings and turn it into clear market patterns instead of guesswork.
ScrapeHero is one of the top three web scraping services in the world, and we run on a fully managed model. You bring the questions, and our team handles the rest, from scoping your data requirements to building the scrapers to running manual QA before delivery. You don’t need technical expertise on your end, and you don’t have to chase the data yourself.
We also have the infrastructure in place to collect data at this scale, across thousands of listings and hundreds of brands, on an ongoing basis. And even as automation does more of the work, a real person reviews your data at every stage, so what lands in your hands is clean, structured, and ready to use.
If you need data like this for your own research,
Frequently Asked Questions
The report doesn’t rank every product by rating, but it shows the most-reviewed products, and nearly all of them rate above 4.5 stars. Vital Proteins Collagen Peptides Powder (1.5 million reviews) rates 4.5 stars, and Optimum Nutrition Gold Standard Whey Protein (0.7 million reviews) rates 4.6. Across the full dataset, every major category averages above 4 stars, so high ratings are common rather than rare on Amazon.