We tracked these products daily from August 19 to August 25, 2026, to see how prices, discounts, and stock levels actually move week to week.
What you’ll learn:
- How much headphone prices swing across major brands on Amazon
- Which brands discount most often, and by how much
- Which listings showed pricing patterns that suggest possible MAP violations
- How stock availability varies by brand, including Amazon Renewed products
- What this data means if you’re pricing or selling headphones on Amazon
Here’s what the data shows.
- Bose prices stayed the highest and moved the most. The average Bose price ranged from $220 to $250 during the week, a $30 swing. No other brand came close to that range.
- Soundcore discounted the most often. Anker’s Soundcore products carried an average discount of 34%, the highest of any brand we tracked. Bose discounted the least, at just 10%.
- JBL showed up most often in pricing anomalies. We flagged listings priced more than 10% below their own weekly average as potential MAP violations. JBL had more of these flags than any other brand, tied to the widest range of third-party sellers.
- Stock stayed steady for most brands. Only Amazon Renewed Bose and Amazon Renewed Anker products showed meaningful out-of-stock rates, both above 10%.
The rest of this report breaks down what drove these patterns, brand by brand.
How We Gathered This Data
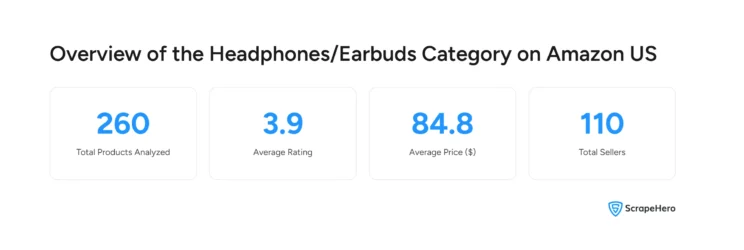
We tracked 260 headphone and earbud products on Amazon US across five brands: Sony, Bose, JBL, Anker (Soundcore), and Beats. The list also includes Amazon Renewed listings for each brand, tracked separately from new units.
We used ScrapeHero Cloud’s Amazon Search Results Scraper to pull this data. Amazon actively works to block automated data collection, through CAPTCHAs, shifting page layouts, and bot detection, which makes reliable Amazon scraping harder than it looks.
We scraped the same 260 products once a day for seven days, from August 19 to August 25, 2026. Using the same fixed list every day, rather than a new sample, let us track how individual prices moved over the week instead of comparing unrelated snapshots.
For each product, we recorded:
- Price, discount percentage, and any active coupon or deal
- Best Seller Rank, review count, and average rating
- In-stock or out-of-stock status
- Competing offer prices from other sellers on the same listing
How Do Headphone Prices Compare Across Brands on Amazon?
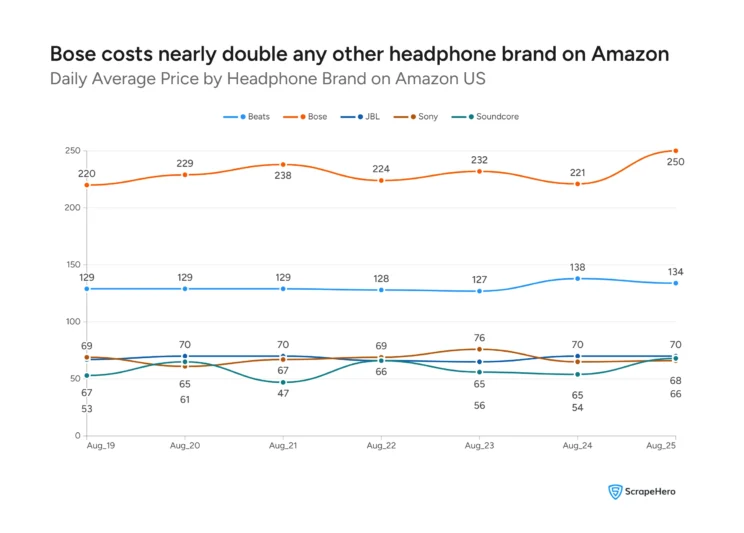
Bose costs far more than every other brand we tracked, and Amazon Renewed pricing follows a different pattern from new units. Prices ranged from $8 for a budget Sony earbud to $399 for a premium Bose headphone.
Bose averaged $220 to $250 across the week. That’s roughly double the next closest brand, Beats, which held steady around $127 to $138.
JBL, Sony, and Soundcore sat closer together, mostly in the $50 to $90 range. These three brands converged even tighter by the end of the week, landing within $2 of each other on August 25.
Amazon Renewed prices don’t track new unit prices directly. Bose Renewed averaged $135 to $181, well below new Bose units, but still the most expensive Renewed line by a wide margin. Anker Renewed sat at the opposite end, averaging $24 to $36.
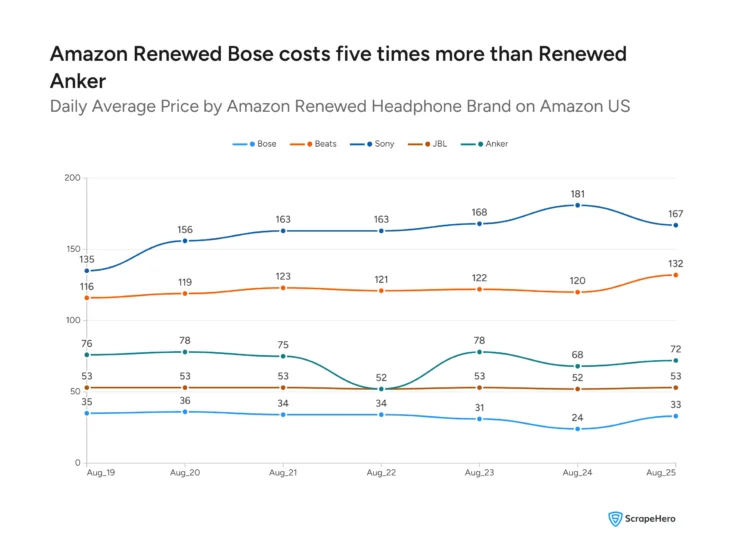
We kept Renewed and new-unit pricing separate throughout this report. Renewed products come from a different supply chain, with pricing shaped by used-unit condition and refurbishment costs rather than the same market forces as new inventory.
Which Headphone Brands Have the Highest Price Volatility?
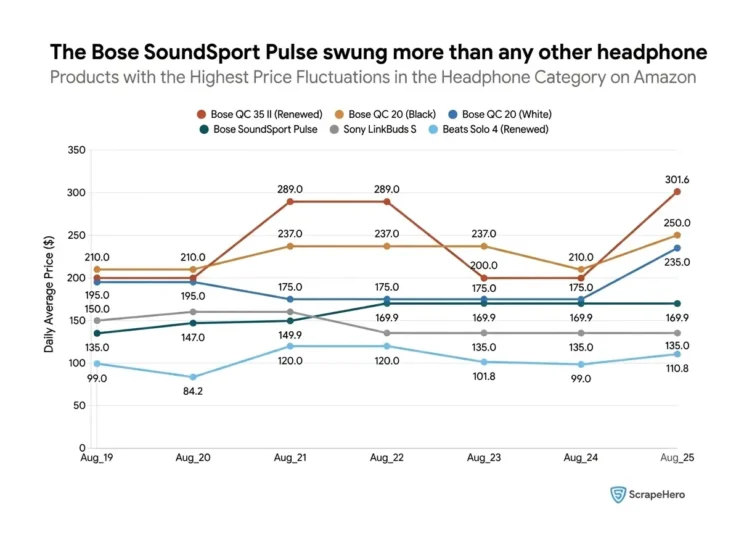
Individual products moved far more than brand averages suggest. Some listings swung by over $100 during the week, even when their brand’s overall average price stayed relatively steady.
The Bose SoundSport Pulse moved the most of any product we tracked. Its price swung between roughly $84 and $145 across the week, a pattern with no clear direction.
Other notable movers:
- Bose QuietComfort 35 (Series II) climbed steadily from $140 to $150, with no drops.
- Bose QuietComfort Earbuds (White) rose from $157 to $179, also without a single decrease.
- JBL Endurance Race 2 held flat at $54 for most of the week, then jumped to $69.80 on the last day.
- Beats Powerbeats Pro 2 (Renewed) swung repeatedly, from $144 to $118.60 to $146 to $118, with no settled trend.
- JBL Tune Flex 2 and Sony WF-C500 each made one sharp mid-week jump, then held steady for the rest of the week.
These patterns fall into three types: steady climbs with no drops, one sharp jump followed by stability, and repeated swings with no clear direction. The Bose SoundSport Pulse is the only product in our data that fits the third type.
Which Headphone Brands Discount Their Products Most Frequently?
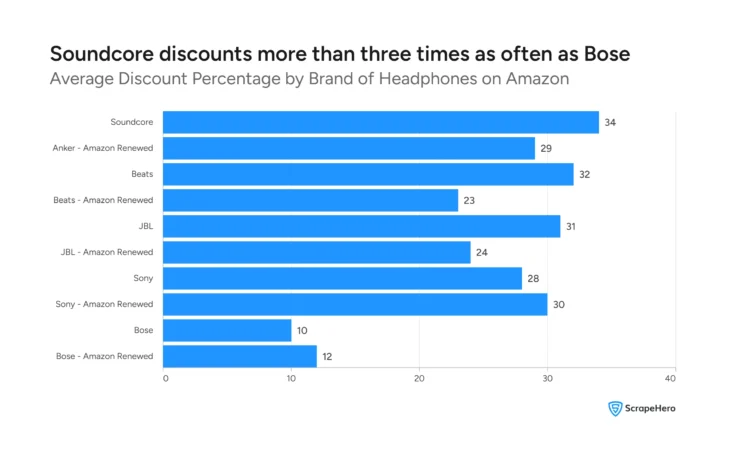
Soundcore (Anker) discounts more often and more deeply than any other brand we tracked. Its products carried an average discount of 34%, and 54% of Soundcore listings were discounted at some point during the week.
Bose sits at the opposite end. It discounted only 10% on average, and just 17% of its listings saw any discount at all, the lowest of any brand.
Discount frequency and discount depth don’t always move together. JBL discounted 31% on average and showed up on 3.29 discounted products per day, the second-highest frequency we tracked. Beats discounted a similar amount, at 32%, but far less often, averaging only 1.29 discounted products per day.
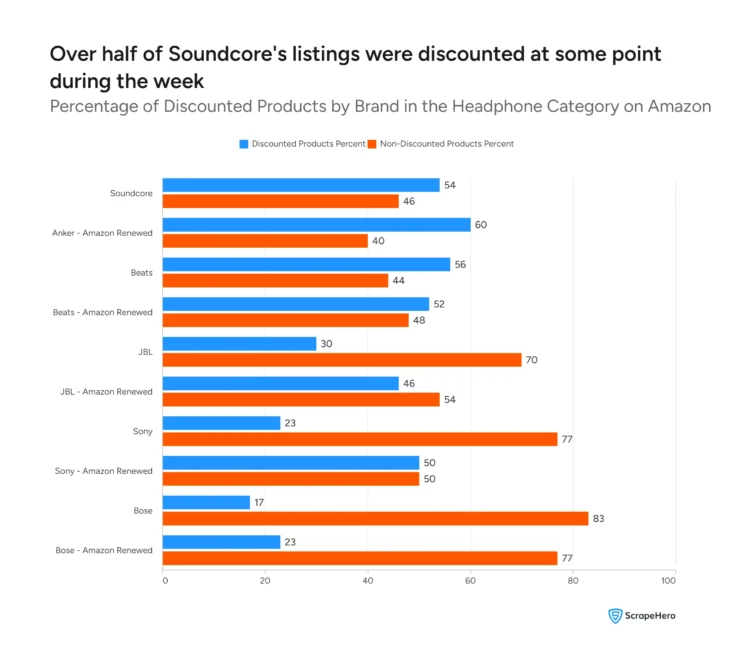
Amazon Renewed listings discount differently from new units. Anker Renewed had the highest share of discounted products of any brand or category in our data, at 60%. Bose Renewed, by contrast, discounted only 23% of its listings, close to new Bose’s already-low rate.
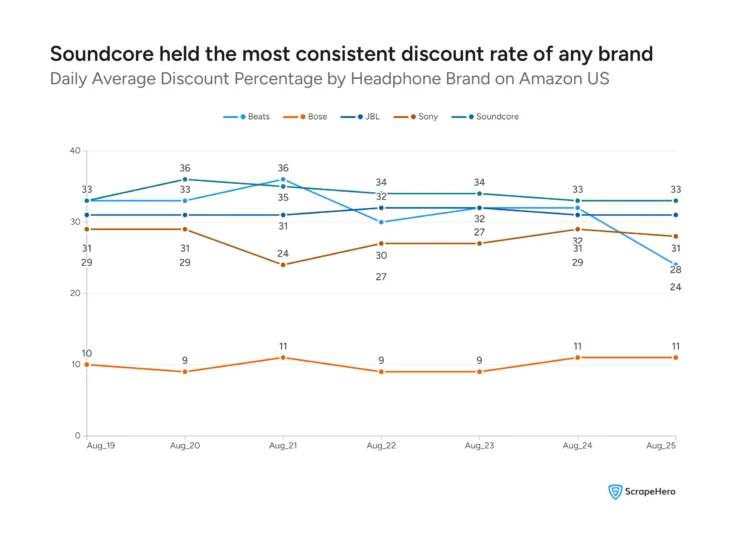
Discounts also move differently day to day. Soundcore stayed in the 32% to 36% range all week, the most consistent of any brand. Beats swung the most, climbing to 35% on August 21 before dropping to 24% by August 25. Bose stayed flat and low throughout, never rising above 11%.
Amazon Renewed Anker followed a similar climbing pattern in daily discounts, rising from 24% to 31% through the week. Renewed Bose stayed just as flat and low as new Bose, ranging only from 7% to 16%.
Availability and Stock Patterns
Most headphone brands kept their products in stock throughout the week, with two clear exceptions: Amazon Renewed Bose and Amazon Renewed Anker.
Stock levels by brand:
- Beats and Sony Renewed: 100% in stock all week, no out-of-stock products
- Sony: 99% in stock
- JBL and Soundcore: 95% in stock
- Beats Renewed: 95% in stock
- JBL Renewed: 93% in stock
- Bose: 91% in stock
- Anker Renewed: 88% in stock, the second-highest out-of-stock rate
- Bose Renewed: 77% in stock, the lowest of any brand or category we tracked, with 23% of its listings out of stock at some point during the week
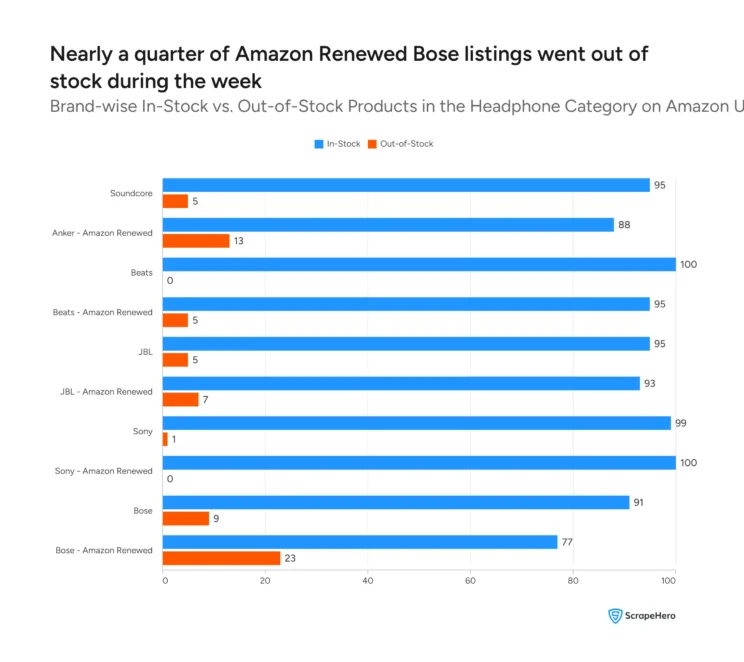
Every brand except Bose Renewed and Anker Renewed stayed above 90% in stock. The gap for these two Renewed lines is large enough to matter: nearly a quarter of Bose Renewed listings went out of stock during the week, compared to less than 10% for every new-unit brand.
How Can Amazon Headphone Price Volatility Be Analyzed?
The clearest way to measure price volatility is to track the same products daily over time, and to look at competing offers on each listing, not just the price Amazon shows by default. Both angles surfaced patterns a single snapshot would have missed.
Tracking a fixed panel of products shows movement a one-time check can’t. We used the same 260 products every day for seven days. This is what let us see, for example, that the Bose SoundSport Pulse swung between $84 and $145 during the week, a pattern invisible if we had only checked its price once.
Looking at competing offers on the same listing reveals how much price variation exists behind the scenes. Every listing on Amazon can carry multiple sellers, each with their own price. We averaged these competing offers by brand across the week:
- Bose had the widest spread between its lowest and highest offer: $137, ranging from $91 to $228
- JBL Renewed had the narrowest spread: $23, ranging from $26 to $49
- JBL and JBL Renewed had the most competing sellers per listing, averaging 6.9 and 7.0 offers
- Anker Renewed had the fewest competing sellers, averaging 4.0 offers per listing
Per-Offer Price by Headphone Brand
| Brand | Avg. No. of Offers Per Listing | Avg. Lowest Offer | Avg. Highest Offer | Avg. Price Spread |
|---|---|---|---|---|
| Beats- Amazon Renewed | 7 | 60 | 123 | 63 |
| Beats | 5.1 | 41 | 95 | 55 |
| Bose | 6.1 | 91 | 228 | 137 |
| Bose- Amazon Renewed | 6.1 | 42 | 144 | 102 |
| JBL | 6.9 | 31 | 64 | 33 |
| JBL- Amazon Renewed | 7.0 | 26 | 49 | 23 |
| Sony | 6.4 | 39 | 69 | 30 |
| Sony- Amazon Renewed | 6.1 | 32 | 52 | 21 |
| Soundcore | 5.4 | 18 | 52 | 34 |
| Anker- Amazon Renewed | 4.0 | 17 | 32 | 15 |
A wide price spread across sellers means more room for one listing to look like an outlier. When six or seven sellers compete on the same product, as with JBL, the gap between the cheapest and priciest offer creates more opportunities for a single seller’s price to fall well below the rest. That’s part of what the MAP violation analysis later in this report is built to catch.
Pricing Anomalies: Products Flagged Below Market Norms
We found 64 instances across our data where a listing’s price dropped more than 10% below that product’s own weekly average. We flagged these as potential MAP (Minimum Advertised Price) violations.
What “potential MAP violation” means here: a listing priced more than 10% below its own average price during the analysis week. This is a data pattern, not a confirmed policy breach. We have no way to verify a seller’s actual advertised-price agreement with a brand from public listing data alone.
Key patterns in the flagged listings:
- Most flags appeared on August 19, the first day of tracking, and the fewest on August 22
- Most flagged prices fell 10% to 20% below the product’s weekly average; drops beyond 20% were less common
- Lonestar Mobile was the most frequent seller flagged, appearing across multiple products on nearly every day of the week
- Amazon.com was also flagged repeatedly, mostly on JBL Endurance and JBL Tune series products
- Amazon Renewed products (Beats, Bose, and Sony) made up a large share of all flagged listings
- JBL was the brand most often flagged overall, with more flagged listings than any other single brand, and its flagged listings were tied to the widest range of different sellers
JBL’s high number of distinct flagged sellers lines up with what we found earlier in this report. JBL and JBL Renewed averaged the most competing offers per listing of any brand, 6.9 and 7.0. More sellers competing on the same listing means more chances for one of them to price well below the norm.
What Does Amazon Data Reveal About the Headphone Market?
No single brand ranks best across every measure we tracked. Each brand shows a different mix of discount behavior, pricing anomalies, and consistency, summarized in the table below.
| Brand | Avg. Discount Depth | Discount Frequency (product/day) | MAP Violation Count |
|---|---|---|---|
| Sony | 28 | 2.71 | 11 |
| JBL | 31 | 3.29 | 21 |
| Anker | 34 | 4.00 | 0 |
| Beats | 32 | 1.29 | 1 |
| Bose | 10 | 0.57 | 4 |
| Sony Renewed | 30 | 1.57 | 2 |
| JBL Renewed | 24 | 2.43 | 5 |
| Anker Renewed | 29 | 1.71 | 0 |
| Beats Renewed | 23 | 2.19 | 9 |
| Bose Renewed | 12 | 0.43 | 1 |
Discount frequency is the average number of discounted products per day for that brand.
A few things stand out when you read the table across, not just down one column:
- Anker discounts the most and shows the cleanest pricing. It has the highest discount depth and frequency of any brand, and zero MAP violations, new or Renewed.
- JBL discounts moderately but carries the most pricing anomalies. Its discount depth and frequency sit in the middle of the pack, but it has more than triple the MAP violation count of any other brand.
- Bose barely discounts at all, new or Renewed. Both its discount depth and frequency are the lowest in the table, consistent with what we found earlier: Bose changes price mainly through individual listing swings, not brand-wide promotions.
- Beats Renewed stands out from new Beats. New Beats has almost no MAP violations, just 1, while Beats Renewed has 9, the second-highest count in the table.
What This Means If You’re Pricing or Selling Headphones on Amazon
If you sell headphones on Amazon, this data points to three practical takeaways.
- Watch your own listings for seller undercutting, not just competitor pricing. JBL’s high MAP violation count came alongside its high number of competing sellers per listing. More sellers on your listing means more chances for one to price below your intended floor.
Price and MAP monitoring services can track this automatically across your full catalog.
- A consistent discount rate can work as a deliberate strategy. Anker held a steady 32% to 36% discount range all week with zero flagged pricing anomalies. Predictable discounting and clean pricing aren’t mutually exclusive.
- Renewed and new-unit pricing need separate tracking. Several brands showed real gaps between their new and Renewed performance, including Beats, where Renewed had nine times the MAP violation count of new units. A pricing strategy built only around new-unit data would miss this.
A one-week snapshot shows a pattern. Continuous tracking is what lets you act on it. Building and maintaining a scraper that runs daily, handles site changes, and delivers clean data on schedule takes real engineering time.
ScrapeHero’s managed web scraping service handles this for you, so you get the data without the upkeep. If you want this kind of price and competitor tracking running for your own products, talk to ScrapeHero about setting it up.
Frequently Asked Questions
Our data shows two distinct patterns: steady, brand-wide discount campaigns that hold a consistent range over time, and sharp, one-off price swings tied to individual sellers competing on the same listing.
Sony had the most products in the lowest price range we tracked, from $8 to $13, all in-ear models.
Anker (Soundcore) had the lowest average price of the new-unit brands we tracked, alongside Sony and JBL, all in the $50 to $90 range.
Track the same set of products daily over time, rather than checking prices once. This is how we identified individual price swings, like the Bose SoundSport Pulse, that a single snapshot would have missed.
A scraper that pulls the same product listings on a set schedule, daily or otherwise, is the most direct way. ScrapeHero Cloud’s Amazon Search Results Scraper is what we used to gather the data in this report.