With the boom in the number of online buyers and the simultaneous influx of reviews, understanding user experience is becoming an increasingly challenging task. Reviews talk volumes about a product, the seller and local partners. However, scraping such a myriad of customer feedback can be a tricky task. This tutorial helps you understand better ways of retrieving and structuring reviews of products to draw powerful insights.
For our use case here, we will be using reviews of Amazon Echo.
Let’s get started
Before we get started with the program, let’s make sure we have all the necessary tools and libraries.
The program below is written for Python 3. Install Python3 and PIP by following this guide.
Install the required libraries using the command below:
pip3 install pandas nltk gensim pyLdavis
Load the libraries
We are going to need quite a few libraries. Let’s load them.
import re # We clean text using regex
import csv # To read the csv
from collections import defaultdict # For accumlating values
from nltk.corpus import stopwords # To remove stopwords
from gensim import corpora # To create corpus and dictionary for the LDA model
from gensim.models import LdaModel # To use the LDA model
import pyLDAvis.gensim # To visualise LDA model effectively
import pandas as pd
If you are using NLTK stopwords for the first time, you might have to download it first.
import nltk
nltk.download('stopwords')
Loading Amazon Echo Review Data
Here is a sample dataset for Amazon Echo reviews.
This is how your sample data would look:

fileContents = defaultdict(list)
with open('reviews_sample.csv', 'r') as f:
    reader = csv.DictReader(f)
    for row in reader: # read a row as {column1: value1, column2: value2,...}
        for (k,v) in row.items(): # go over each column name and value
            fileContents[k].append(v) # append the value into the appropriate list
Extract just reviews to a list using
reviews = fileContents['review_body']
Cleaning Up The Data
Punctuation
Let’s remove all punctuations
reviews = [re.sub(r'[^\w\s]','',str(item)) for item in reviews]
Stop-words
The reviews we have contains a lot of words that aren’t really necessary for our study. These are called stopwords. We will remove them from our text while converting our reviews to tokens.
We use the NLTK stopwords.
stopwords = set(stopwords.words('english'))
Let’s remove those stopwords while converting the reviews list to a list of reviews which are split into words that matter. The list would look like this: [[word 1 of review1, word2 of review1…],[word1 of review 2, word2 of review2..],…].
texts = [[word for word in document.lower().split() if word not in stopwords] for document in reviews]
Taking out the less frequent words
One of the easiest markers of how important a certain word is in a text (stopwords are exceptions) is how many times it has occurred. If it has occurred just once, then it must be rather irrelevant in the context of topic modeling. Let’s remove those words out.
frequency = defaultdict(int)
for text in texts:
    for token in text:
         frequency[token] += 1

texts = [[token for token in text if frequency[token] > 1] for text in texts]
Read More – Analyzing top shoe brands in Amazon
Begin processing
Turning our text to dictionary
A dictionary in the context of machine learning is a mapping between words and their integer ids. We know that a machine can’t understand words and documents as they are. So we split and vectorize them. As well written here,
In this representation, each document is represented by one vector where each vector element represents a question-answer pair, in the style of:
It is advantageous to represent the questions only by their (integer) ids. The mapping between the questions and ids is called a dictionary. You can refer this link to know more
dictionary = corpora.Dictionary(texts)
If you try printing the dictionary, you can see the number of unique tokens in the same.
print(dictionary)
Dictionary(13320 unique tokens: ['warmth', 'exclusively', 'orchestral', 'techy', 'formal']...)
This also means that each document will now be represented by a 28054-D vector. To actually convert tokenized documents to vectors,
corpus = [dictionary.doc2bow(text) for text in texts]
doc2bow counts the number of occurrences of each distinct word, converts the word to its integer word id and returns the result as a sparse vector. So it would have lists of tuples which goes [(word id no, occurred this many times), … ]
So if corpus reads [(0,1),(1,4)] it means Word with ID no ‘0’ occurred one time and word with id number ‘1’ occurred 4 times in the document. Now that we have our reviews in a language the machine could understand, let’s get to finding topics in them.
Read More – Learn to build an Amazon Review Scraper
What is an LDA Model?
Topic modeling is a type of statistical modeling for discovering the abstract “topics” that occur in a collection of documents. LDA expands to Latent Dirichlet Allocation (LDA) is an example of a model which is used to classify text in a document to a particular topic. It builds a topic per document model and words per topic model, modeled as Dirichlet distributions.
Note:
For the sake of this tutorial, we will be using the gensim version of LDA model. The kind of model we use for topic modeling largely depends on our type of data. LDA model is only used for the purpose of this tutorial. For more accurate results, use a topic model trained for small documents.
Let’s go with nine topics for now. The number of topics you give is largely a guess/arbitrary. The model assumes the document contains that many topics. You may use Coherence model to find an optimum number of topics.
NUM_TOPICS = 9 # This is an assumption.
ldamodel = LdaModel(corpus, num_topics = NUM_TOPICS, id2word=dictionary, passes=15)#This might take some time.
There you go, you have your model built! Explaining the algorithm behind LDA is beyond the scope of this tutorial. This has a good explanation of the same.
Insights
Extracting Topics from your model
Let’s see the topics. Note that you might not receive the exact result as shown here. The objective function for LDA is non-convex, making it a multimodal problem. In layman’s terms, LDA topic modeling won’t give you one single best solution, it’s an optimization problem. It gives locally optimal solutions; you cannot expect that any given run would outperform some other run from different starting points. To know more, check out this discussion on Stack Exchange.
topics = ldamodel.show_topics()
for topic in topics:
    print(topic)
(0, '0.229*"love" + 0.049*"alexa" + 0.040*"gift" + 0.027*"loves" + 0.026*"christmas" + 0.023*"family" + 0.023*"bought" + 0.023*"awesome" + 0.017*"best" + 0.016*"absolutely"')
(1, '0.017*"amazon" + 0.017*"app" + 0.012*"device" + 0.010*"alexa" + 0.010*"work" + 0.010*"wifi" + 0.009*"phone" + 0.008*"time" + 0.008*"set" + 0.008*"get"')
(2, '0.037*"home" + 0.034*"smart" + 0.029*"lights" + 0.028*"music" + 0.025*"turn" + 0.021*"control" + 0.021*"amazon" + 0.020*"alexa" + 0.016*"devices" + 0.014*"use"')
(3, '0.042*"music" + 0.033*"alexa" + 0.022*"weather" + 0.020*"play" + 0.020*"questions" + 0.020*"use" + 0.018*"ask" + 0.015*"things" + 0.012*"list" + 0.012*"news"')
(4, '0.035*"like" + 0.031*"alexa" + 0.029*"dont" + 0.022*"doesnt" + 0.020*"would" + 0.019*"know" + 0.017*"say" + 0.015*"get" + 0.015*"cant" + 0.014*"really"')
(5, '0.091*"one" + 0.020*"bought" + 0.017*"got" + 0.016*"im" + 0.015*"another" + 0.014*"buy" + 0.013*"get" + 0.013*"day" + 0.012*"first" + 0.012*"would"')
(6, '0.155*"echo" + 0.145*"dot" + 0.039*"love" + 0.024*"room" + 0.019*"bedroom" + 0.018*"dots" + 0.016*"house" + 0.015*"use" + 0.013*"music" + 0.012*"great"')
(7, '0.061*"speaker" + 0.039*"sound" + 0.031*"good" + 0.027*"bluetooth" + 0.021*"better" + 0.020*"speakers" + 0.020*"quality" + 0.018*"echo" + 0.016*"great" + 0.015*"small"')
(8, '0.145*"great" + 0.068*"works" + 0.062*"product" + 0.054*"easy" + 0.052*"fun" + 0.041*"use" + 0.026*"set" + 0.023*"device" + 0.022*"little" + 0.020*"well"')
word_dict = {};
for i in range(NUM_TOPICS):
    words = ldamodel.show_topic(i, topn = 20)
    word_dict['Topic # ' + '{:02d}'.format(i+1)] = [i[0] for i in words]
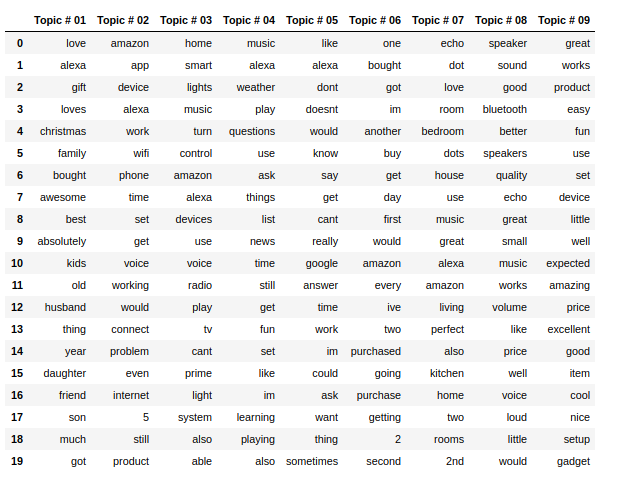
pd.DataFrame(word_dict)
You get,

Observing the words, we could make the below initial insights. Tweaking number of passes and topics might yield better topics and results.
Topic 1 – Alexa makes a great Christmas gift among families. Kids and adults like it alike.
Topic 2 – There is some noise around wifi connectivity, likely negative since ‘problem’ is one of the top 8 contributors to the topic.
Topic 3 – Users are talking about how Amazon echo interacts with elements at home like music, radio, lights etc turning homes into a smart home.
Topic 4 – Amazon Echo reviewed on everyday tasks like playing music or telling about the weather, news etc. Some discussion on Bluetooth connectivity too
Topic 5 – Amazon Echo when compared with Google Home cannot answer a lot of questions.
Topic 6 – Amazon Echo is recommended, positive reviews.
Topic 7 – Users are talking about their experience with the Echo in their bedrooms and living rooms, likely positive.
Topic 8 – Reviews on speaker sound quality and Bluetooth connectivity.
Topic 9 – In spite of the price, Echo is recommended. General positive reviews.
Visualization using PyLDAvis
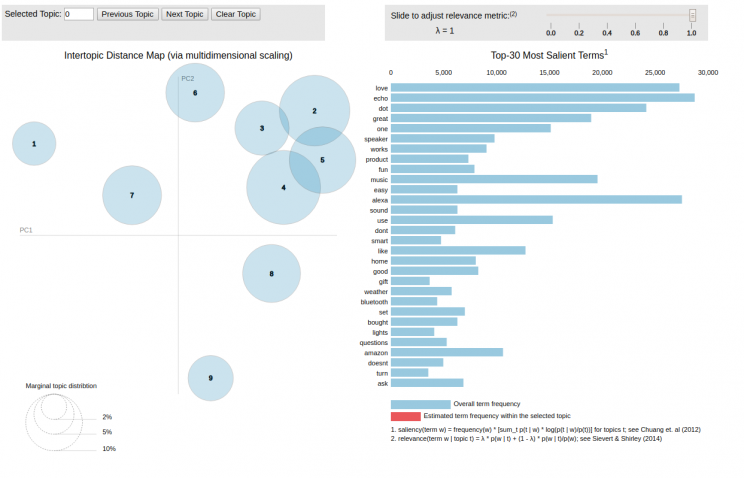
PyLDAvis is designed to help users interpret the topics in a topic model that has been fit to a corpus of text data, by showing them visually. Let’s see ours.
lda_display = pyLDAvis.gensim.prepare(ldamodel, corpus, dictionary, sort_topics=False)
pyLDAvis.display(lda_display)
Which gives us, the below visualization.
To interact with the result, click here. This will helps us infer even more from our data.
Some insights from topic modeling are:
- We observe that Topics 4 and 5 have some reviews in common. Reviews that talk about how Amazon Echo involves in everyday tasks seem to frequently compare Echo with Google Home.
- A small interaction between Topics 2 and 5 indicate Echo was compared with Google Home on issues with Wi-Fi connectivity too.
- The interaction between Topics 2 and 3 supports that few of the top problems that customers complain and compare on are Wi-Fi connectivity, answering simple questions and helping users in everyday tasks.
- ‘Good’ is the third biggest contributor to Topic 8. This shows that speaker sound quality is a strong point and could be used as a positive point in advertising.
- Topic 1 suggests that the Echo makes great gifts, especially during the Christmas season. Increased attention to advertising with this perspective is suggested during the Christmas season.
You can get better keywords if you perform stemming or lemmatizing on your text. Tweak your number of topics and passes to see what gives you the best results to study from. You can also try using Coherence model to compute the optimum model, though this might give you very generic topics.
We can help with your data or automation needs
Turn the Internet into meaningful, structured and usable data
Disclaimer: Any code provided in our tutorials is for illustration and learning purposes only. We are not responsible for how it is used and assume no liability for any detrimental usage of the source code. The mere presence of this code on our site does not imply that we encourage scraping or scrape the websites referenced in the code and accompanying tutorial. The tutorials only help illustrate the technique of programming web scrapers for popular internet websites. We are not obligated to provide any support for the code, however, if you add your questions in the comments section, we may periodically address them.


