
In the dynamic world of real estate, the importance of robust data analysis cannot be overstated. Redfin data analysis stands at the forefront of this revolution. But how do you analyze real estate data?
Platforms like Redfin contain extensive real estate data like listings, sale prices, days on the market, property features, demographic information, etc. This data can be extracted with the help of a reliable web scraping service, organized into meaningful categories, and then examined to gain insights into the real estate dynamics of a place.
This blog delves into the intricacies of Redfin real estate listing analysis, highlighting how it serves as a tool for those navigating the housing market. With this knowledge, you can make informed decisions, stay ahead of market trends, and use data to your strategic advantage.
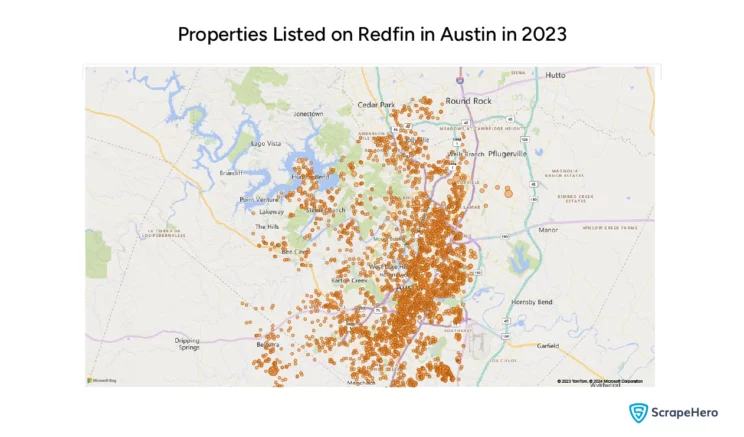
The data for this analysis was sourced using the Redfin Scraper from ScrapeHero Cloud. In the upcoming sections, we will delve into the findings obtained from our comprehensive examination of more than 5,346 properties listed on Redfin in Austin.

Understanding the Market Dynamics and Trends in Austin with Redfin Data Analysis
Understanding market dynamics and trends is crucial in real estate. It enables you to anticipate changes and make data-driven decisions. By analyzing trends provided by Redfin housing market data, it is possible to identify the opportune moments for buying or selling. Here is what the housing market data analysis of the data gathered from Redfin revealed:
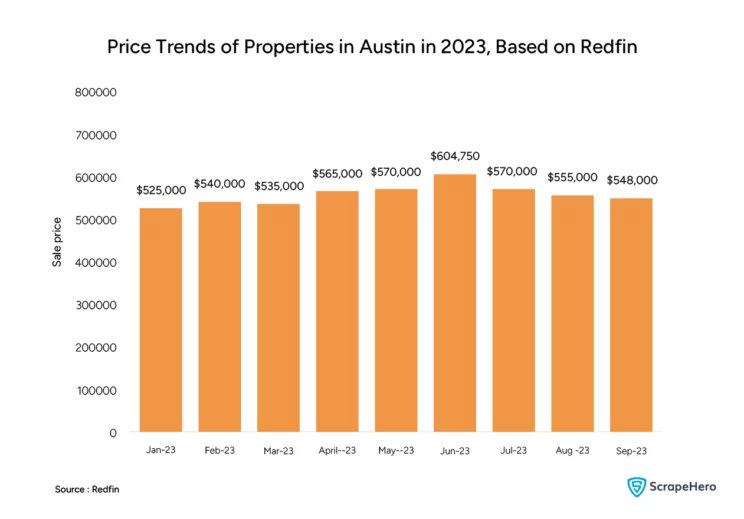
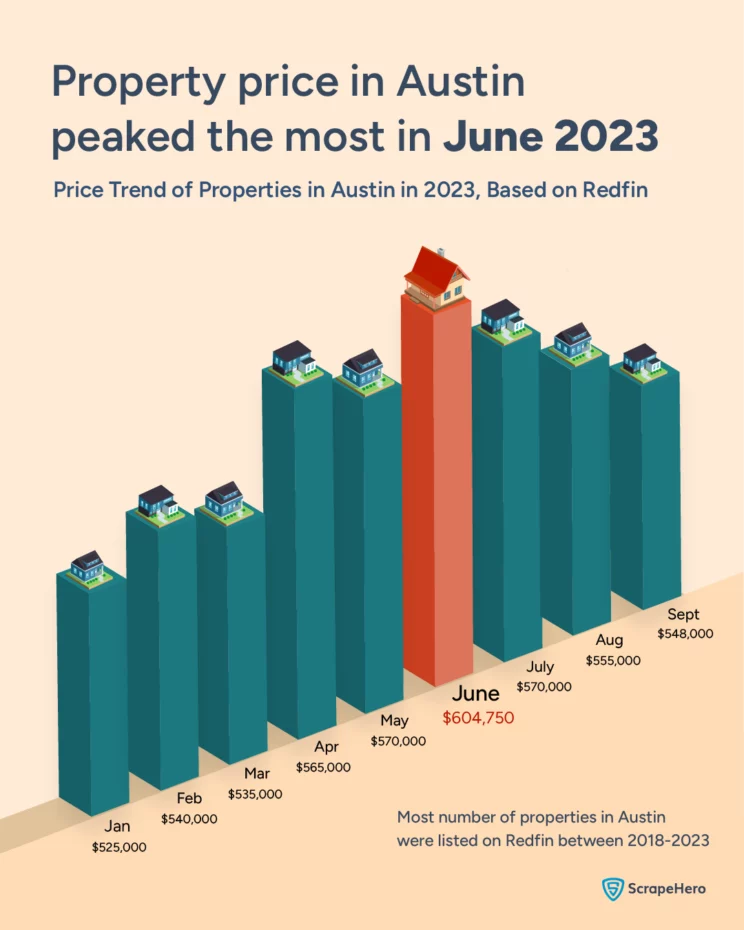
According to the Redfin housing data we gathered, the real estate trend in Austin in 2023 shows an uneven flow of home prices from January to September. There is a significant peak in prices around June 2023, which suggests a seasonal upswing. This could be due to increased buying activity during the summer months, a trend often observed in real estate markets.
The sharp increase followed by a steep decline indicates a volatile market within this period. The peak in June, reaching approximately 604,750 USD, followed by a drop to around 570,000 USD in July, suggests a sudden market adjustment that could be attributed to various economic factors, such as interest rate changes, inventory shifts, or economic policy impacts.
Despite the volatility, the overall trend from January to September of Redfin housing market data analysis shows a downward trajectory in home prices.
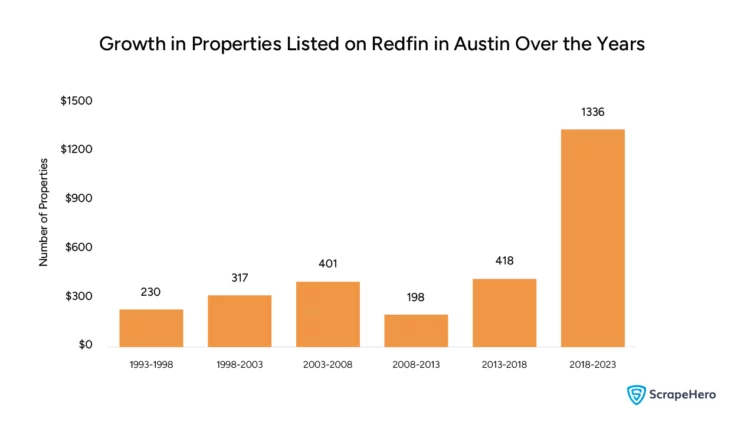
Redfin real estate listing analysis of the properties in Austin from 1993 to 2023 shows a significant growth in the inventory over this 30-year span. Notably, there’s an exponential increase in property counts in the last five-year block, from 2018-2023, with the numbers soaring to 1336 listings. This uptick reflects a robust expansion of the Austin real estate market, likely driven by the city’s increasing popularity and economic growth.
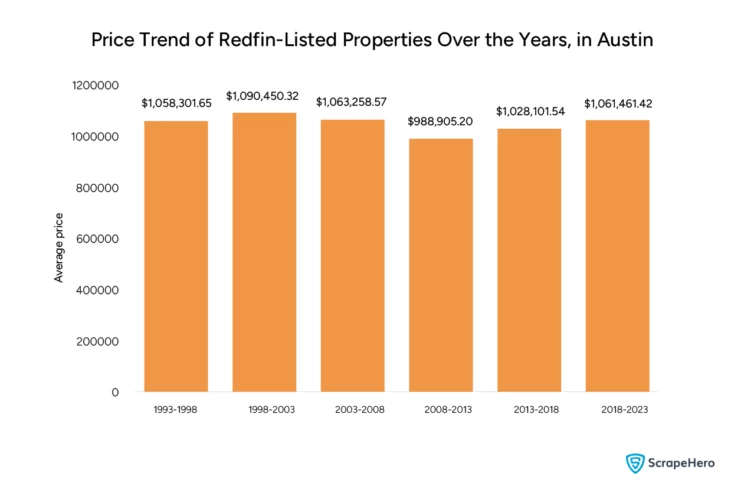
Housing market data analysis of Redfin-listed properties over the years 1993 to 2023 reveals that there is a fluctuation in the average price of properties built in different five-year periods. Starting from a high in the 1993-1998 period, there’s a noticeable decline, reaching its lowest in the 2008-2013 period, followed by a recovery in subsequent years.
The recovery in prices for properties built during the 2013-2018 period to those similar in the 1998-2003 period indicates resilience in the housing market, possibly reflecting economic recovery or a shift in the demand for newer properties. This answers the common query of whether or not home prices are dropping in Austin, Texas.
By utilizing a Redfin Scraper to scrape data from Redfin, realtors can access a lot of information that is crucial for understanding market dynamics and trends.

Property Types and Valuation With Redfin Data Analysis
Each property type, from sprawling suburban homes to sleek urban condos, carries its own set of valuation metrics influenced by factors like location, amenities, and market demand. By employing Redfin housing data analysis, you can observe these subtle yet critical differences, allowing for more precise property evaluations.
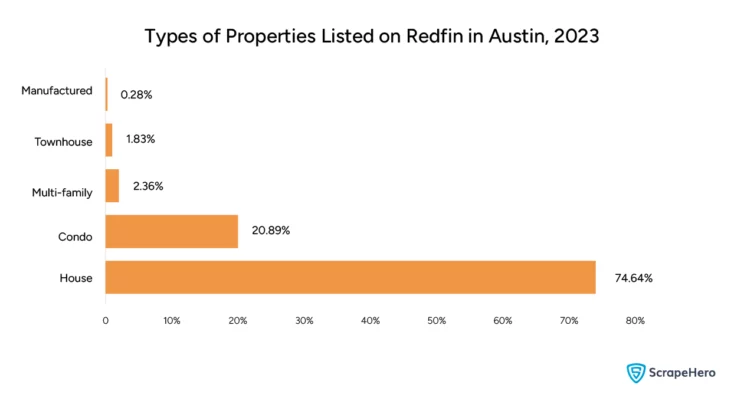
Housing market data analysis of Redfin-listed properties in Austin in 2023 shows a dominant preference for houses, which constitute 74.64% of listings. This prevalence suggests that detached, single-family homes are the primary choice for homeowners or investors in the region. Condos, multi-family units, townhouses, and manufactured homes share the remaining market, with condos being the second most listed property type at 20.89%.
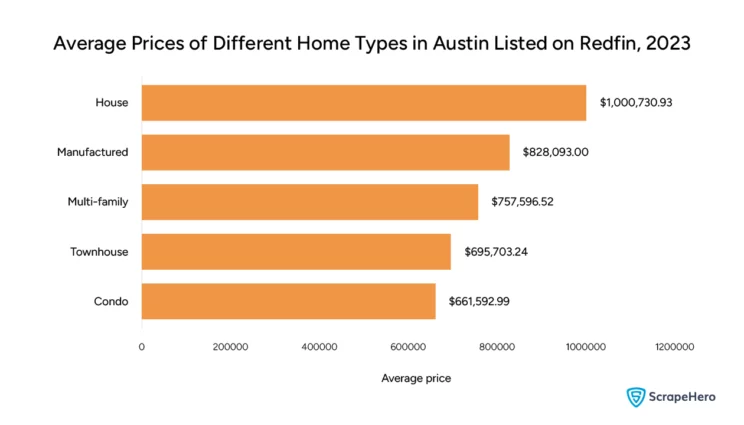
The graph obtained by analyzing the collected data depicts the average prices of home types in Austin. It can be seen that houses are the highest-valued property type, shedding light on Redfin housing market data. Manufactured homes present a more accessible average price point, underlining a diverse range of housing affordability in the city. Multi-family homes and townhouses fall in the mid-range, suggesting a balanced market for different types of buyers.
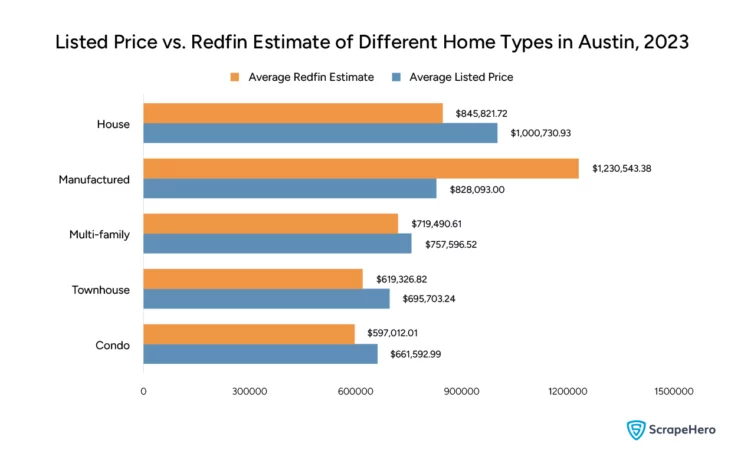
A comparison between the listed price versus the Redfin estimate of real estate listings gives us a quantitative view of market perceptions and pricing strategies. For houses, the average listed price is at a notable high of 1,000,730.93 USD, while the Redfin estimate averages at 845,821.72 USD, indicating a potential seller optimism or a premium placed on features perhaps not fully accounted for in the estimates.
Manufactured homes present the largest gap, with a listed price of 1,230,543.38 USD, far exceeding the average Redfin estimate of 828,093.00 USD, which could signal a variation between market valuation and seller expectations.
In terms of multi-family homes, the listed price of 757,596.52 USD marginally surpasses the Redfin estimate of 719,490.61 USD, suggesting a relatively well-aligned market valuation. Townhouses and condos show a closer alignment between the listed prices and Redfin estimates, at 695,703.24 USD versus 619,326.82 USD and 661,592.99 USD versus 597,012.01 USD, respectively.
Understanding Financial Aspects and Affordability With Redfin Data Analysis
In real estate, there is a correlation between the number of bedrooms in a property and its average price. A likely trend is that the more bedrooms a property has, the higher its average price, as larger homes are usually more expensive.
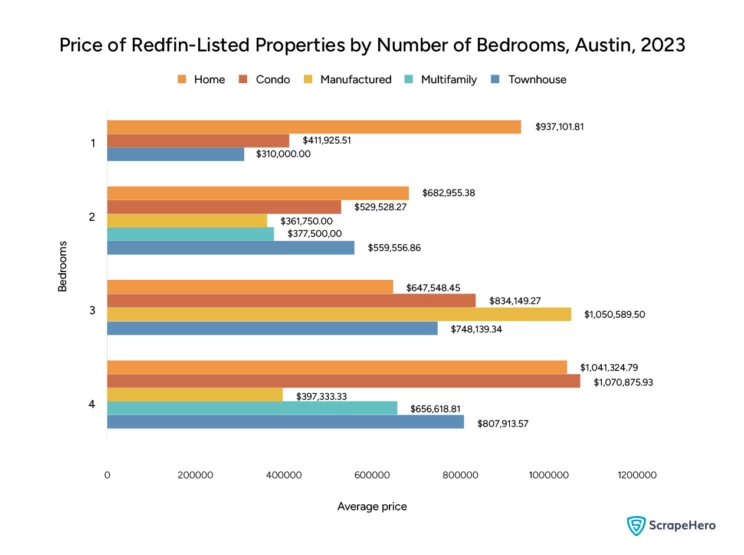
Our analysis of Redfin real estate listings revealed that the average price for homes increases with the number of bedrooms. A 1-bedroom house averages at 411,925.51 USD, while a 4-bedroom house nearly doubles that figure at 1,041,324.79 USD, demonstrating the premium placed on space.
Interestingly, multi-family units with 2 bedrooms are priced higher on average (682,955.38 USD) than 4-bedroom houses, which may reflect their location or additional amenities.
In real estate, the estimated mortgage is the approximate calculation of the monthly payments that a buyer would owe on a mortgage loan used to purchase a property. This estimate is crucial for both buyers and real estate professionals as it helps in determining the affordability of a property and can be obtained by web scraping real estate data on Redfin.
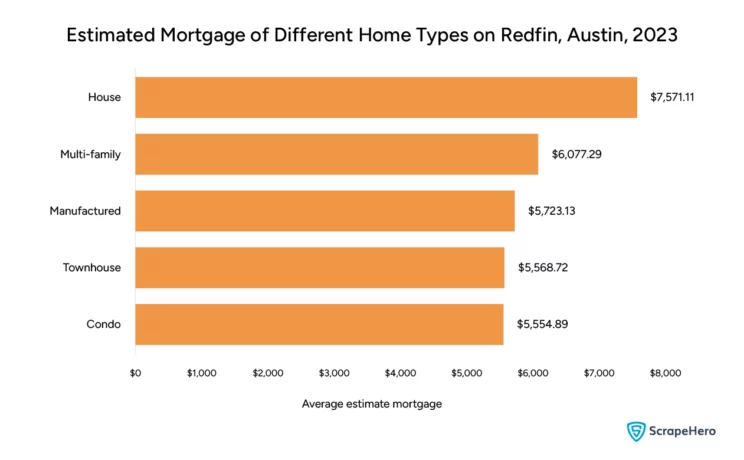
Our analysis of Redfin housing data revealed that houses, typically with higher valuations and larger sizes, have the highest estimated mortgage at 7,571.11 USD. This is seen to be followed by multi-family homes at 6,077.29 USD, indicating the higher investment and monthly costs associated with these property types.
More affordable housing options, such as condos and townhouses, have lower estimated mortgages, 5,554.89 USD and 5,568.72 USD, respectively. This could suggest that these types may be more accessible to a broader range of buyers.
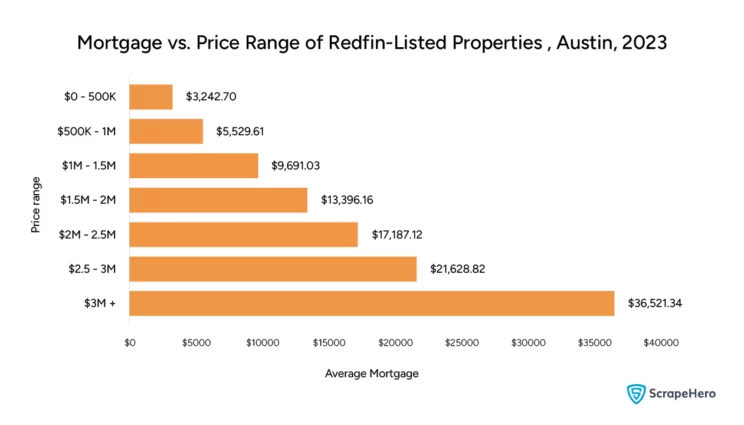
Redfin data analysis showed that the average mortgage for homes within the 0-500K USD range starts at 3,242.70 USD, scaling up to a substantial 36,521.34 USD for homes priced over 3M USD. This highlights the direct correlation between the price of the home and the monthly financial commitment.
Properties within the mid-range prices (1M USD – 1.5M USD) have an average mortgage of 9,691.03 USD, reflecting a significant step up from the lower price ranges.
This indicates that as the price range of properties in Austin increases, so does the financial commitment in terms of mortgage payments, reflecting the direct impact of property valuation on buyer affordability. Web scraping real estate data from Redfin will help analyze trends like this.
Understanding Market Activity and Performance in Austin With Redfin Data Analysis
Web scraping real estate data provides you with data that can be used to make actionable insights, enabling users to understand market trends, evaluate property values, and make informed decisions.
Days on Market
One of the metrics used to gauge the demand for a property and the overall health of any real estate market is Days on Market (DOM). It refers to the number of days a property has been listed for sale on the market until it either goes under contract or is sold.
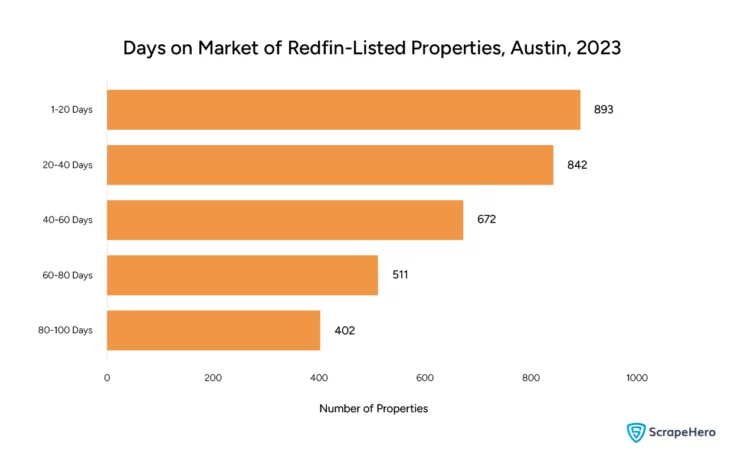
Studying the days on market of Redfin-listed properties in 2023 gave us these findings. The most rapid sales occurred within the first 20 days on the market, with 893 properties being sold.
The number of properties sold decreased as the listing duration increased. This is a typical market behavior; the longer a property is listed, the fewer the number of interested buyers or the more selective the potential buyer pool becomes.
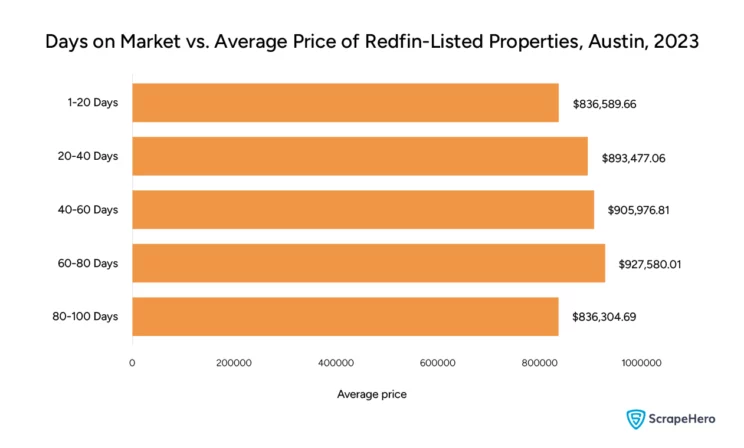
A comparison of days on the market vs. average price shows that properties in Austin listed on Redfin tend to fetch higher prices the longer they stay on the market up to a certain point. Specifically, properties listed for 60-80 days command the highest average price at 927,580.01 USD.
However, it’s important to note that after this period, the average price drops again for properties listed for 80-100 days to 836,304.69 USD, which is almost back to the price point of those listed for just 1-20 days.
This could indicate that while sellers may aim for higher prices with longer listing durations, there is a price adjustment that occurs after a certain period, likely due to market pressures or a reassessment of the property value to facilitate a sale.
Overall, these trends reflect the importance of pricing strategy and market timing. Listings that stay on the market longer may need to adjust their pricing to align with buyer expectations, while those that sell quickly are likely well-priced or benefiting from high demand in Austin’s real estate market.
Sales Activity of Last 6 Months of 2023
To understand the sales activity of different types of properties in Austin in 2023 over the last six months, we analyzed Redfin real estate listings. Houses were the most sold property type, with 4359 sales, indicating strong demand for single-family homes.
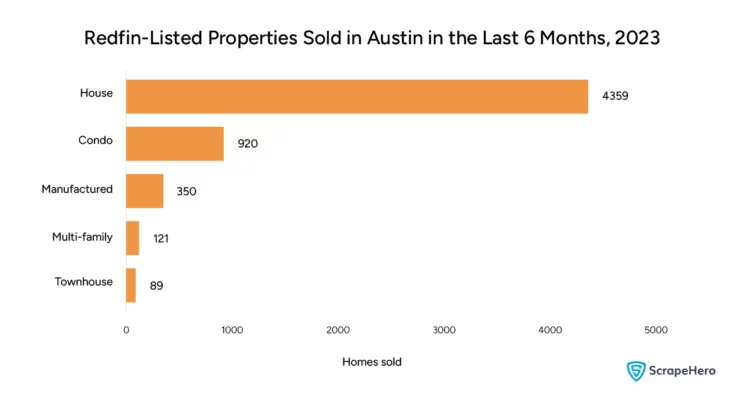
Condos emerged as the second most popular, with 920 sales, showing a significant market for this property type, likely due to affordability or lifestyle preference. Manufactured homes, multi-family units, and townhouses had fewer sales, which could be due to less inventory or lower demand.
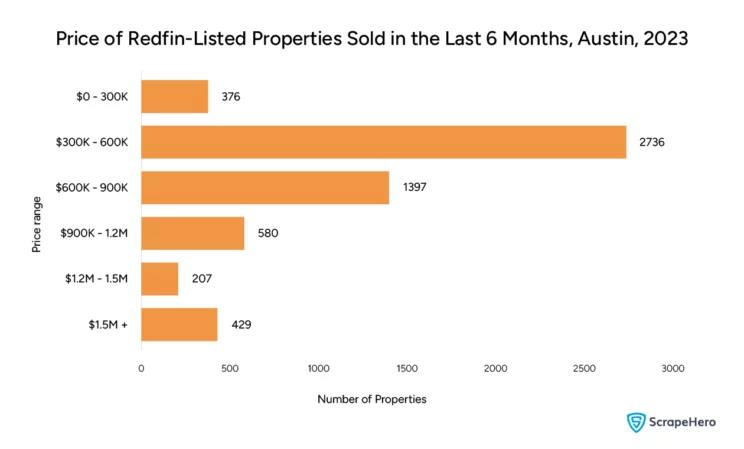
The housing market data analysis of the price of Redfin-listed properties sold in Austin in the last 6 months revealed the following insights. The highest volume of properties sold falls within the 300K USD – 600K USD price range, with 2736 properties sold, suggesting this is the most active market segment.
Sales diminish significantly as property values increase, with the least number of properties sold in the 1.2M USD – 1.5M USD range, indicating a smaller buyer pool for higher-priced properties. There’s a noticeable uptick in sales for properties priced above 1.5M USD, which could reflect a niche demand for luxury properties in Austin.
Redfin real estate listing analysis revealed that the market in Austin is most active in the mid-range price segment, particularly for single-family homes. This aligns with national trends where the majority of homebuyers are looking for affordably priced housing.
The demand for luxury properties, while lower, still exists and may cater to a specific demographic with the means to purchase high-end homes. Condos represent a significant portion of sales, which may appeal to first-time homebuyers, investors, or those seeking lower-maintenance properties.
The data suggests a healthy and diverse property market in Austin, with a range of options available to meet various needs and financial capabilities.
Understanding the Real Estate Landscape of Austin With Redfin Data Analysis
Austin’s real estate landscape presents a unique mix of opportunities and challenges, shaped by its booming economy, cultural richness, and a continuously growing population. By analyzing Redfin housing data, we unraveled the following things about this market.
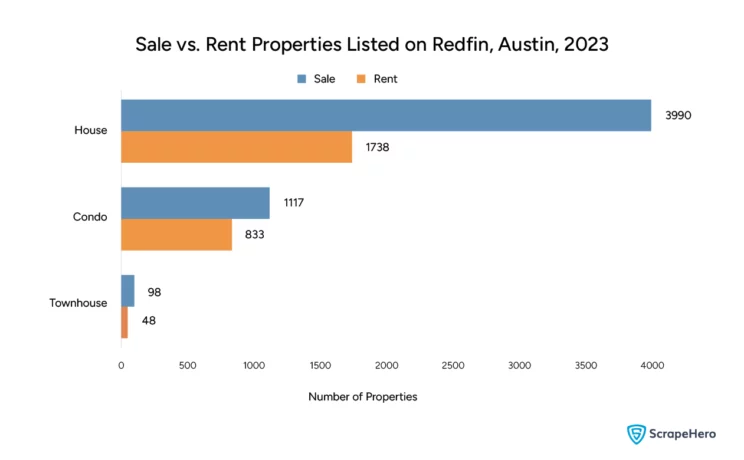
Houses are the most listed property type on Redfin for both sale and rent in Austin, with a significantly higher number for sale (3,990) compared to rent (1,738). This suggests a robust market for purchasing homes and could indicate a preference for home ownership over renting in the Austin area.
Condos are also more commonly listed for sale (1,117) than for rent (833), which may reflect a trend in investment purchases or a demand for more affordable homeownership options compared to houses.
Townhouses have the smallest difference between sale (98) and rent (48) listings, which could indicate a balanced market or less overall demand for this property type compared to houses and condos.
These numbers indicate a strong sales market in Austin, particularly for houses, which could be a result of various factors such as economic growth, migration patterns, or a favorable investment climate.
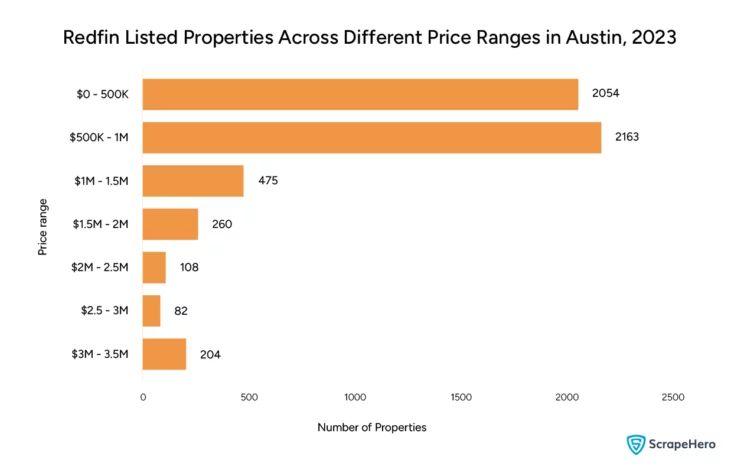
The majority of real estate listings on Redfin are in the 500K USD – 1M USD range, with 2,163 properties, followed closely by the 0- 500K USD range at 2,054 properties. This suggests that the mid-range housing market is the most saturated segment, likely catering to the bulk of homebuyers.
Listings become progressively less frequent as the price range increases, with significant drop-offs as prices move from the 1M USD – 1.5M USD range (475 listings) to the 3M USD+ range (204 listings). The 1.5M USD – 2M USD range has 260 listings, which then decreases further in the higher price categories, with only 82 listings in the 2.5M USD – 3M USD range.
By analyzing these Redfin real estate listings, we can conclude that these numbers reflect a market with a healthy inventory of mid-priced homes. This could be due to a combination of supply and demand dynamics where most consumers are looking for homes within these price brackets. The data also suggests that the luxury market is less crowded, which is typical as the buyer pool for high-end properties is smaller.
Real Estate Agents and Brokerage on Redfin
An analysis of housing market data on Redfin revealed that Compass RE Texas, LLC leads with the most number of listings and the number of agents.
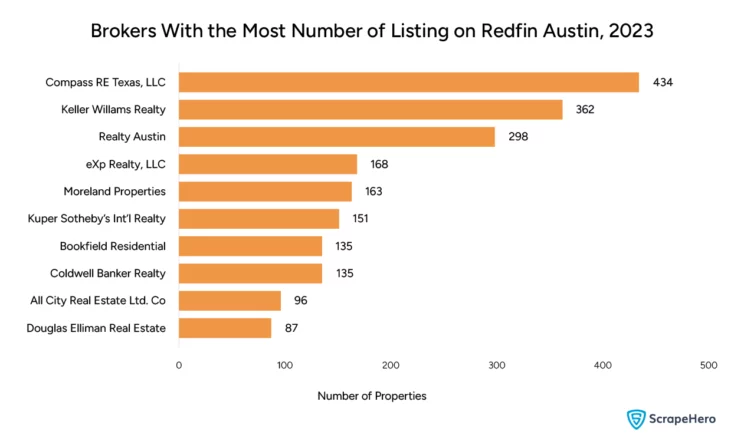
Keller Williams Realty follows with 362 listings, and Realty Austin has 298 listings, which shows that these brokers not only have a large number of agents but also a significant number of listings, possibly reflecting a high agent productivity.
The consistency in the ranking between the number of agents and the number of listings suggests that these brokerages might be employing successful strategies in listing acquisition and sales.
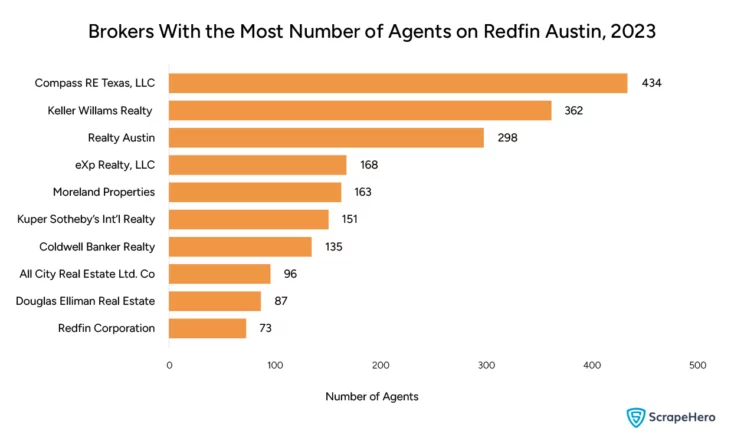
Redfin real estate listing analysis reveals a positive correlation between the number of agents a brokerage has and the number of listings it manages. Large brokerages like Compass RE Texas, LLC and Keller Williams Realty likely have comprehensive networks and resources that could provide an extensive range of options for clients.
The dominance of a few brokerages in both agent count and listings may indicate a competitive market where these well-established companies have a strong foothold.
Closing Thoughts
This in-depth analysis of Redfin real estate listings has provided us with valuable insights into market trends, property valuations, types, and sales activities. For those looking to dive deep into real estate data from Redfin, ScrapeHero Redfin Scraper is a reliable choice. This user-friendly scraper helps you web scrape real estate data to get property information such as address, broker name, price, mortgage, Redfin estimate, etc.
For those with bigger data requirements, ScrapeHero web scraping services offer a more comprehensive solution. Our expertise in extracting and processing large datasets can be invaluable for extensive market research, trend analysis, and strategic planning in real estate and beyond.