In today’s rapidly evolving real estate market, gathering and analyzing accurate data is crucial for making informed decisions. By using Zillow housing data, businesses and individuals can gain deep insights into market trends, pricing patterns, and consumer preferences.
This blog explores the significance of web scraping in real estate market analysis, focusing on how extracting data from Zillow can empower stakeholders with the knowledge needed for strategic decision-making.
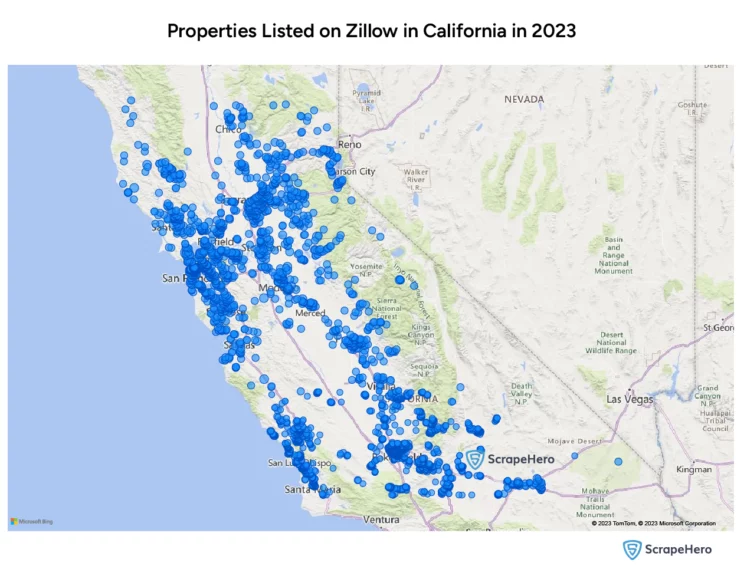
The data for this analysis was obtained using the Zillow Scraper from ScrapeHero Cloud. In the following sections, we’ll dive into the insights obtained from our extensive analysis of over 19,493 of California’s Zillow-listed properties.

Market Analysis With Zillow Housing Data
Scraping data from Zillow provides access to a wealth of property listings, prices, features, and market trends, forming the foundation for in-depth real estate market analysis. This process enables professionals to understand and predict pricing trends, offering critical insights into the evolution and future dynamics of the real estate market.
For instance, according to our data, in January 2023, California’s average home values started at 729,610 USD. They saw a slight dip in February and March. However, starting in April, there’s been a steady uptick. The peak was in September, with values hitting 747,352 USD, indicating an overall upward trend in the state’s property market this year.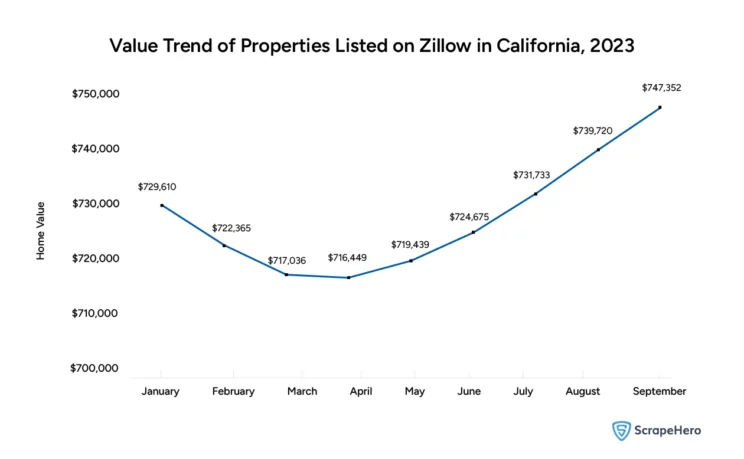
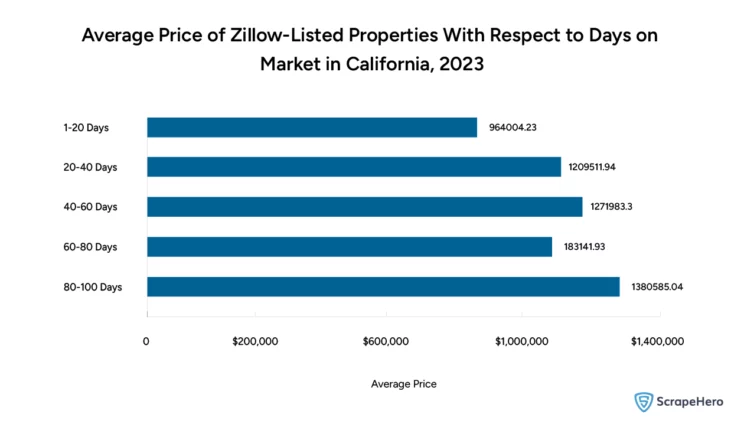
In real estate, the duration a property remains listed on Zillow before a sale is a critical metric, allowing real estate professionals to understand the market’s temperature. This timeframe, often referred to as ‘Days on Market’ (DOM), offers valuable insights into market conditions and buyer behavior.
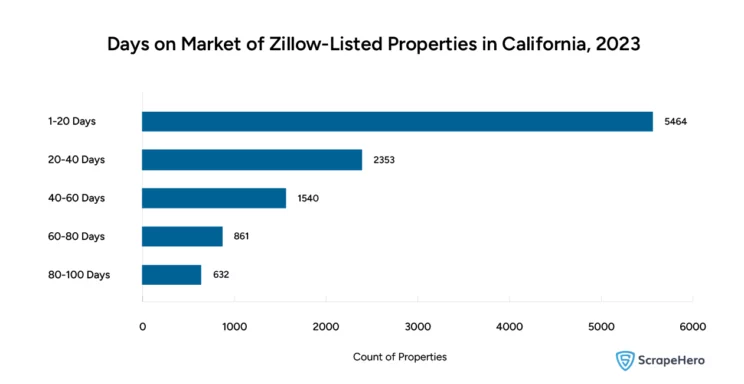
The analysis of our data indicates that a significant portion of California properties (5,464) are sold within a very short timeframe of 1 to 20 days, underscoring the dynamic and fast-paced nature of the state’s real estate market.
This trend points to a strong buyer interest and a competitive market environment, where properties are quickly snapped up soon after they are listed. Properties that remain on the market for longer periods are increasingly rare, suggesting they may have specific issues or characteristics that make them less appealing to the broad market.
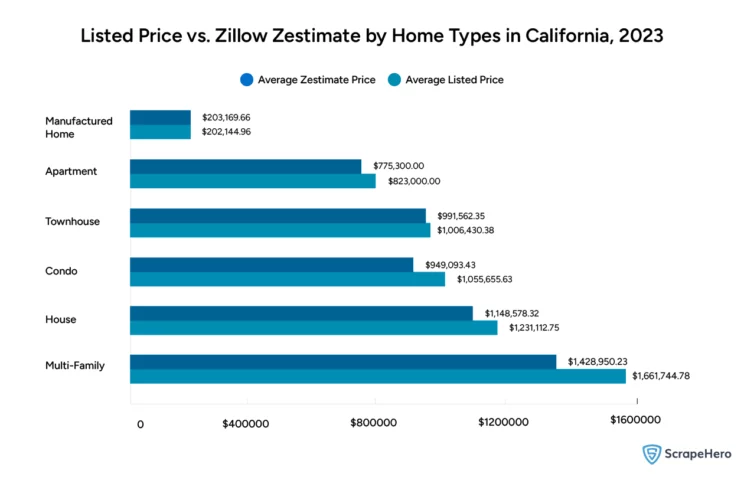
Zestimate, a prominent feature of Zillow, provides an estimated market value for properties using a proprietary formula. This tool offers a quick glimpse into a property’s potential market value.
However, a close examination of Zillow market reports with our data reveals an intriguing trend: Zestimates often fall below actual selling prices.
Competitive Analysis With Zillow Housing Data
In the real estate market, competitive analysis hinges on accurate, comprehensive data; Zillow housing data plays a pivotal role here. By utilizing a Zillow Scraper from ScrapeHero Cloud to scrape data from Zillow, realtors can access a wealth of information that is crucial for understanding market dynamics and consumer preferences.
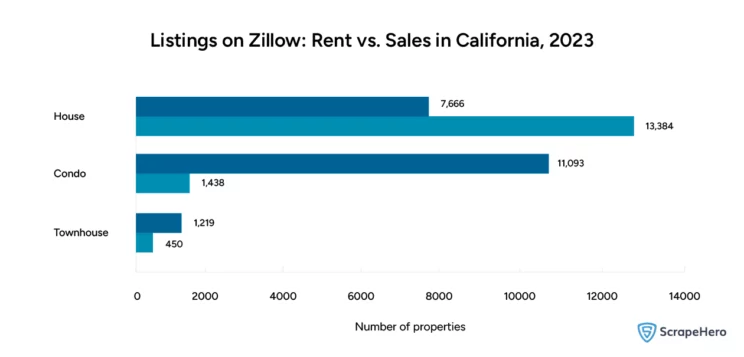
A comparison between rent and sales properties would be very insightful. For instance, a higher number of properties for sale as opposed to rent could indicate a more stable, homeowner-driven market. Conversely, a prevalence of rental properties might suggest a transient population or investor-driven market.
The analysis of our data indicates that there are more houses for sale (13,384) than for rent (7,666), suggesting a market leaning towards homeownership. This trend can indicate a stable, possibly family-oriented community where long-term residence and home ownership are preferred.
In contrast, the situation with condos and townhouses presents a different picture. With significantly more condos available for rent (11,093) than for sale (1,438), and a similar trend in townhouses, with 1,219 for rent versus 450 for sale, it points towards a more transient, renter-driven market in these property types.
This could be due to several factors, such as condos and townhouses being popular choices for temporary residents, students, or professionals who prefer the flexibility of renting. Additionally, it might indicate a strong investor presence in these segments, purchasing properties to rent out rather than sell.
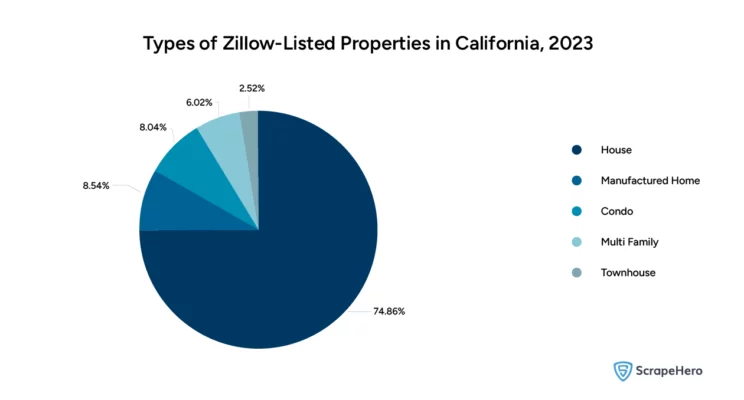
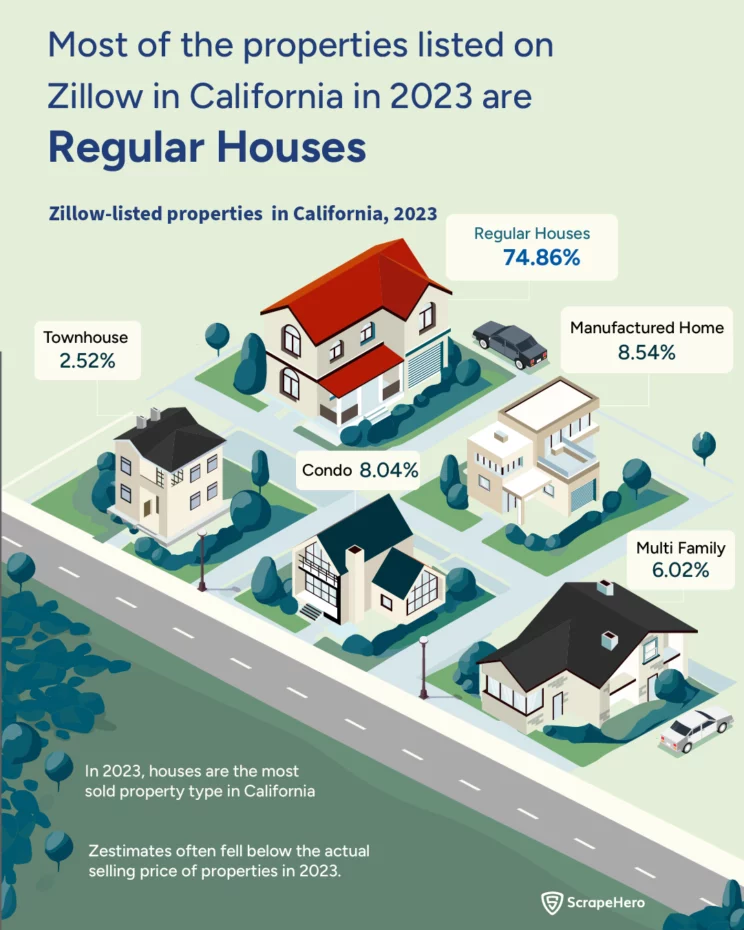
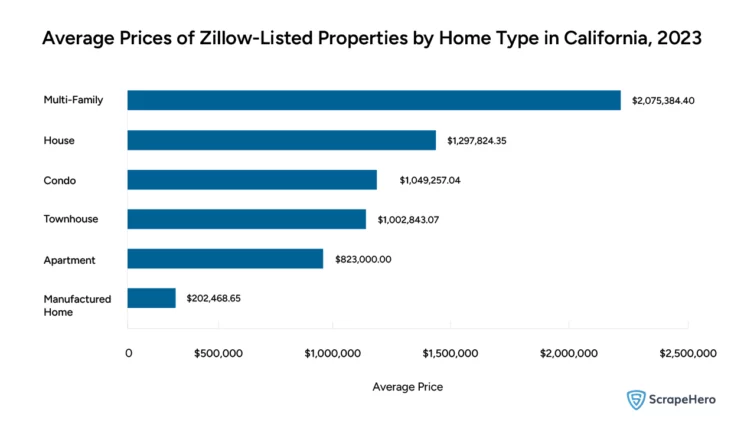
By web scraping Zillow, one can analyze the proportion of different types of properties available in the market. Most of the properties listed on Zillow, at 74.86%, are regular houses, indicating a strong demand for traditional single-family homes. This preference for houses could be driven by factors such as the desire for more space, privacy, and the appeal of homeownership in a family-oriented setting.
Manufactured homes account for 8.54% of the listings, suggesting a notable market segment interested in more affordable and possibly more flexible housing solutions. Condos, making up 8.04% of the properties, appeal to those seeking a low-maintenance lifestyle.
Multi-family homes, which comprise 6.02% of the listings, indicate an investment opportunity in the rental market, as these properties can cater to multiple tenants. Finally, townhouses, being the least common at only 2.52%, might reflect a niche market that balances the features of single-family homes and condos.
Comparing the average prices of different types of Zillow-listed properties can offer a clear perspective on market valuation. This information is essential for understanding how different property types are valued in the market.
Property Valuation With Zillow Housing Data
Property valuation is a cornerstone in real estate, requiring precise and current data. By using a Zillow Scraper to scrape data from Zillow, real estate professionals can access information that is essential for accurately analyzing the value of any property.
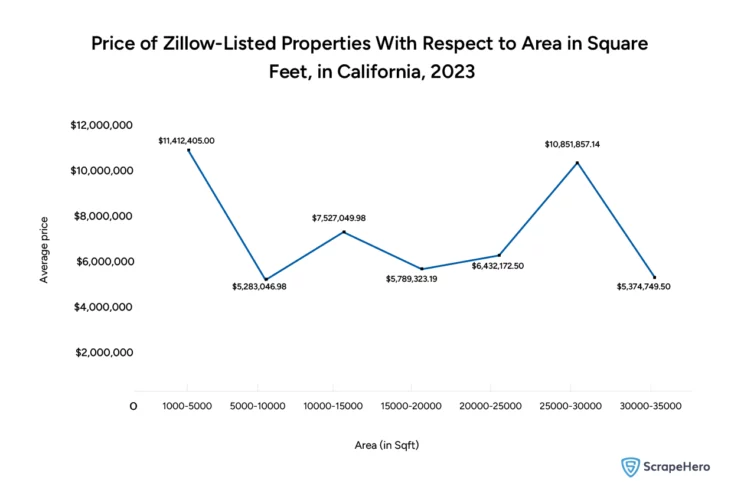
The above graph comparing the average price of properties with respect to square footage offers crucial insights into how property size impacts value. This analysis, derived from scraping Zillow data using ScrapeHero’s Zillow scraper, helps understand market pricing trends.
For example, in areas where larger properties command disproportionately higher prices, there may be a premium on space, indicating a market trend that can influence buying and selling decisions.
The area range of 1000-5000 square feet stands out with the highest average prices, signifying that properties with 1000-5000 square feet are generally more expensive. On the other hand, the 5000-10,000 area range has the lowest average prices, indicating that it is a more affordable area.
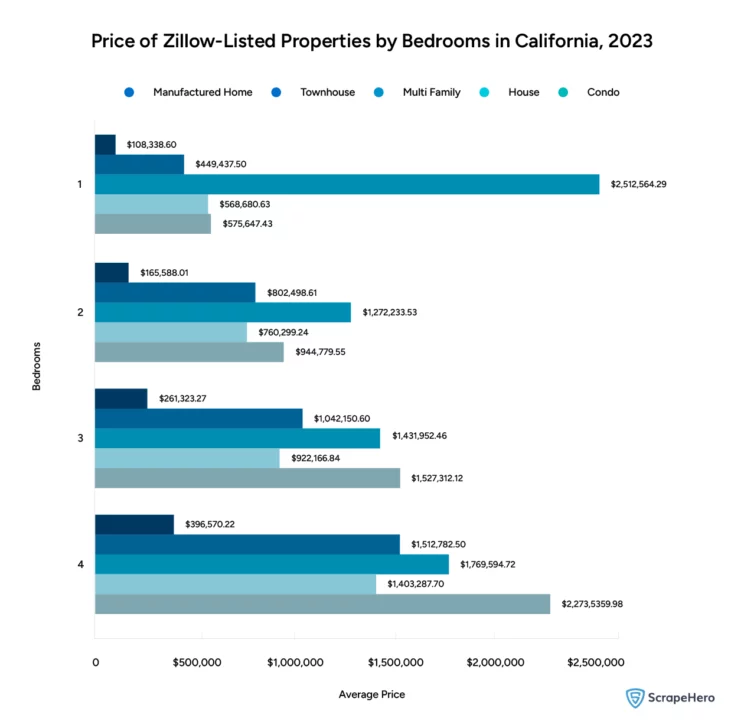
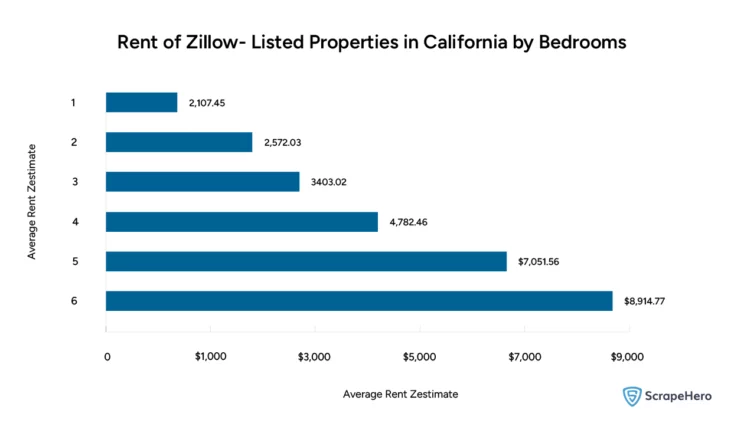
Comparing the prices of different Zillow-listed properties by the number of bedrooms is instrumental in discerning how additional bedrooms contribute to a property’s market value. In markets where additional bedrooms significantly hike property prices, there might be a higher demand for family homes or rental properties catering to larger groups.
Maximizing Investment Potential With Zillow Housing Data
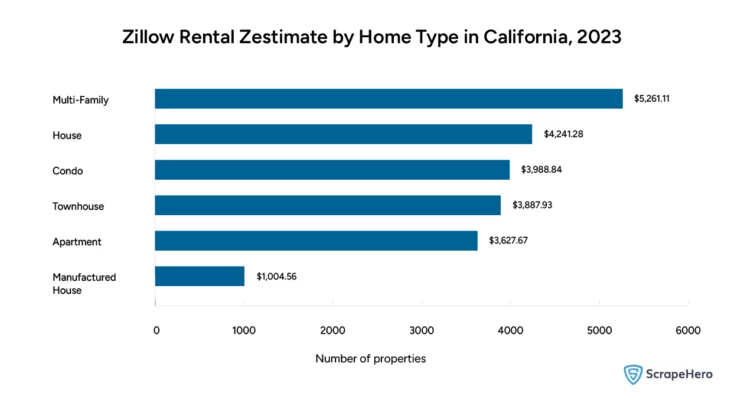
A comparison of Zillow’s rental zestimate by home type in California is another valuable asset for investors. For instance, if multi-family homes show a higher rental zestimate than townhouses, it may indicate a stronger rental market for multi-family homes in that region. This insight guides investors on where to allocate resources for maximum returns.
Comparison of the rent of Zillow-listed properties in California by the number of bedrooms can also provide a deeper understanding of the rental market. This helps identify which property configurations are most lucrative for rental income. A higher rent for properties with more bedrooms could suggest a demand for family-sized homes or shared living spaces, shaping investment strategies accordingly.
Market Trend Analysis With Zillow Housing Data
The dynamic real estate market, shaped by economic trends and consumer preferences, can be understood by analyzing comprehensive data sets from platforms like Zillow.
The connection between listing duration and property prices offers revealing insights into the real estate market. Our data shows that lower-priced properties often sell rapidly, typically within 1 to 20 days. This quick turnaround suggests a strong demand for these more affordably priced properties.
On the other hand, properties with higher price tags tend to linger on the market, sometimes for 100 days or even longer. Such extended listing durations might point towards these properties being priced beyond what buyers are willing to pay or being perceived as overpriced in the current market.
This trend underscores the importance of pricing strategies in real estate, indicating that competitively priced properties are more likely to attract buyers swiftly.
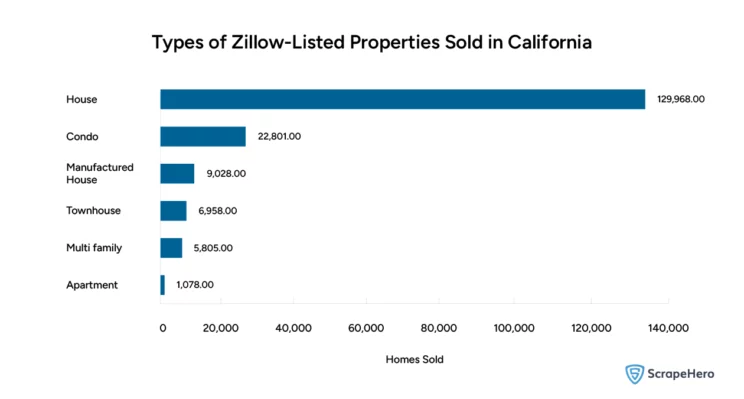
The type of properties sold also offers significant insights. In 2023, the California real estate market has demonstrated a clear preference among buyers, with approximately 128,968 houses sold, leading the sales statistics. Following houses, condos and manufactured homes also show significant sales, appealing to different segments of the market.
Apartments appear to be the least favored, with only 1,078 units sold. Overall, these sales figures highlight a market inclination towards more traditional, spacious, and private forms of housing in California, with a less pronounced interest in the typically smaller and more communal living spaces of apartments.
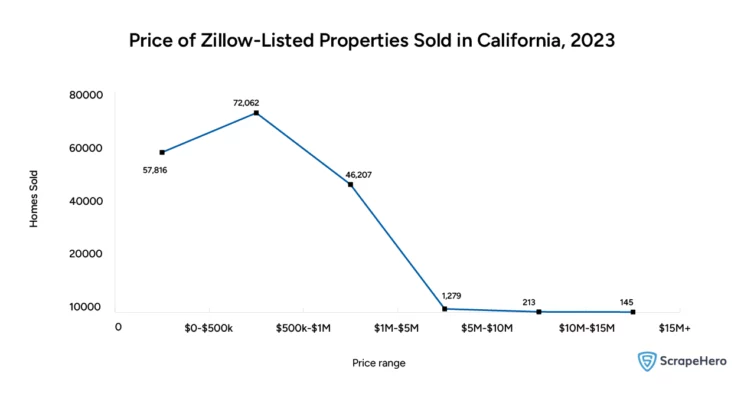
Evaluating property sales over the last six months in California, especially segmented by price range, helps understand which price brackets are most active and how consumer buying patterns are evolving.
A striking majority of the sales, with 72,062 properties, occurred in the 500,000 USD to 1 million USD bracket. It suggests that this price range is accessible to a significant portion of the market, including middle-income families, first-time homebuyers, and investors.
In contrast, the data shows a marked decrease in sales as the price range escalates. The higher price categories, notably 5 million USD -10 million USD, 10 million USD -15 million USD, and upwards of 15 million USD, witness far fewer transactions. The disparity in sales volume between these categories shows the economic realities and purchasing power of the buyers in California.
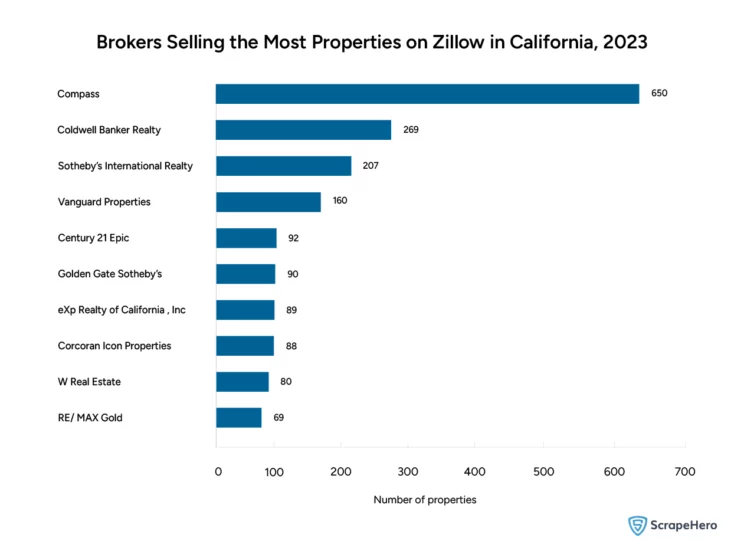
Analyzing the number of properties listed by different real estate brokers on Zillow unveils the market share and influence of these entities. It can highlight competitive dynamics in the market and show how different brokers respond to consumer needs. This aspect of the data scraped from Zillow is particularly useful for brokers to strategize their market positioning.
Final Thoughts
The insights drawn from scraping Zillow data illuminate the many facets of the real estate market. From analyzing pricing trends to understanding consumer preferences and market dynamics, the data obtained through web scraping is invaluable. It not only aids in making well-informed decisions but also shapes strategies that align with the ever-changing landscape of the real estate sector.
As we’ve seen, a Zillow crawler is an essential tool in this endeavor. By facilitating access to a wealth of data on Zillow, it empowers you with the information needed to navigate the market with confidence and precision.
For those looking to maximize their understanding of the real estate market, the Zillow Scraper by ScrapeHero offers a robust, efficient solution. Explore the potential of ScrapeHero Zillow scraper to elevate your real estate endeavors to new heights. Utilize the power of data, and make your next move with confidence.