In real estate, the platform you choose to make your decisions can also make a difference. Trulia stands out as a preferred choice for those looking to navigate the housing market. Known for its user-friendly interface and comprehensive listings, Trulia is often a go-to source for buyers, sellers, and investors alike.
In this blog, we will see how Trulia housing data serves as a foundational tool for analyzing the North Carolina real estate market.
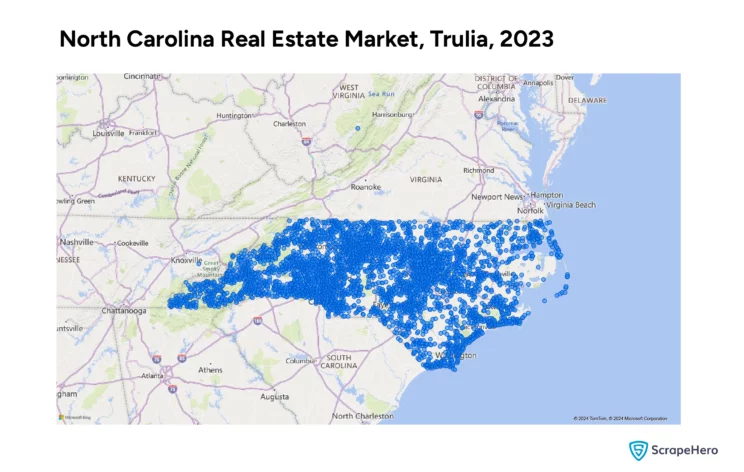
The data for this blog has been sourced using the ScrapeHero Trulia Scraper on ScrapeHero Cloud. The following sections will examine the conclusions and insights drawn from analyzing 16,995 properties listed on Trulia in North Carolina.
Don’t want to code? ScrapeHero Cloud is exactly what you need.
With ScrapeHero Cloud, you can download data in just two clicks!

Property Types in North Carolina as per Trulia Housing Data Analysis
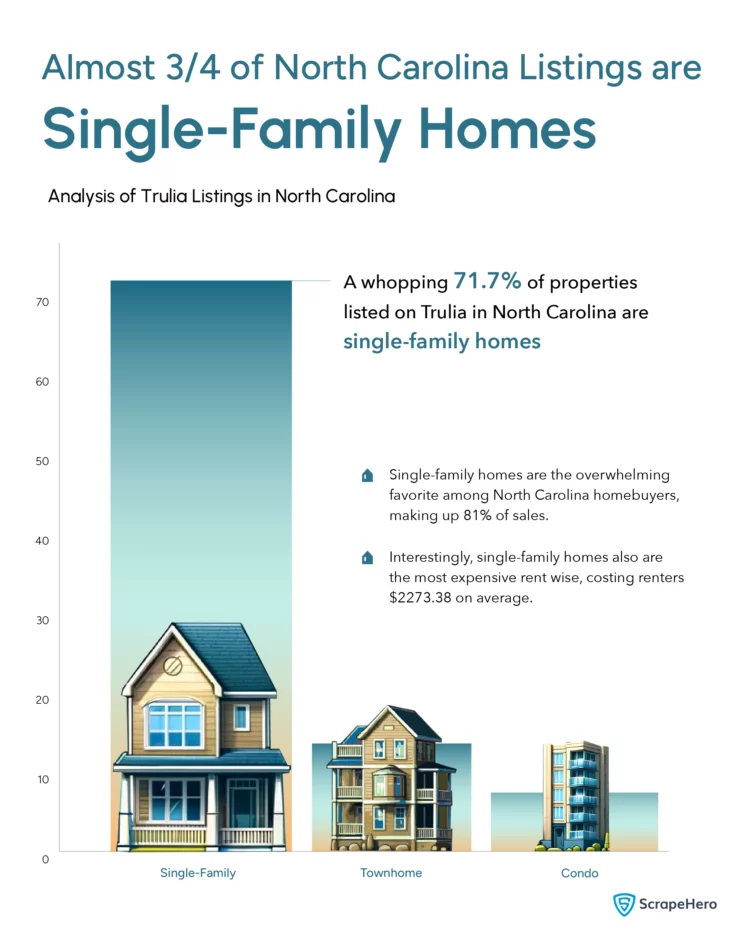
The most notable finding about the types of properties in the real estate market of North Carolina is the overwhelming prevalence of Single-Family homes. This accounts for 71.7% of the listings on Trulia. This dominance suggests that North Carolina’s housing market is largely skewed towards those who prefer traditional living spaces.
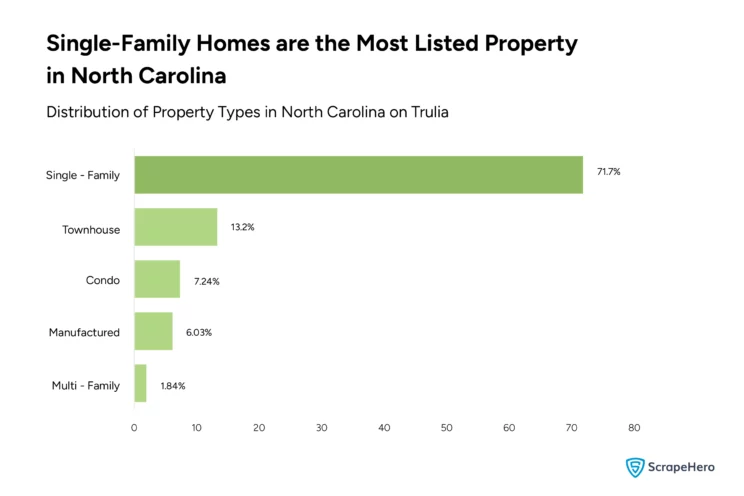
The smaller segments of the market, such as Townhouses, Condos, and Multi-family homes, indicate a more diversified real estate portfolio. Although these property types represent a smaller fraction of the market, their presence confirms opportunities for investors and homebuyers looking for variety or more affordable housing options.
Understanding these Trulia market trends is crucial for strategizing investments, marketing, and customer targeting. For instance, a focus on Single-family homes might be more profitable given their market share, but exploring the less crowded segments, such as manufactured homes, could yield high returns if approached correctly.
Price Trends in North Carolina as per Trulia Housing Data Analysis
Here’s what we found out about by scraping the real estate market of North Carolina and analyzing it.
Price vs. Property Price: Insights from Trulia Market Data Analysis
The average home prices across different types of properties revealed a distinct hierarchy in the market. Multi-family homes are the highest priced at an average price of $753,180.22. This could indicate a higher demand for investment properties.
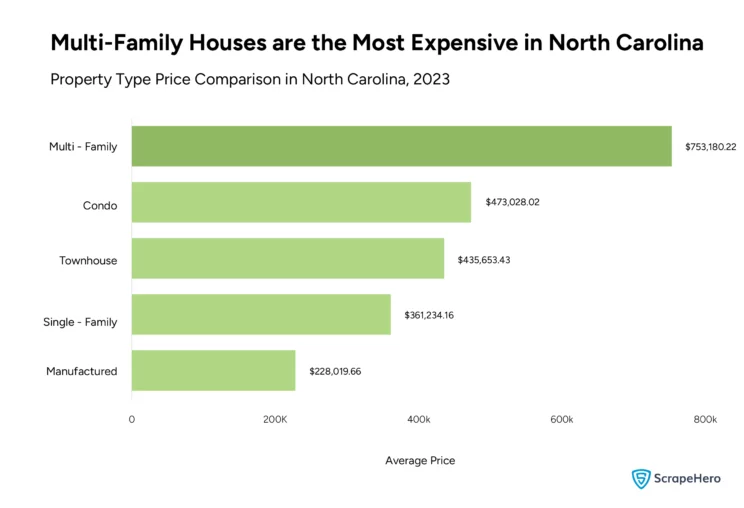
The pricing of condos and townhouses suggests that these property types are popular among buyers looking for a balance between affordability and the convenience of community living. Manufactured homes, with the lowest average price, present an affordable entry point into homeownership. This could be particularly appealing to first-time buyers or those with budget constraints.
Price vs. Property Count: Insights from Trulia Market Data Analysis
Trulia real estate data analysis revealed a significant concentration of properties in the $0 – $500K range, with 15,083 listings. This indicates a market that is packed with mid-range buyers. There is a sharp drop as price ranges ascend, with only 44 properties over $3M, showcasing a market with fewer high-end luxury properties.
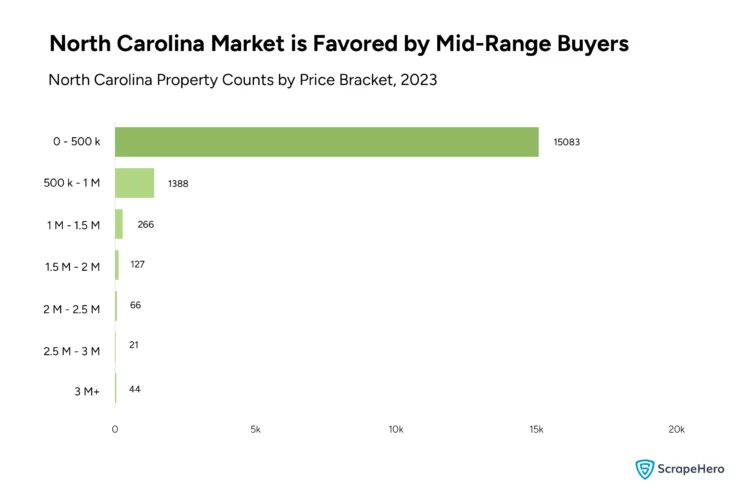
Thus, Trulia housing data analysis findings highlight a market with a strong middle segment and less saturation in the high-end luxury segment. For a real estate business, this Trulia market data suggests that there’s a ripe opportunity in the mid-range market for new developments or renovating existing properties.
Price vs. Square Feet Area: Insights from Trulia Market Data Analysis
A distinct pattern is seen when examining property prices relative to their square footage in North Carolina. From our Trulia real estate data analysis, it’s clear that prices do not increase uniformly with the size of the property. The initial segment of the graph indicates a steady climb in average price from smaller to mid-sized properties, specifically in the range of 0-2000 and 2000-4000 square feet. This is a conventional trend where larger space demands a higher price.
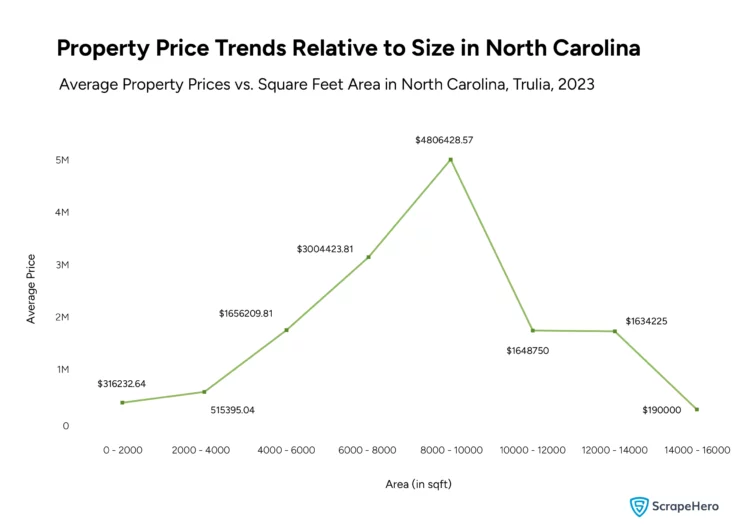
There’s a steep price peak at around $1,656,209, which suggests that properties within this square footage are highly valued or that a few high-value properties might be skewing the average upwards. Detailed Trulia research is recommended to determine the factors contributing to this spike, whether it be location desirability, property features, or market scarcity.
Further analysis of the Trulia housing data analysis reveals a sharp decline in price for properties above 10,000 square feet. This could be due to various factors, such as a limited buyer pool for such expansive properties or a potential increase in the supply of large properties that are not matched by demand.
Market Movement in North Carolina as per Trulia Housing Data Analysis
We analyzed Trulia housing data to get a picture of how the real estate market functions in North Carolina. Our analysis involved looking into the types of properties that are being built, sold and how long they stay on the market. Whether it’s the quick turnover of properties, the rise of new constructions, or the enduring popularity of Single-Family homes, these insights are invaluable for staying ahead in the North Carolina market.
New Properties in North Carolina: Insights from Trulia Market Data Analysis
The bar chart comparing the number of properties by their year of construction shows a significant trend in the North Carolina real estate market. The period between 1993 and 2008 shows a steady increase in the number of properties built, peaking during 2003-2008. However, there’s a sharp drop in properties built from 2008 to 2013, possibly reflecting the impact of the 2008 financial crisis.
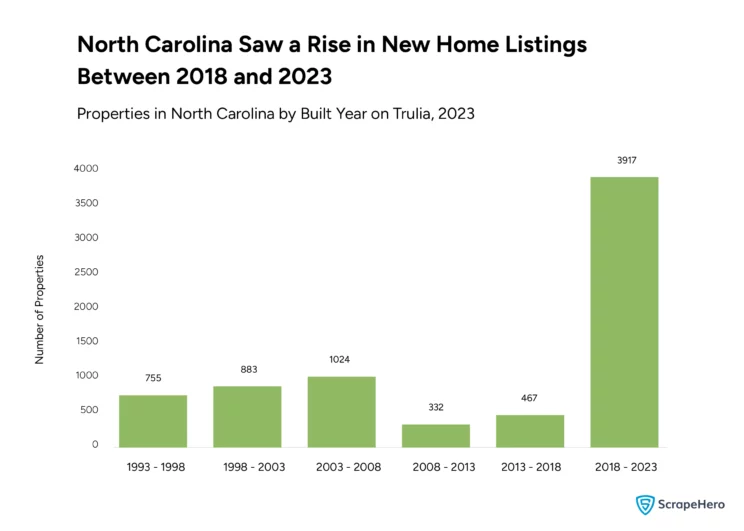
Interestingly, there’s a resurgence in construction from 2018 to 2023. This suggests a recovery and could indicate a strong economic upturn, leading to increased construction activity. This surge may be a reflection of a growing demand for modern housing driven by economic growth or an influx of population in the state.
Listing Duration of Properties in North Carolina: Insights from Trulia Market Data Analysis
An analysis of the Trulia real estate data of North Carolina to find out the number of days properties stay on the market before they are sold off showed that most properties are sold off quickly. This indicates a fast-moving market with high demand. This could suggest that properties in North Carolina are desirable and that the market is dynamic, benefiting sellers with the ability to sell quickly.
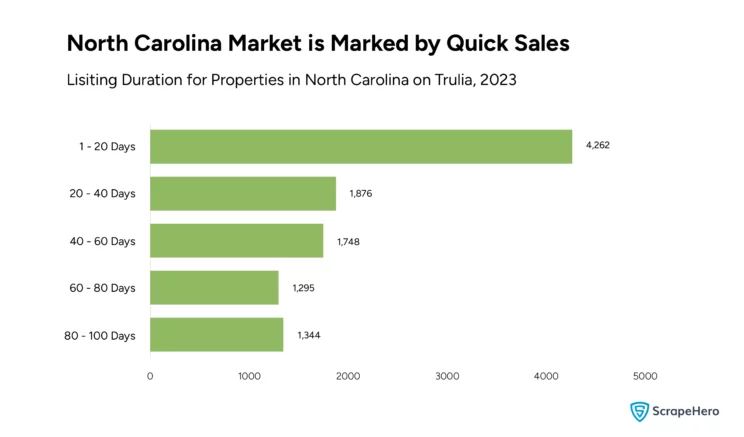
Even though most properties are sold within the first few days of listing, some remain in the market longer. These properties that are not sold quickly may not be as competitive in price, location, or features. Real estate professionals should thus price properties accurately and market them effectively to take advantage of the interest shown by Trulia market trends.
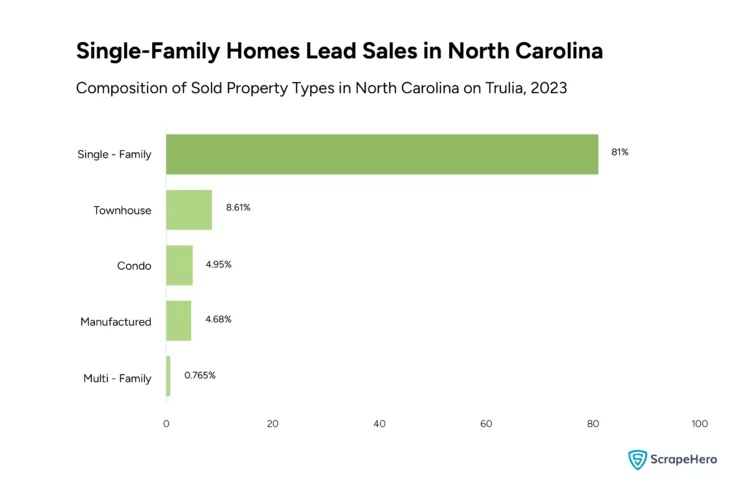
Property Types Sold in North Carolina: Insights from Trulia Market Data Analysis
Single-family homes represent a vast majority of sales at 81%, mirroring the trend in property listings. This data confirms the dominance of Single-family homes in the market, indicating a strong preference among buyers. For those in the real estate business in North Carolina, this Trulia real estate data highlights the importance of concentrating on Single-family homes. It also suggests the potential for growth in other types of properties, as they may appeal to niche markets.
Rental Market Analysis as per Trulia Real Estate Data
The analysis of Trulia housing data for rental prices of homes in North Carolina provides an interesting snapshot of the current market. According to the Trulia real estate data, there is a clear stratification in rental prices based on the type of house. Single-family homes top the list with an average rent of $2,273.384, which could be attributed to the space, privacy, and amenities they typically offer.
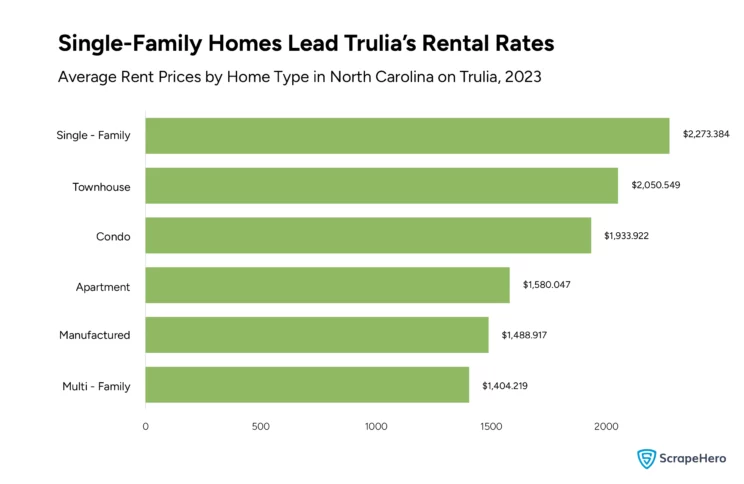
Townhouses follow closely, suggesting that they are also a popular choice for renters looking for a balance between the space of single-family homes and the conveniences of community living. Condos are priced slightly lower, possibly reflecting the trade-off between community living and the premium on space.
Apartments, which are traditionally the preferred choice of the rental market, show a lower average rent in the Trulia market data. This could be due to a higher density of apartment buildings and a larger inventory, which often leads to more competitive pricing.
Interestingly, multi-family homes have the lowest average rent. This could indicate a surplus in the multi-family rental market or a preference for other types of homes. These figures extracted from the Trulia housing data analysis could be a valuable guide for real estate investors and property managers in setting competitive rental prices and understanding the market demand based on property type.
From the Trulia real estate data analysis, the rental market is diverse and tiered, with different types of homes catering to different population segments.
Wrapping Up Trulia Housing Data Analysis
Our exploration of the North Carolina real estate market by scraping Trulia housing data has revealed many insightful trends and patterns that are valuable for buyers, sellers, and investors alike. From the dominance of single-family homes to the dynamics of pricing and property types, Trulia real estate data is critical for navigating the North Carolina real estate market.
The importance of ScrapeHero Trulia Scraper from ScrapeHero Cloud in providing access to detailed and accurate market data on the real estate market of North Carolina cannot be emphasized enough. It can be utilized by stakeholders to make informed decisions by systematically collecting and analyzing Trulia housing data.
For those with web scraping needs, ScrapeHero is a compelling option. Whether you’re looking to gather real estate market data, track market trends, or conduct research, we provide the expertise necessary to do it.
Additionally, ScrapeHero has a wide number of services that are specifically designed to meet your data extraction needs accurately and efficiently. We ensure simple access to critical information across multiple domains by employing state-of-the-art technology and experienced assistance.
Frequently Asked Questions
Trulia housing data is compiled from various sources, including public records, user submissions, and real estate listings. While Trulia keeps its data accurate and up to date, the precision of home values can vary. Factors such as market dynamics, recent property transactions in the area, and updates to a home or its features may affect these values. Trulia real estate data analysis provides a good starting point for understanding market trends and property valuations. Still, consulting with a real estate agent for the most current and precise home valuation is always recommended.
Selecting a single best website for real estate market tracking can be challenging. Websites like Zillow, Redfin and Realtor.com provide valuable information, but manually monitoring each site becomes time-consuming. It is best to consider innovative solutions like ScrapeHero. We can gather data automatically from various real estate websites, streamlining the process and freeing you to focus on analysis.

