
Realtor.com is a real estate listing website with comprehensive information about homes for sale, apartments and houses for rent, and the overall housing market. It is known for its listings and detailed property information, which assist users in making informed real estate decisions.
This blog uses Realtor housing data to comprehend the intricacies and patterns of the New Jersey real estate market over the course of a day.
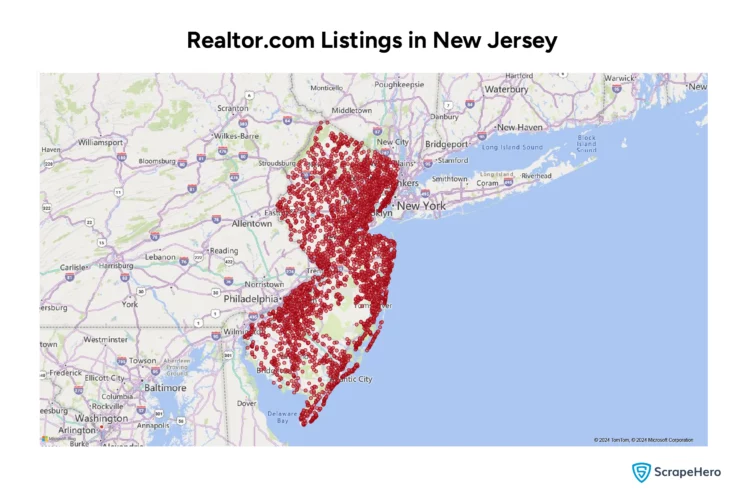
The data for this blog has been sourced using the ScrapeHero Realtor Scraper. In the following sections, we will look at the findings obtained from our comprehensive examination of more than 22002 properties listed on Realtor in New Jersey.

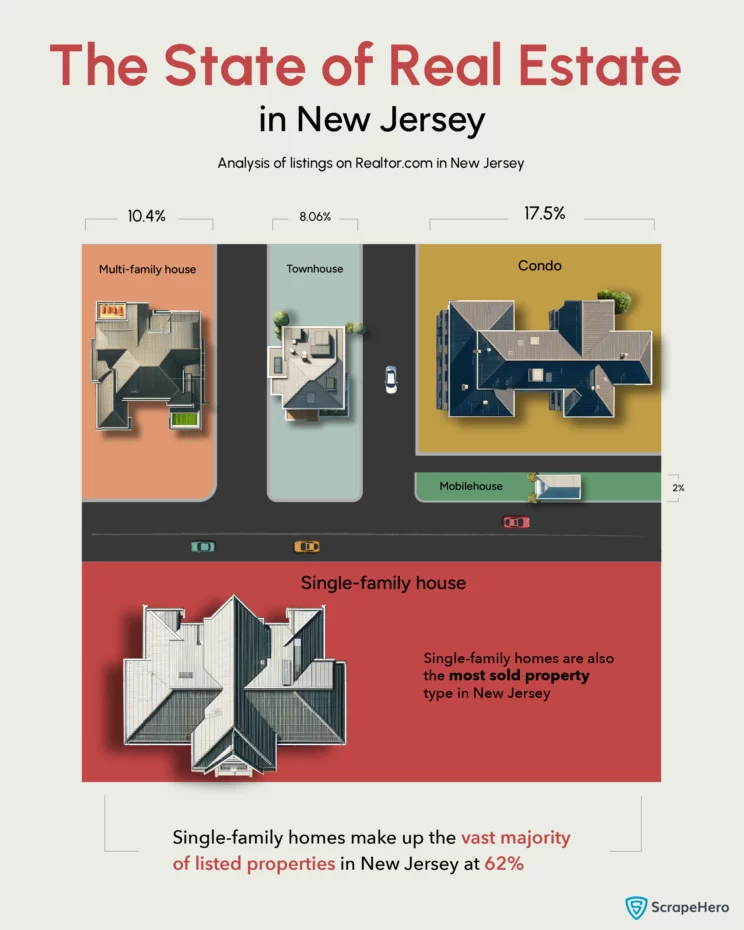
Property Types Available in New Jersey as per Realtor Housing Data
An analysis of Realtor listings in New Jersey reveals a predominance of single-family homes. These properties account for a huge 62% of the total listings, suggesting a high demand for detached houses with private yards. Condominiums and townhomes collectively hold a 25.56% share of the market, suggesting the popularity of low-maintenance housing options in densely populated areas.
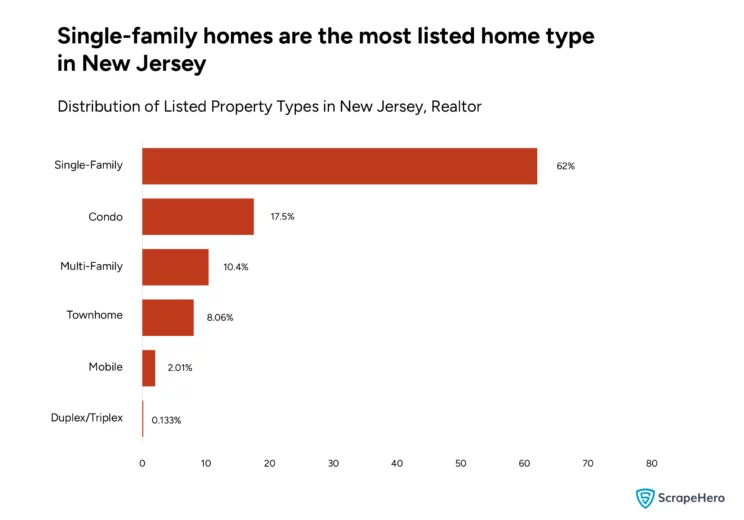
A significant drop in the percentage of listings for other property types further emphasizes the dominance of single-family homes and condos. Multi-family properties, including buildings with 2-5 units, comprise only 10.4% of listings. Mobile homes and duplexes/triplexes hold even smaller shares.
Several factors could explain the lower availability of these alternative property types. There may be fewer multi-family units and duplexes than single-family homes and condos. Additionally, zoning restrictions in certain areas might limit the development of properties.
Price Trends of Properties in New Jersey as per Realtor Housing Data
This is what we found with an analysis of Realtor real estate market data for the price trends in New Jersey:
Price vs. Property Price: Insights from Realtor Research Data
The graph below compares the average home prices across different types of housing in New Jersey, as per our Realtor research data. Multi-family homes are the priciest, followed closely by single-family homes. Mobile homes are the most affordable on the list.
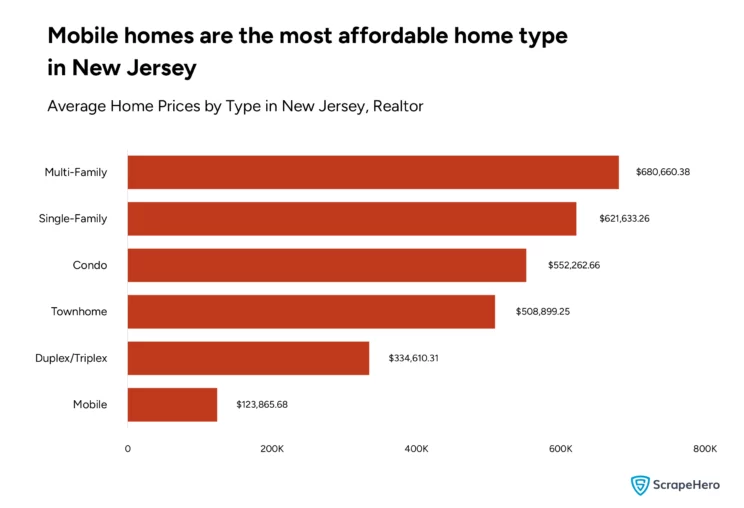
The variation in pricing can be due to several factors, such as the size and amenities of the property, the cost of land in the area, market demand, and the general preference for more spacious living accommodations, which multi-family and single-family homes tend to provide. Additionally, the relative affordability of mobile homes might reflect both their smaller size and potentially lower land ownership costs.
Price vs. Property Count: Insights from Realtor Research Data
The most number of properties, 11,404, is found in the most affordable price range of $0 to $500,000 in New Jersey. This number decreases as the price range increases. The trend of diminishing property counts continues for higher price ranges, and a significant drop to only 137 properties in the $2 million to $2.5 million range.
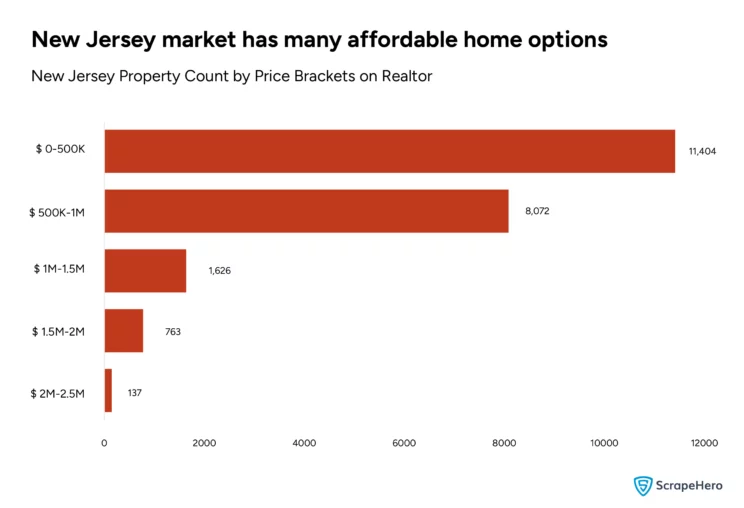
This distribution suggests that there is a larger market and possibly a greater demand for more affordable housing in New Jersey. Higher-priced properties are scarce, which could be due to a combination of factors, including the affordability for the average buyer, the economic status of the population, and the availability of luxury properties.
What Days on Market Reveals About New Jersey as per Realtor Housing Data
The bar graph below provides an insightful visualization of Realtor.com housing data; specifically, it shows the duration properties in New Jersey remain listed before being sold or taken off the market. A significant finding is that the majority of properties, 5,758, are listed for a short period ranging from 1 to 20 days.
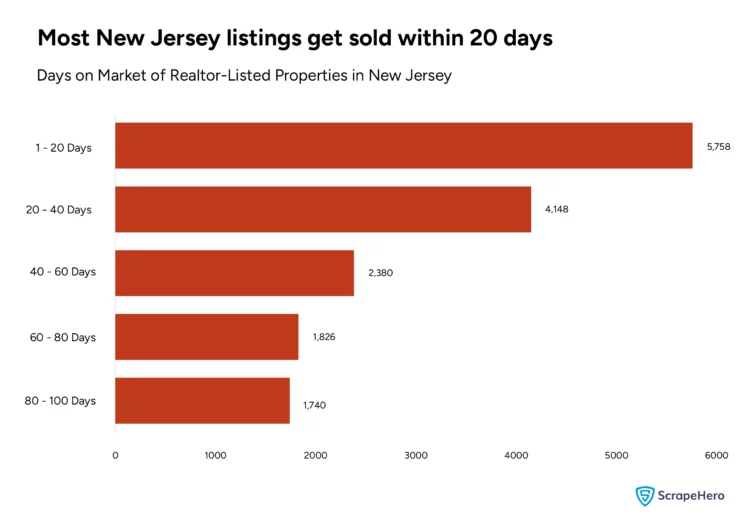
These findings from the Realtor research data could indicate a strong demand in the Realtor housing market, where properties are being sold relatively quickly. The properties listed for longer periods may have certain less-desired features or may be priced above what the market dictates. This Realtor market data analysis points to a dynamic and active real estate market in New Jersey, where speed of sale is prominent.
Days on Market vs. Price as per Realtor Housing Data Analysis
An analysis of the relationship between listing duration and the average price of properties listed on Realtor in New Jersey shows that properties listed for 1-20 days have an average price of $595,216.08. This average dips slightly for properties listed for 20-40 days and then further for those listed for 40-60 days. Interestingly, there is a rebound in the average price for properties listed for 80-100 days, which nearly mirrors the initial price range of $594,586.54.
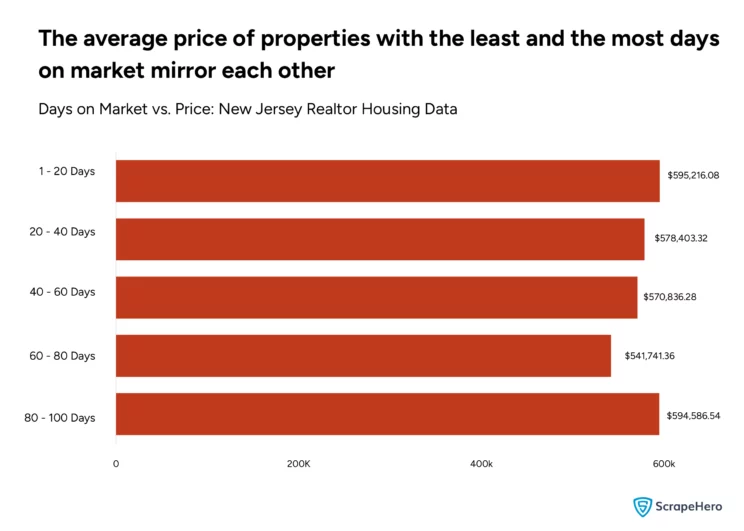
When comparing this observation with the previous observation regarding the count of Realtor-listed properties, it seems that properties with either very short or very long listing durations maintain higher average prices. This could indicate that both newly listed properties and those that withstand longer market durations have distinguishing features that maintain their value in the Realtor housing market data analysis.
Rental Market of New Jersey as per Realtor Research Data
Our analysis reveals that duplexes and triplexes have the highest average rent, significantly more than other property types in New Jersey. Townhomes follow while single-family homes and apartments are more affordable.
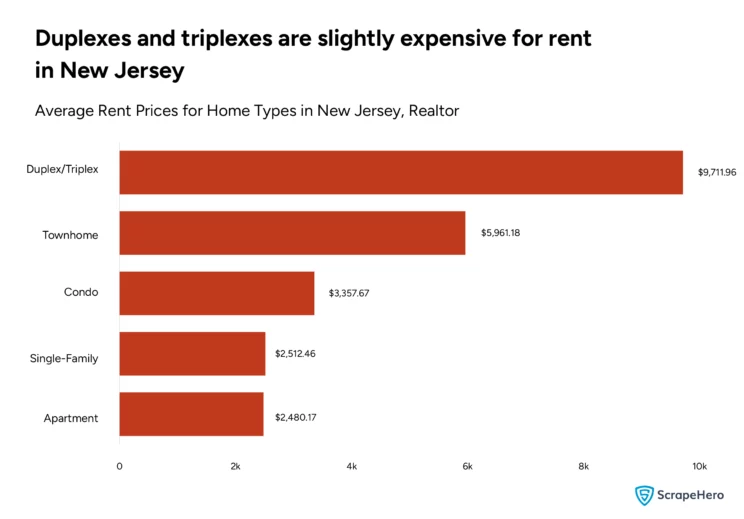
This distribution suggests a correlation between the size and complexity of the property and its rent price; larger, more private homes like duplexes and triplexes command higher rents. Conversely, the greater affordability of apartments and single-family homes reflects their broader availability and appeal to different market segments.
The demand for these property types, as reflected by Realtor market data analysis, could also drive prices up. If this graph is analyzed alongside the days on the market for these property types, it is possible to find a relationship between rent prices and market dynamics, such as turnover rate and demand intensity.
Market Movement in New Jersey as per Realtor Research Data
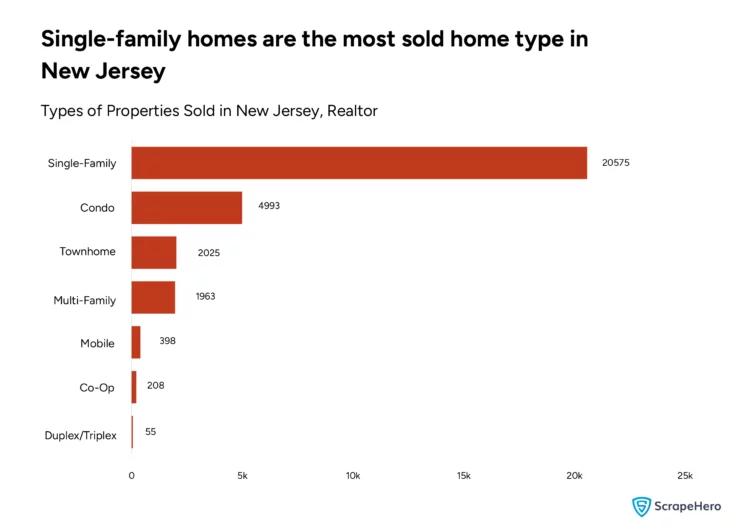
Most Sold Properties and their Price Range in New Jersey
Our analysis of Realtor housing data reveals that single-family homes lead the New Jersey market with 20,575 properties sold, followed by condos, townhomes, multi-family homes, mobile homes, co-ops, and duplexes/triplexes. This hierarchy suggests a strong preference for single-family homes, likely due to their appeal to families seeking more space and privacy.
The majority of properties, totaling 17,754, were sold for under $500,000. The $500K – $1M range accounted for 10,752 sales, indicating a robust mid-market segment. The higher price brackets saw significantly fewer sales. These trends could be driven by the general affordability and demand in the housing market, where lower to mid-priced homes are more accessible to a larger pool of buyers.
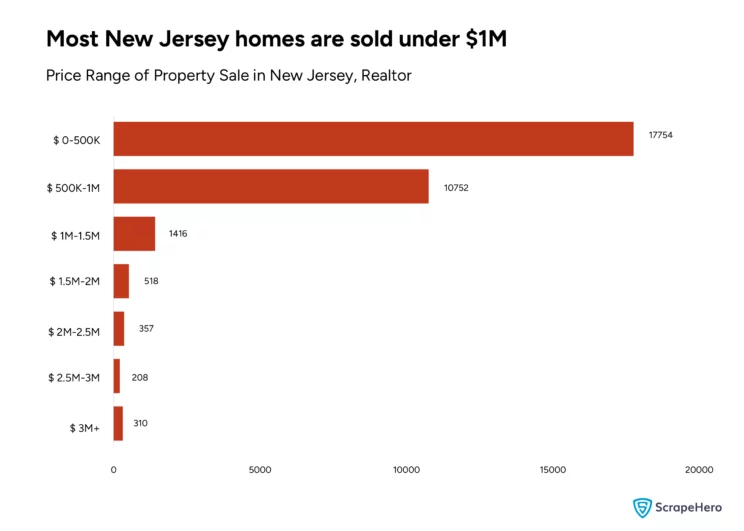
The New Jersey real estate market, as understood by Realtor market data analysis, has many lower-priced single-family homes. The drop in sales as price increases may be due to the economic factors limiting buyer pool sizes for luxury and higher-priced homes, or it could mirror the overall income distribution and spending power within the state.
Listed Price vs. Sold Price: New Jersey Homes Types as per Realtor Housing Data
Single-family homes show the highest sold price at approximately $672,876, with the listed price slightly lower, around $659,578 in New Jersey. Condos and townhomes are in the mid-range, with sold and listed prices very close to each other, indicating a market with tight pricing accuracy for these property types.
Duplex/triplex homes, co-ops, and mobile homes show the least discrepancy between sold and listed prices, with co-ops almost matching sold versus listed. Mobile homes have the smallest average prices but also reflect a close match between listed and sold prices.
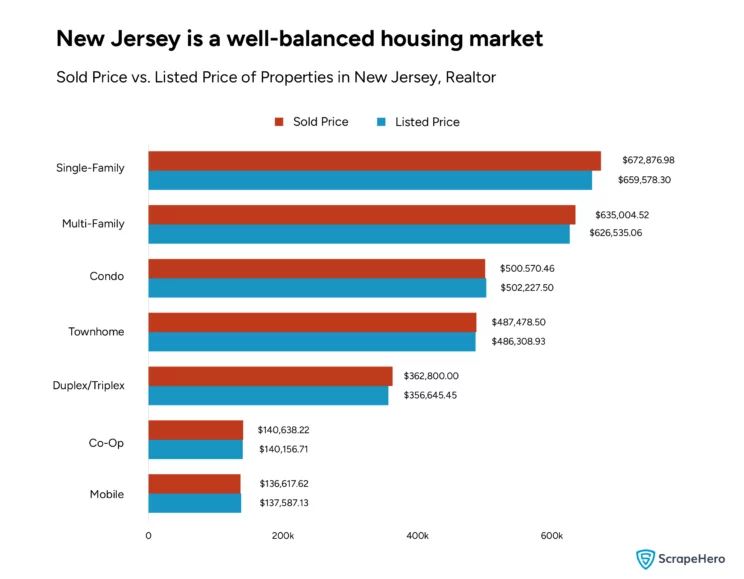
The Realtor market data analysis shows a small difference between the listed and sold prices across all property types. This suggests a well-balanced market where properties are listed at prices close to what buyers are willing to pay. This could indicate that Realtor real estate market data is well-calibrated to the actual value of homes in New Jersey, leading to efficient market transactions.
Closing Thoughts on the New Jersey Markets as per Realtor Housing Data
Our analysis of Realtor housing data has provided an extensive view of how the housing market in New Jersey is. It is a market with a strong preference for single-family homes and is inclined toward more affordably priced properties. The relatively quick turnover of homes suggests a dynamic market, with properties often selling close to their listed prices. This indicates a healthy alignment between buyer expectations and market valuations.
It’s important to mention that the ScrapeHero Realtor Scraper was an important tool in recognizing the nuances of the New Jersey real estate market. By efficiently extracting vast amounts of data, this tool has been indispensable in our research.
Whether you are an investor, a realtor, or someone looking to purchase or rent a home, the insights from this blog show the importance of utilizing web scraping tools and market data in navigating the real estate market effectively. For large-scale real estate scraping and custom data requirements, ScrapeHero services will be the right fit.
Frequently Asked Questions
According to the analysis of Realtor housing data, there isn’t a clear indication of home prices dropping in New Jersey. Instead, the data suggests a well-balanced market where properties are listed close to their actual selling prices, indicating stability rather than a significant drop in prices.
The average price of a house in New Jersey varies depending on the type of property. Single-family and multi-family homes have higher average prices than mobile homes. Using the ScrapeHero Realtor scraper is recommended to obtain the most recent and detailed information on average house prices.