
Peloton is a fitness company founded in 2012 that brought interactive workouts to the comfort of home. They offer an integrated system with hardware and software featuring stationary bikes, treadmills, etc., and a subscription service to live and on-demand classes. This innovative approach provided an unparalleled at-home fitness experience that soon became synonymous with modern wellness. But it was in 2020, amid the pandemic lockdown, that Peloton truly became a household name. The brand’s bikes soared in popularity as home workouts became the norm. In this blog, we will do a thorough analysis of Peloton, its strategies, triumphs, and the challenges it faced. We will also walk you through the brand’s phenomenal pandemic growth and what followed next.
Pandemic-Driven Transformation: Peloton’s Growth
The pandemic led to elevated health awareness among people and catalyzed the fitness industry’s expansion. For Peloton, this translated into a surge in demand for their products, doubling their production capacity.
Annual Revenue
While seasonal trends always play a role in sales, a detailed analysis of Peloton shows that the pandemic era greatly affected the brand’s annual revenue:
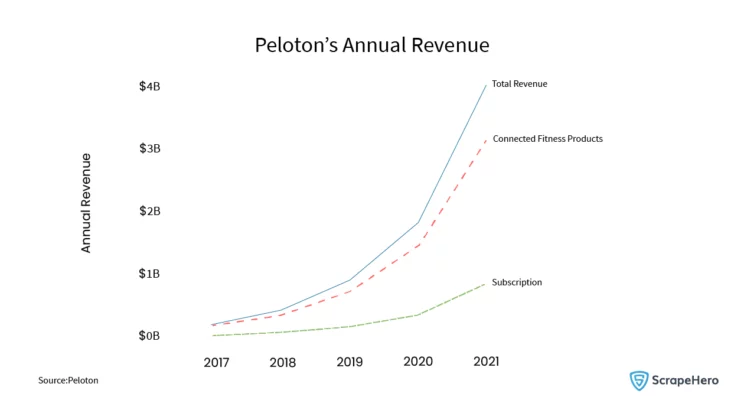
These revenues stemmed mainly from Peloton’s Connected Fitness Products and Subscriptions, with the latter making up two-thirds of the total revenue. The realtors and Peloton Commercial Real Estate experts closely observed and analyzed Peloton and how these figures reflected the brand’s real estate decisions.
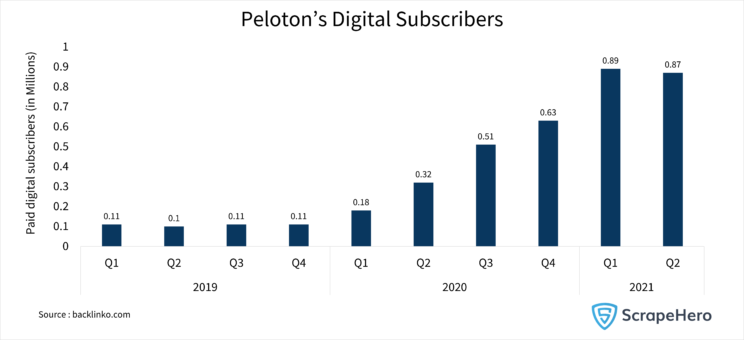
Subscriptions
In 2020, Connected Fitness subscription workouts grew 333% to over 76.8 million. Additionally, the Peloton Digital subscriptions grew 210% to over 316,800. The total number of members was then 4.4 million. When the fourth quarter ended, the 12-month retention rate was 92%. As seen below in the graph, the total number of Peloton members grew to 5.9 million by the second quarter of 2021.
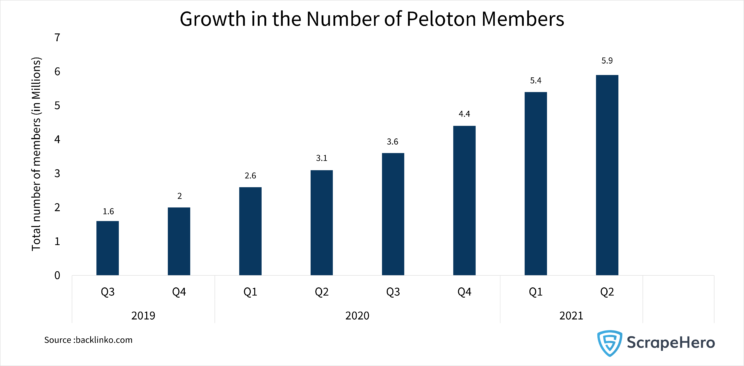
These increasing subscription numbers also provided valuable insights for location data providers and real estate data providers in understanding consumer trends.
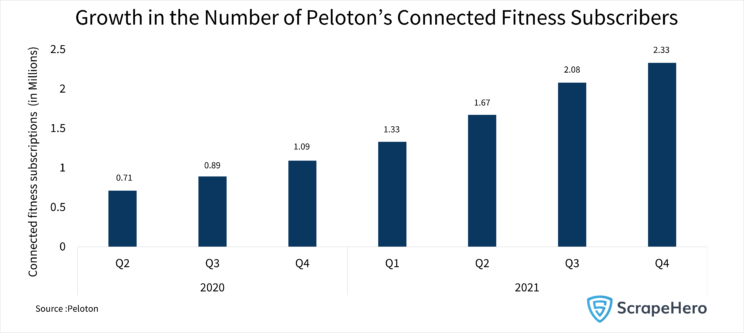
Peloton’s Connected Fitness subscribers have also been significantly growing. The subscription revenue comes from a monthly 39 USD Connected Fitness subscription and a 12.99 USD Peloton Digital subscription.
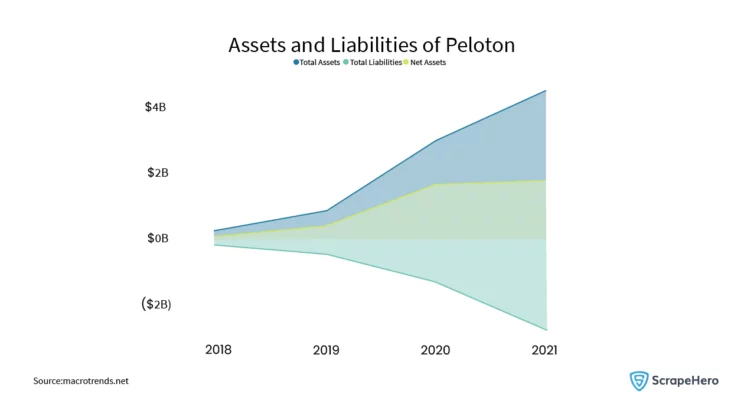
While the brand’s demand (including hardware and subscriptions) skyrocketed, the company took that as the right time and opportunity to ramp up its resources. Take a quick look at Peloton’s assets and liabilities to analyze the brand better.
Assets and Liabilities
Peloton’s total assets for the September 30, 2021, quarter stood at 4.415 billion USD (26.94% year-over-year increase), with liabilities at 2.908 billion USD (73.43% year-over-year increase).
The company also tackled COVID-19-induced supply chain disruptions by acquiring Precor in April 2021 for 420 million USD. This move was aimed to set up manufacturing units within the US, addressing delivery delays and subtly influencing Peloton Commercial Real Estate considerations.
The Challenges of Rapid Growth
Peloton’s rapid success was not without hurdles. An imbalance of supply and demand created unique challenges, both in product delivery and in the strategic planning of Peloton locations. How Peloton navigated these challenges offers a glimpse into the sophisticated world of commercial real estate decision-making, where location data providers play an increasingly vital role.
As we move into the next section, we will explore further how Peloton’s pandemic-fueled growth provides lessons for realtors and those invested in commercial real estate. The interplay between Peloton’s business success and its Peloton store locations offers an exciting perspective on contemporary retail and real estate strategies.
Location data providers and real estate data providers often provide insightful data like Point-of-interest (POI) datasets and location intelligence to businesses that help them adapt, foresee market needs, and align strategies to ensure growth.
The Shift: A New Turn in Fitness and Peloton Commercial Real Estate Landscape
2021 marked an unexpected turn for Peloton, the brand that had redefined at-home fitness through its innovative Connected Fitness Products. But as economies began reopening, the brand started facing challenges that would shape its product strategy and commercial real estate considerations.
Reassessing the Landscape
As people grew weary of home workouts, Peloton saw a drop in demand for Bikes and Treads. Contrary to expectations, the reopening of economies led to decreased sales. The company’s efforts to ramp up production suddenly faced an imbalance where supply outweighed demand.
The rise in global commodity and freight costs further complicated the situation, impacting the strategies related to Peloton Commercial Real Estate and Peloton locations.
Stock Prices
Peloton went public in late 2019 at 29 USD a share, and as seen in the graph, the stock price soared to 77.80 USD by August 2020. Remarkably, while other tech stocks struggled during the pandemic, Peloton’s stocks flourished, reaching a high of 167 USD in January 2021.
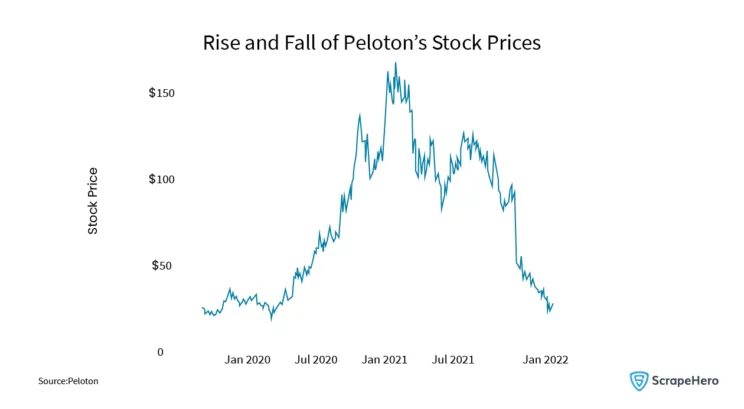
However, the last three months have seen a loss of more than 70%, reflecting the fluctuations in demand and supply. This volatility was significant for investors and hints at underlying challenges affecting Peloton store locations and broader real estate strategies.
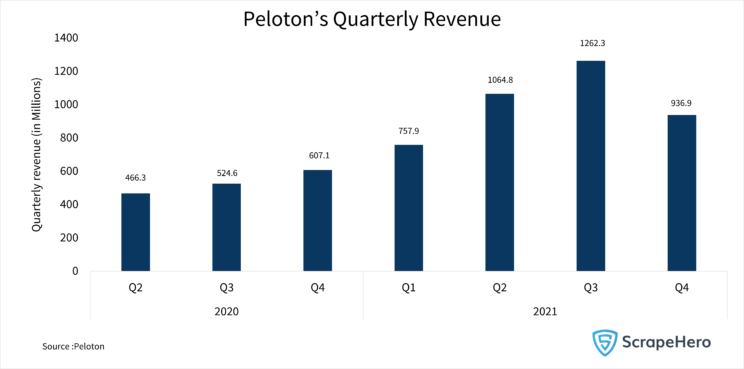
Revenue: Rise and Fall
Peloton’s total revenue reached 936.9 million USD, a 54% year-over-year growth fueled primarily by its Connected Fitness segment, including Precor’s contribution, which accounted for 70% of total revenue. But the last quarter witnessed a dip, partially due to Tread recalls.
Here, real estate data providers can gain insights into how changes in revenue parallel shifts in commercial real estate decisions. The interconnectedness of product performance and Peloton locations offers valuable lessons for realtors navigating the dynamic retail landscape.
A Dip in Peloton Digital Subscriptions
The second quarter of 2021 witnessed a decrease in Peloton Digital subscriptions. In response, the company reduced Bike prices and offered membership discounts. These changes signaled a short-lived demand for the brand and necessitated hitting the “reset button” multiple times in 2021.
Looking Ahead
Peloton’s journey through 2021 is a case study in adaptability and strategic thinking. As we further analyze Peloton’s evolution, we’ll delve into how these challenges and transformations affect Peloton store locations, providing a unique perspective on today’s multifaceted commercial real estate market.
Peloton’s Evolution: Adaptation in a Changing Market Landscape
Significant Reorganization
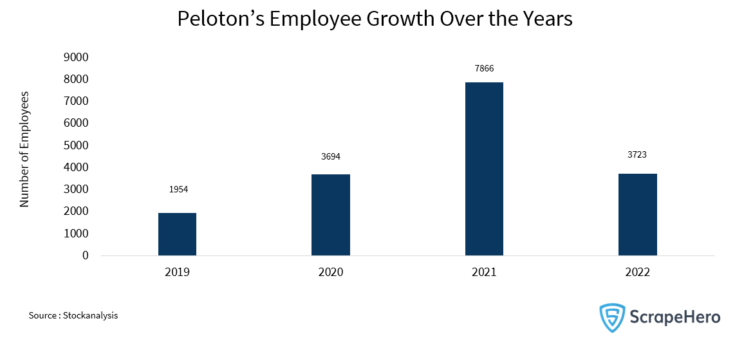
Peloton faced crossroads when its market cap plummeted from around 50 billion USD to approximately 8 billion USD. In response, the company took decisive action, laying off 20% of its workforce, right-sizing production, and recalibrating sales expectations. The situation became so serious that the co-founder stepped down.
Location Strategy: Meeting Modern Demands
Today’s consumers prioritize experience, personalization, sustainability, and convenience. Peloton understood this shift and responded by refining its urban brick-and-mortar stores to create a cohesive omnichannel experience.
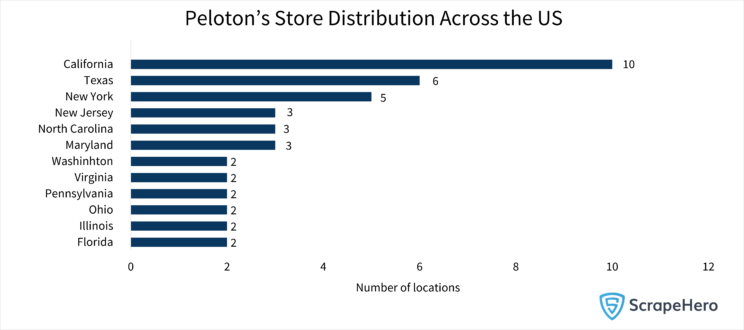
The above chart shows the count of Peloton store locations per state. California has the highest number (10) of Peloton stores. In the US, Peloton has its stores around major urban markets and suburbs as a part of its strategy. It essentially operates in areas where the target customers are based.
Pricing Strategy
Peloton has adopted a hybrid pricing model where the customer pays for both the digital and the hardware. In the fourth quarter of 2021, the company slashed Bike prices by 20%, dropping the original Bike price to 1,495 USD. This approach aimed to increase affordability and expand its customer base. In 2022, however, prices returned to their original levels.
Additionally, Peloton introduced discount pricing for digital memberships in 2021, aiming to transition these subscribers to full memberships.
Apparel Category
Collaborations with brands like Adidas and Beyonce have allowed Peloton to offer a wider range of clothing, including gender-neutral options and plus sizes. This diversification helped the branded apparel revenue to more than double in 2021, reaching over 100 million USD.
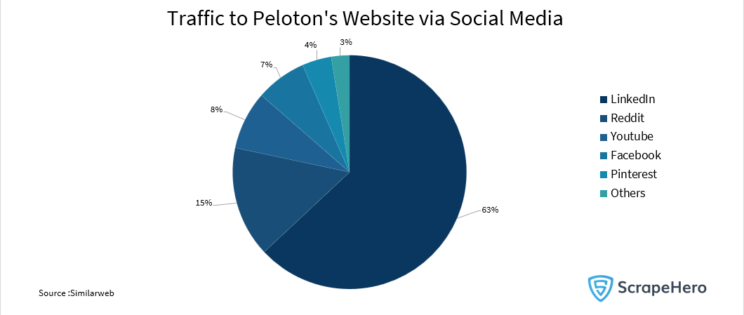
Marketing Approach
Peloton’s marketing strategy employs television, OTT services, and social media platforms like Facebook, Twitter, and Instagram. Community engagement and word-of-mouth referrals have also played a vital role.
Product Strategy
Continuously evolving its tech-driven product range, Peloton announced the release of a new Bluetooth heart rate monitor in 2022 and launched its private label, Peloton Apparel, in September 2021. This effort to penetrate deeper into the fitness market reflects a strategy of innovation and market responsiveness.
Customer Experience
Peloton’s diverse instructor lineup and exclusive features, like ‘’scenic rides,’’ contribute to an engaging and community-driven experience. Although the company faces challenges with delivery delays and cancellations, its commitment to enhancing the customer experience remains clear.
Conclusion
Peloton’s ability to navigate challenges demonstrates a robust understanding of the market and a willingness to take necessary actions to align with changing consumer preferences. It serves as a case study for other businesses to learn how to remain agile and responsive in an unpredictable market landscape.
For those planning to enter or adapt within this dynamic industry, investment in strategic data and insights can provide a competitive edge. Embracing these lessons can equip businesses to survive, prosper, and innovate in the ever-changing world of consumer engagement.
Download Peloton store locations and detailed location reports on Peloton locations to make informed and profitable decisions.