About this Analysis:
This analysis is based on data collected from Amazon Australia, using the ScrapeHero Cloud Amazon Search Results Scraper — a no-code scraper built by ScrapeHero, a fully managed web scraping service. Market size and revenue figures are sourced from Research and Markets and Forbes respectively.

Key Highlights
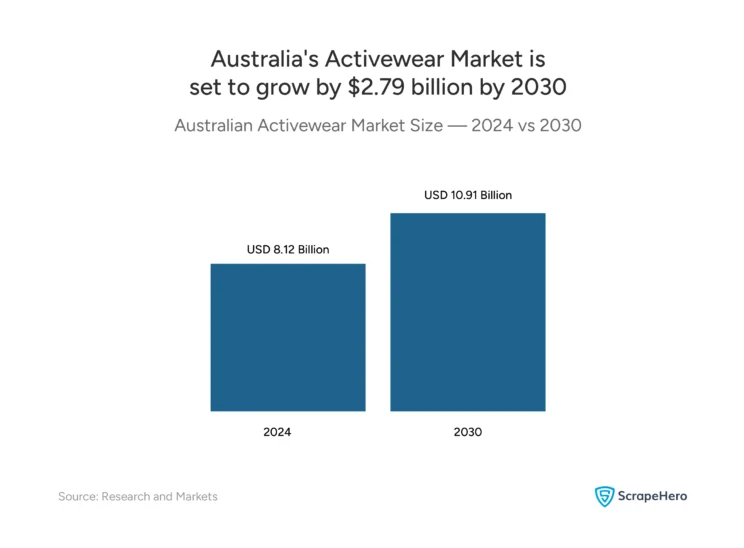
- Australia’s activewear market is projected to grow from $8.12 billion in 2024 to $10.91 billion by 2030.
- Globally, Nike earns nearly double what Adidas makes — $47.9B vs $25.6B in 2025 revenue.
- On Amazon Australia, Adidas lists the most products (399) but Nike leads in customer ratings (4.44).
- New Balance is the most expensive of the three, averaging $138.16 per product — nearly 2.4x Adidas’ average of $56.94.
- Nike runs just 3 sponsored products on Amazon Australia. Adidas runs 93. Nike still wins on ratings.
- Adidas dominates footwear reviews. Nike leads in clothing. New Balance is strongest in accessories.
The Australian Activewear Market Is Bigger Than You Think
Australia’s activewear market is large, growing, and increasingly competitive. It was valued at $8.12 billion in 2024 and is projected to reach $10.91 billion by 2030, a compound annual growth rate (CAGR) of 5.11%.
That’s nearly $3 billion in new market value expected over six years.
For Nike, Adidas, and New Balance, this isn’t a market they can afford to ignore. And the data shows all three are actively competing for their share of it, each with a different strategy.
Nike vs Adidas vs New Balance — Global Revenue Sets the Stage
Nike is the biggest sportswear brand in the world, and it isn’t close.
According to Forbes, Nike reported $47.9 billion in global revenue in 2025. Adidas followed with $25.6 billion. New Balance, the smallest of the three, reported $7.8 billion.
Nike earns almost as much as Adidas and New Balance combined.
But global revenue only tells you who has the biggest war chest. It doesn’t tell you who is winning on the ground in Australia. A brand can dominate globally and still lose locally — on price, on product variety, or on customer satisfaction.
That’s exactly what makes the Amazon Australia data interesting.
How Nike, Adidas, and New Balance Stack Up on Amazon Australia
Data collected from Amazon Australia, using the ScrapeHero Cloud Amazon Search Results Scraper.
Which Brands Dominate the Australian Sportswear Market on Amazon?
Adidas lists the most products on Amazon Australia. But more products doesn’t automatically mean more trust or more sales.
Here’s how the three brands compare on product count:
- Adidas: 399 products
- New Balance: 329 products
- Nike: 293 products
Adidas is clearly pushing hardest for shelf space on Amazon. Nike, despite having the fewest listings, still commands the strongest customer ratings, which points to a very different strategy.
Is Nike or Adidas More Popular in Australia?
On Amazon Australia, Nike is the more trusted brand — but Adidas is the more visible one.
Adidas has 36% more products listed than Nike. Yet Nike leads in total reviews and average rating. This suggests Nike is winning on brand pull — customers actively seek it out — while Adidas is relying on volume and visibility to compete.
New Balance sits in the middle on product count but takes a completely different approach on pricing, which we’ll get to next.
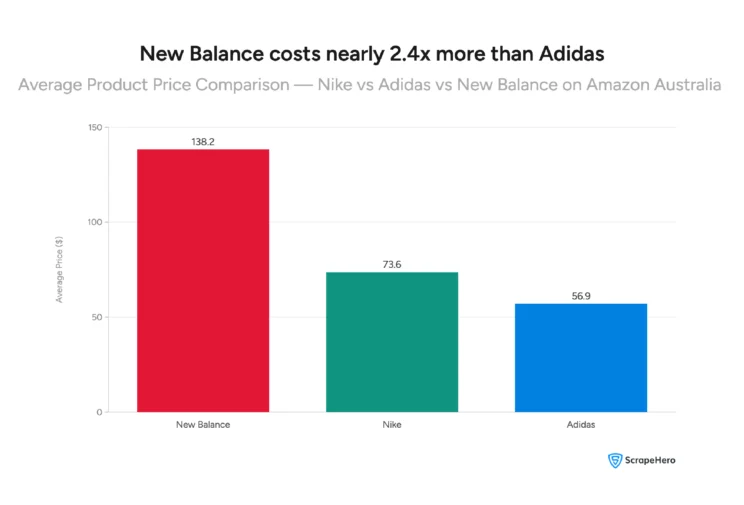
What Does Each Brand Actually Cost on Amazon Australia?
Price tells you a lot about how a brand positions itself. And on Amazon Australia, the three brands sit in very different price brackets.
- New Balance: $138.16 average price
- Nike: $73.56 average price
- Adidas: $56.94 average price
New Balance costs nearly 2.4x more than Adidas on average. That’s not a small gap — it’s a deliberate positioning choice.
For brands competing in this space, tracking how competitors price their products on Amazon is an ongoing challenge. ScrapeHero’s competitor pricing intelligence service makes that data continuously available.
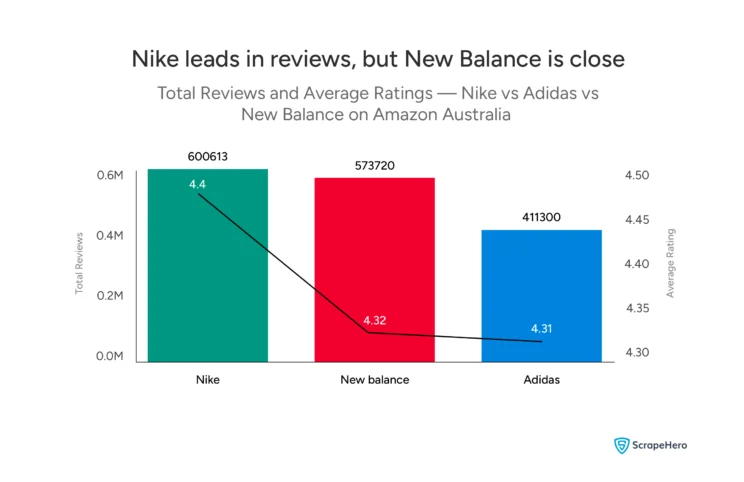
Customer Reviews and Ratings: Who Do Australians Actually Trust?
Nike leads on both review volume and average rating. But New Balance is closer than you’d expect.
Here’s how the three brands compare:
| Brand | Total Reviews | Average Rating |
| Nike | 600,613 | 4.44 |
| New Balance | 573,720 | 4.32 |
| Adidas | 411,300 | 4.31 |
What Do the Numbers Actually Say?
Nike is the most reviewed and highest rated brand on Amazon Australia — by a clear margin over Adidas, but a surprisingly narrow one over New Balance.
New Balance trails Nike by just 26,893 reviews and 0.12 rating points — despite listing 106 fewer products and charging nearly double the price. Customers paying a premium are still walking away satisfied.
Adidas, despite having the most products listed, has the fewest reviews and the lowest rating of the three. Volume of listings alone didn’t translate into customer engagement.
Tracking review volume and ratings across thousands of products isn’t something you can do manually at scale. ScrapeHero’s brand reputation monitoring service does exactly that — continuously and automatically.
Adidas vs New Balance vs Nike, How Each Brand Markets Itself on Amazon
On Amazon Australia, the three brands take very different approaches to visibility — and the contrast is sharp.
Here’s the sponsored vs non-sponsored breakdown:
| Brand | Non-Sponsored | Sponsored |
| Adidas | 306 | 93 |
| New Balance | 300 | 29 |
| Nike | 290 | 3 |
Nike Runs Almost No Ads — and Still Leads
Nike runs just 3 sponsored products on Amazon Australia. Adidas runs 93, 31x more than Nike.
Yet Nike still leads in reviews and ratings.
Adidas is taking the opposite approach. With 93 sponsored products, it is clearly investing in paid visibility to compete.
New Balance, with just 29 sponsored products, sits closer to Nike’s approach.
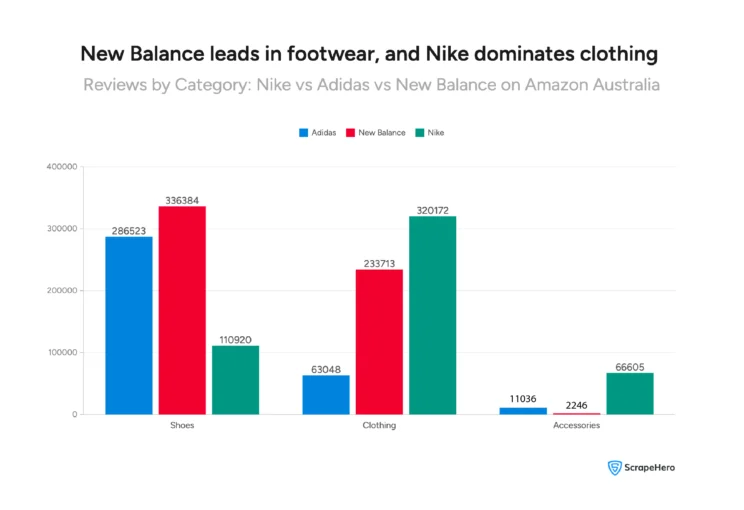
What Are the Most Popular Sports Brands in Australia by Category?
Each brand has carved out a distinct lane on Amazon Australia, and the review data by category makes that clear.
| Brand | Shoes | Clothing | Accessories |
| Adidas | 286,523 | 63,048 | 11,036 |
| New Balance | 336,384 | 233,713 | 2,246 |
| Nike | 110,920 | 320,172 | 66,605 |
- New Balance dominates footwear reviews (336K)
- Nike is strong across both shoes and clothing
What Does This Data Tell Us About Each Brand?
Here’s the short version:
- Nike is the most trusted brand on Amazon Australia — high ratings, most reviews, and almost no ad spend. Its brand does the work.
- Adidas is the most aggressive — most products, most ads, lowest prices. It is competing on volume and visibility.
- New Balance is the quiet premium challenger — fewer products, highest prices, and reviews that justify the cost.
Three brands. Three strategies. One growing market worth $10.91 billion by 2030.
Disclaimer: The data used in this report is sourced from publicly available information. This analysis has been produced independently by ScrapeHero and is not affiliated with, endorsed by, or produced in association with any of the brands mentioned in this report. All brand names are the property of their respective owners.
Want to Understand the Australian Market Better?
ScrapeHero is one of the top 3 web scraping services globally, and unlike most data services, we are fully managed. That means real experts handle your data requirements from start to finish, no technical expertise needed on your end.
In an age where AI drives most of the process, ScrapeHero keeps a human involved at every step, from the initial conversation about your requirements to manual QA before delivery. You get clean, structured, trustworthy data without having to chase it yourself.
Frequently Asked Questions About Nike vs Adidas vs New Balance in Australia
On Amazon Australia, Nike is more popular by customer trust — it leads in both total reviews (600,613) and average rating (4.44). Adidas, however, has a larger product presence with 399 listings compared to Nike’s 293. Popularity on Amazon depends on how you measure it: by customer satisfaction, Nike wins; by catalog size, Adidas leads.
Nike, Adidas, and New Balance are three active sportswear brands listed on Amazon Australia. Nike leads in customer ratings and review volume. Adidas leads in product listings. New Balance leads in average product price.
The data doesn’t make a definitive case either way. Nike has a higher average rating (4.44 vs 4.32) and more total reviews. But New Balance commands nearly double the average price and still earns strong customer ratings, which suggests its buyers are satisfied with what they’re paying for.
Based on Amazon Australia data, New Balance isn’t outperforming Nike overall — Nike still leads in ratings and reviews. But New Balance is performing strongly relative to its price point. It charges the most of the three brands and still maintains a 4.32 average rating, which is close to Nike’s 4.44.
The Australian activewear market was valued at $8.12 billion in 2024. It is projected to reach $10.91 billion by 2030, growing at a CAGR of 5.11%, according to Research and Markets.