Isn’t it interesting how the integration of geographic information systems (GIS) like QGIS with web scraping technologies can transform the way you visualize and analyze spatial data?
Indeed, web scraping allows you to automate the extraction of relevant location data from various web sources, enriching GIS datasets with updated and specific information for timely and accurate analyses.
By plotting this location data from a CSV file into QGIS, you can conduct detailed spatial analyses that reveal patterns and insights across multiple fields, ultimately enhancing decision-making.
This tutorial will provide step-by-step instructions on how to visualize CSV data to QGIS, turning basic location data from the ScrapeHero Data Store into interactive QGIS map points using the GIS software, QGIS.
What is QGIS?
QGIS, previously known as Quantum GIS, is a free, open-source Geographic Information System (GIS) software that helps create, edit, and visualize geospatial data.
It enables a wide range of different spatial data analyses using various tools and plugins available with QGIS.
Location Data for Visualization
You can use the store location dataset, Subway store locations in the USA, from the ScrapeHero Data Store.
This data contains each store’s Latitude and Longitude coordinates, which you can plot as points over a map. You can either download a sample CSV file or buy the complete data from the store.
By plotting location data in QGIS, you can better understand spatial relationships and gain valuable insights into your data.
Visualizing Point Data Over the Base Map
The easiest way to understand the store location data better is to plot CSV data as points on QGIS.
When you plot locations on a 2D surface, the points’ spatial relationships, such as their proximity to each other or aggregation, are easily understood.
Furthermore, when you plot points above a base map, you can attain more information about the data points by simple visual interpretation.
You can find out in which city the stores are located, the nearby towns, roads, lakes, or similar geographical features adjacent to the store, and more.
The steps to place the point data over the base map of a region/country are:
- Import the base map
- Import the CSV file downloaded from the ScrapeHero store as a point vector
- Edit the symbology and label
- Export the map from QGIS to an image or a PDF
1. Import the base map
The base map layer provides background details like roads, points of interest (POI), building footprints, rivers, etc.
You can use OpenStreetMaps (OSM) as your base map, as it is the default in QGIS. You can also use many other similar base maps like Google Maps, Mapbox, Bing Maps, etc.
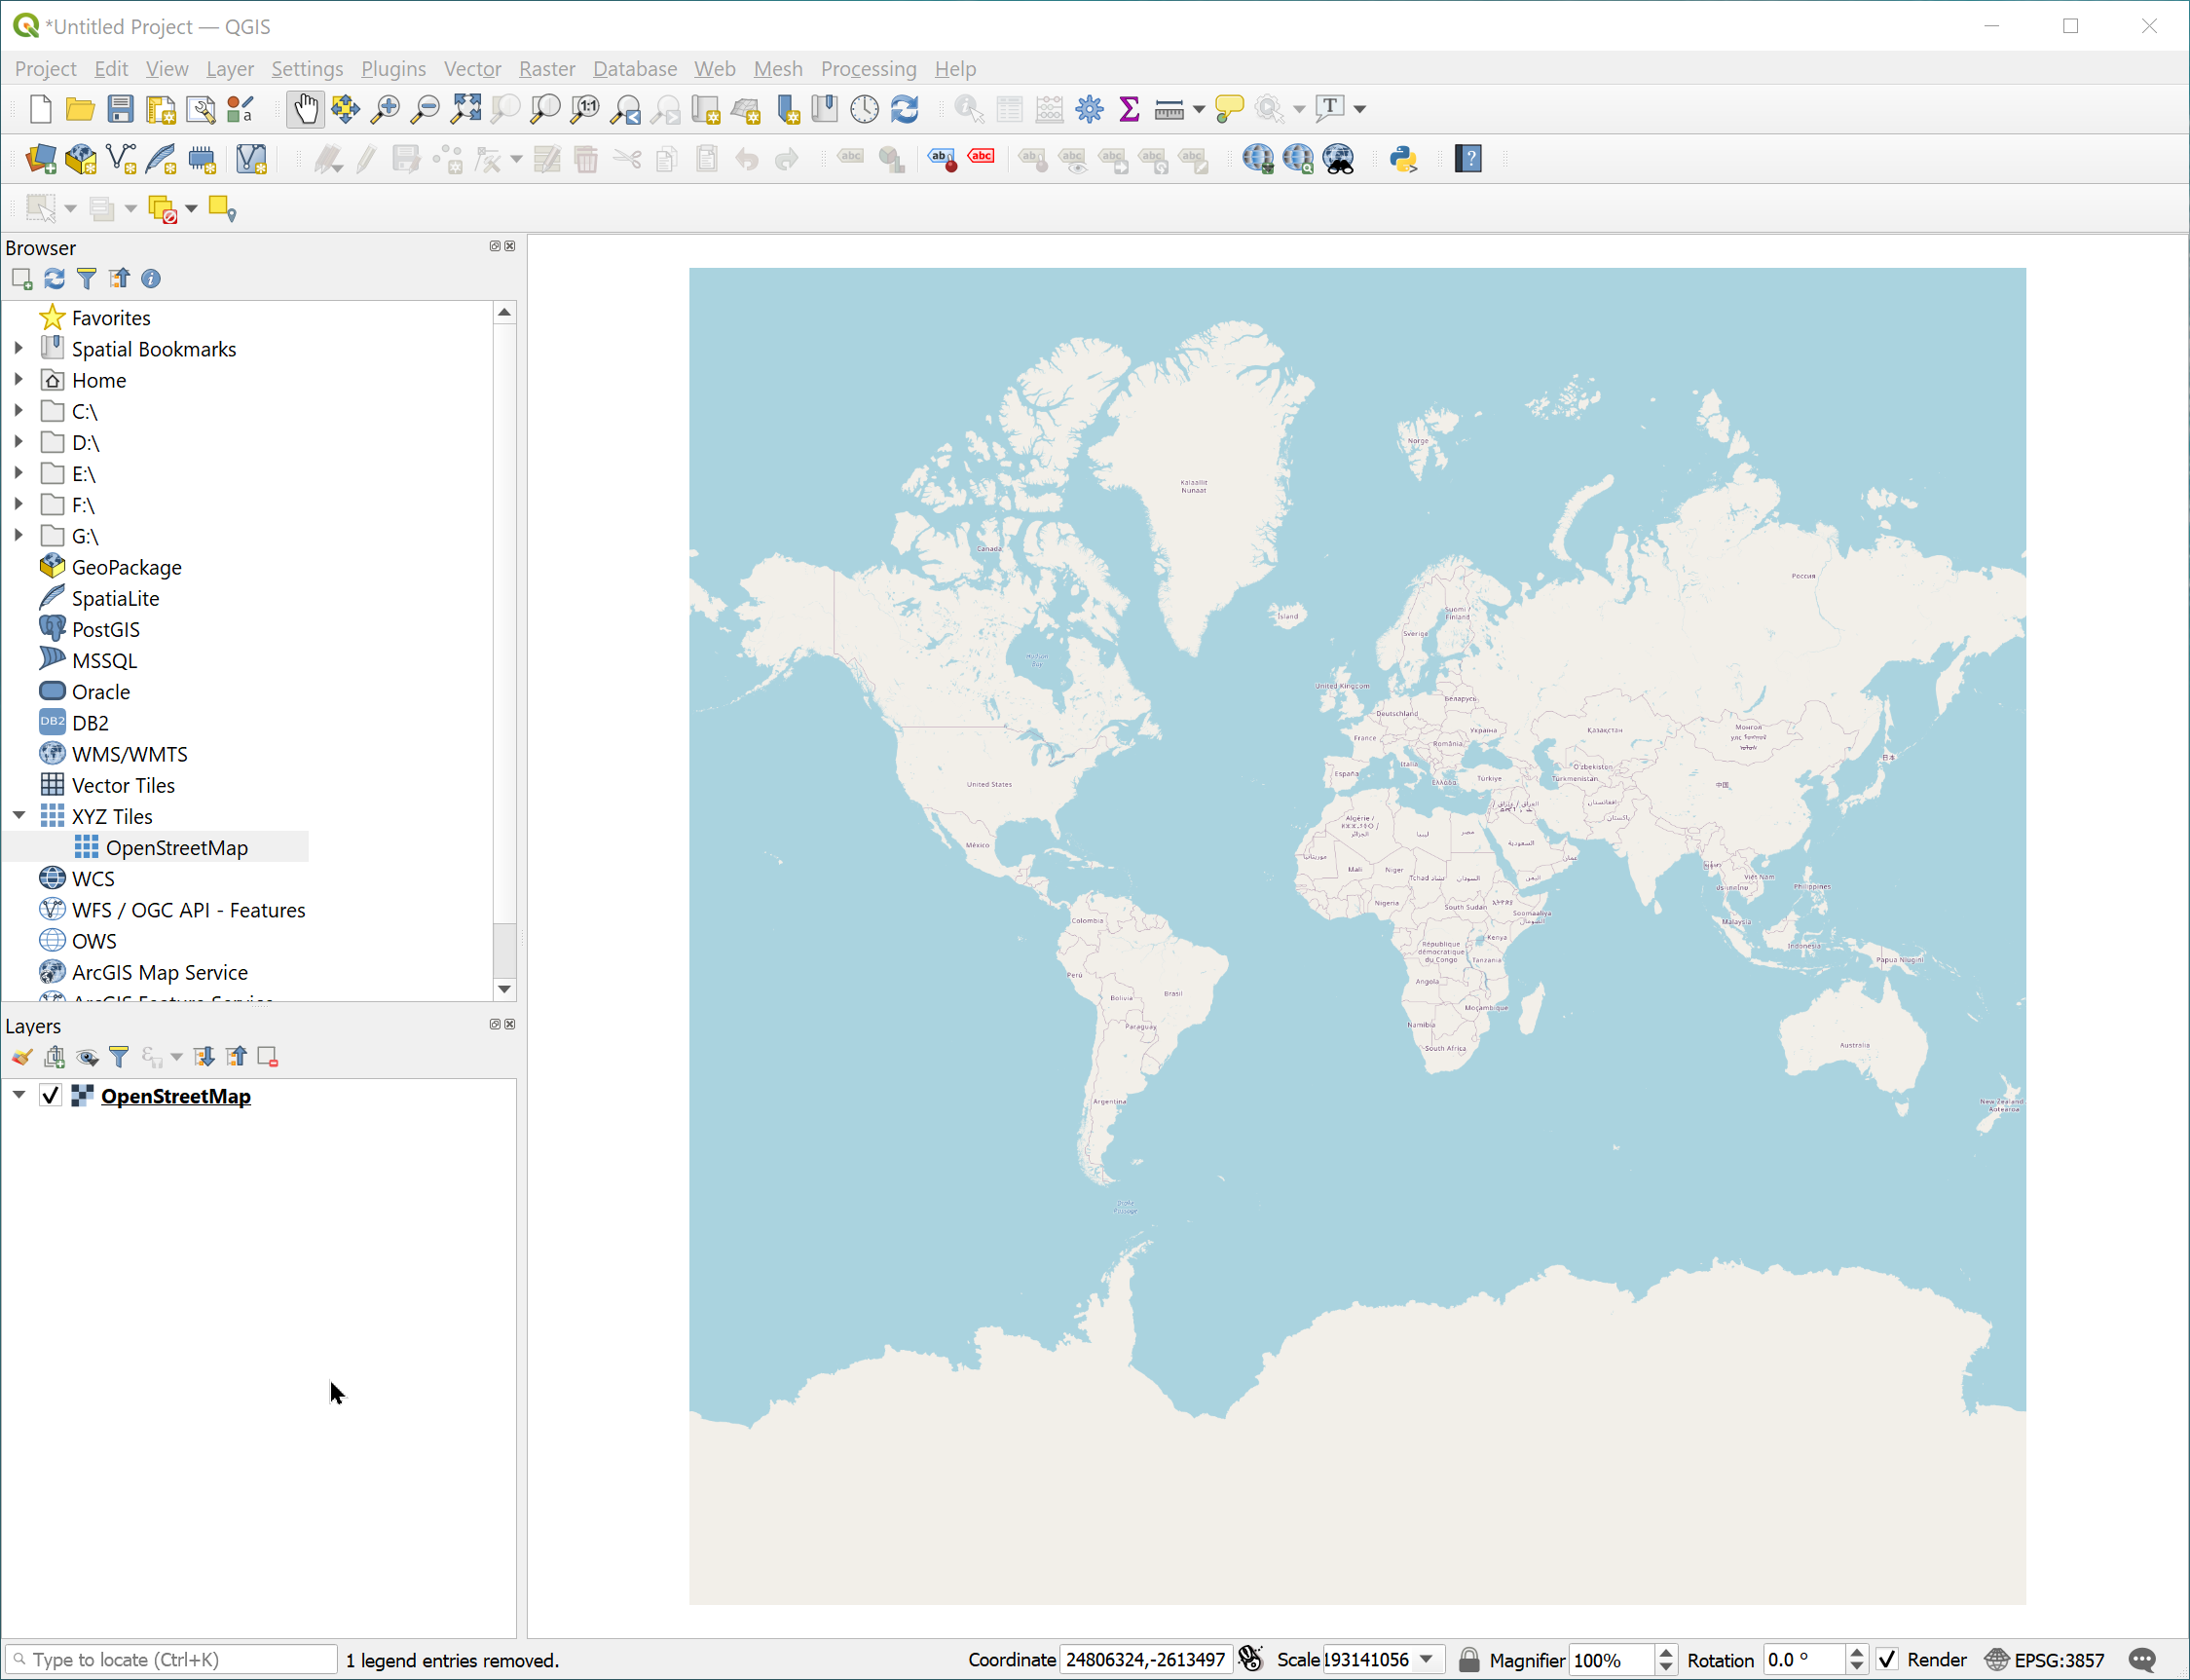
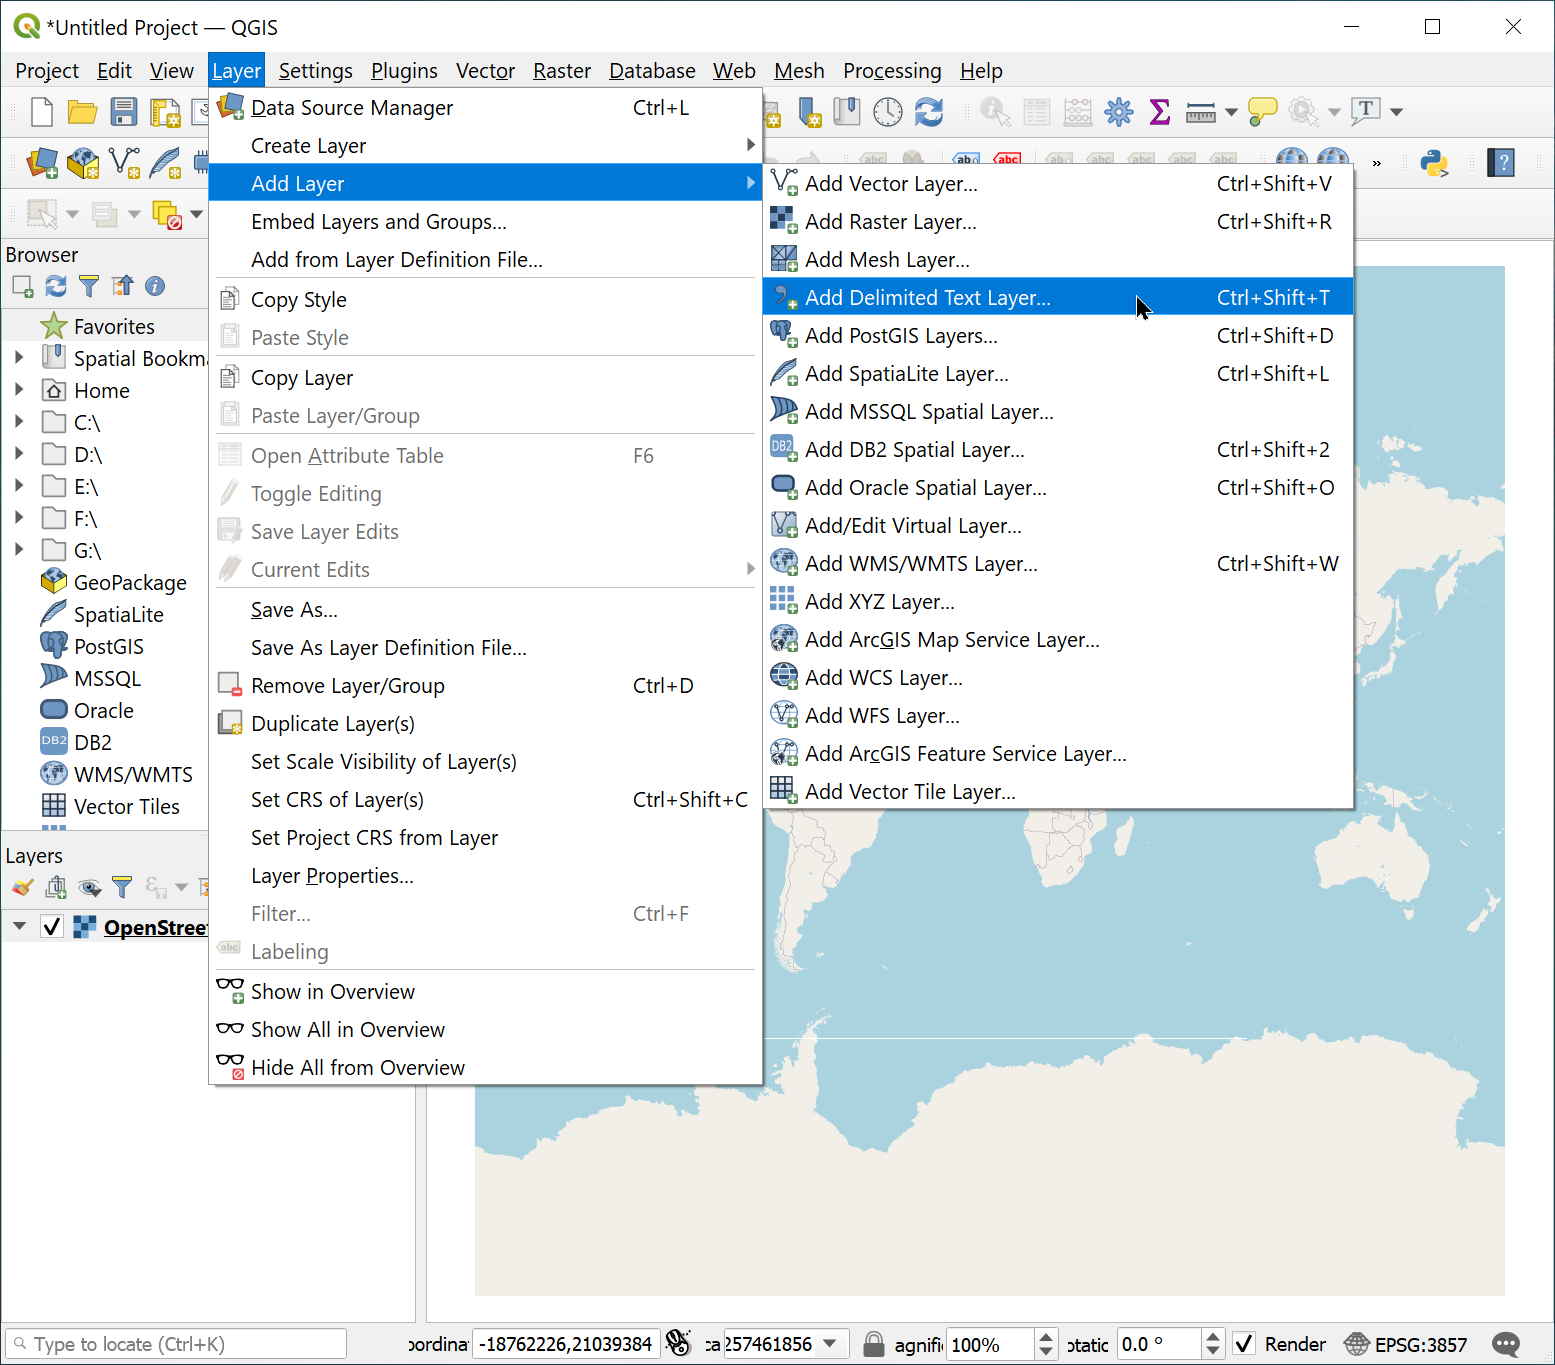
First, go to the Layers tab from the main toolbar, select Add Layer > Add XYZ Layer > Select OpenStreetMap > Add:
OSM is added as a layer in the QGIS layers tab and visible in the map canvas area.
2. Import the CSV File as a Point Vector
Once you add the base map, you need to import the store location data as a point vector layer.
Each record in the table has the fields Latitude and Longitude, based on which you can plot the points on the map.
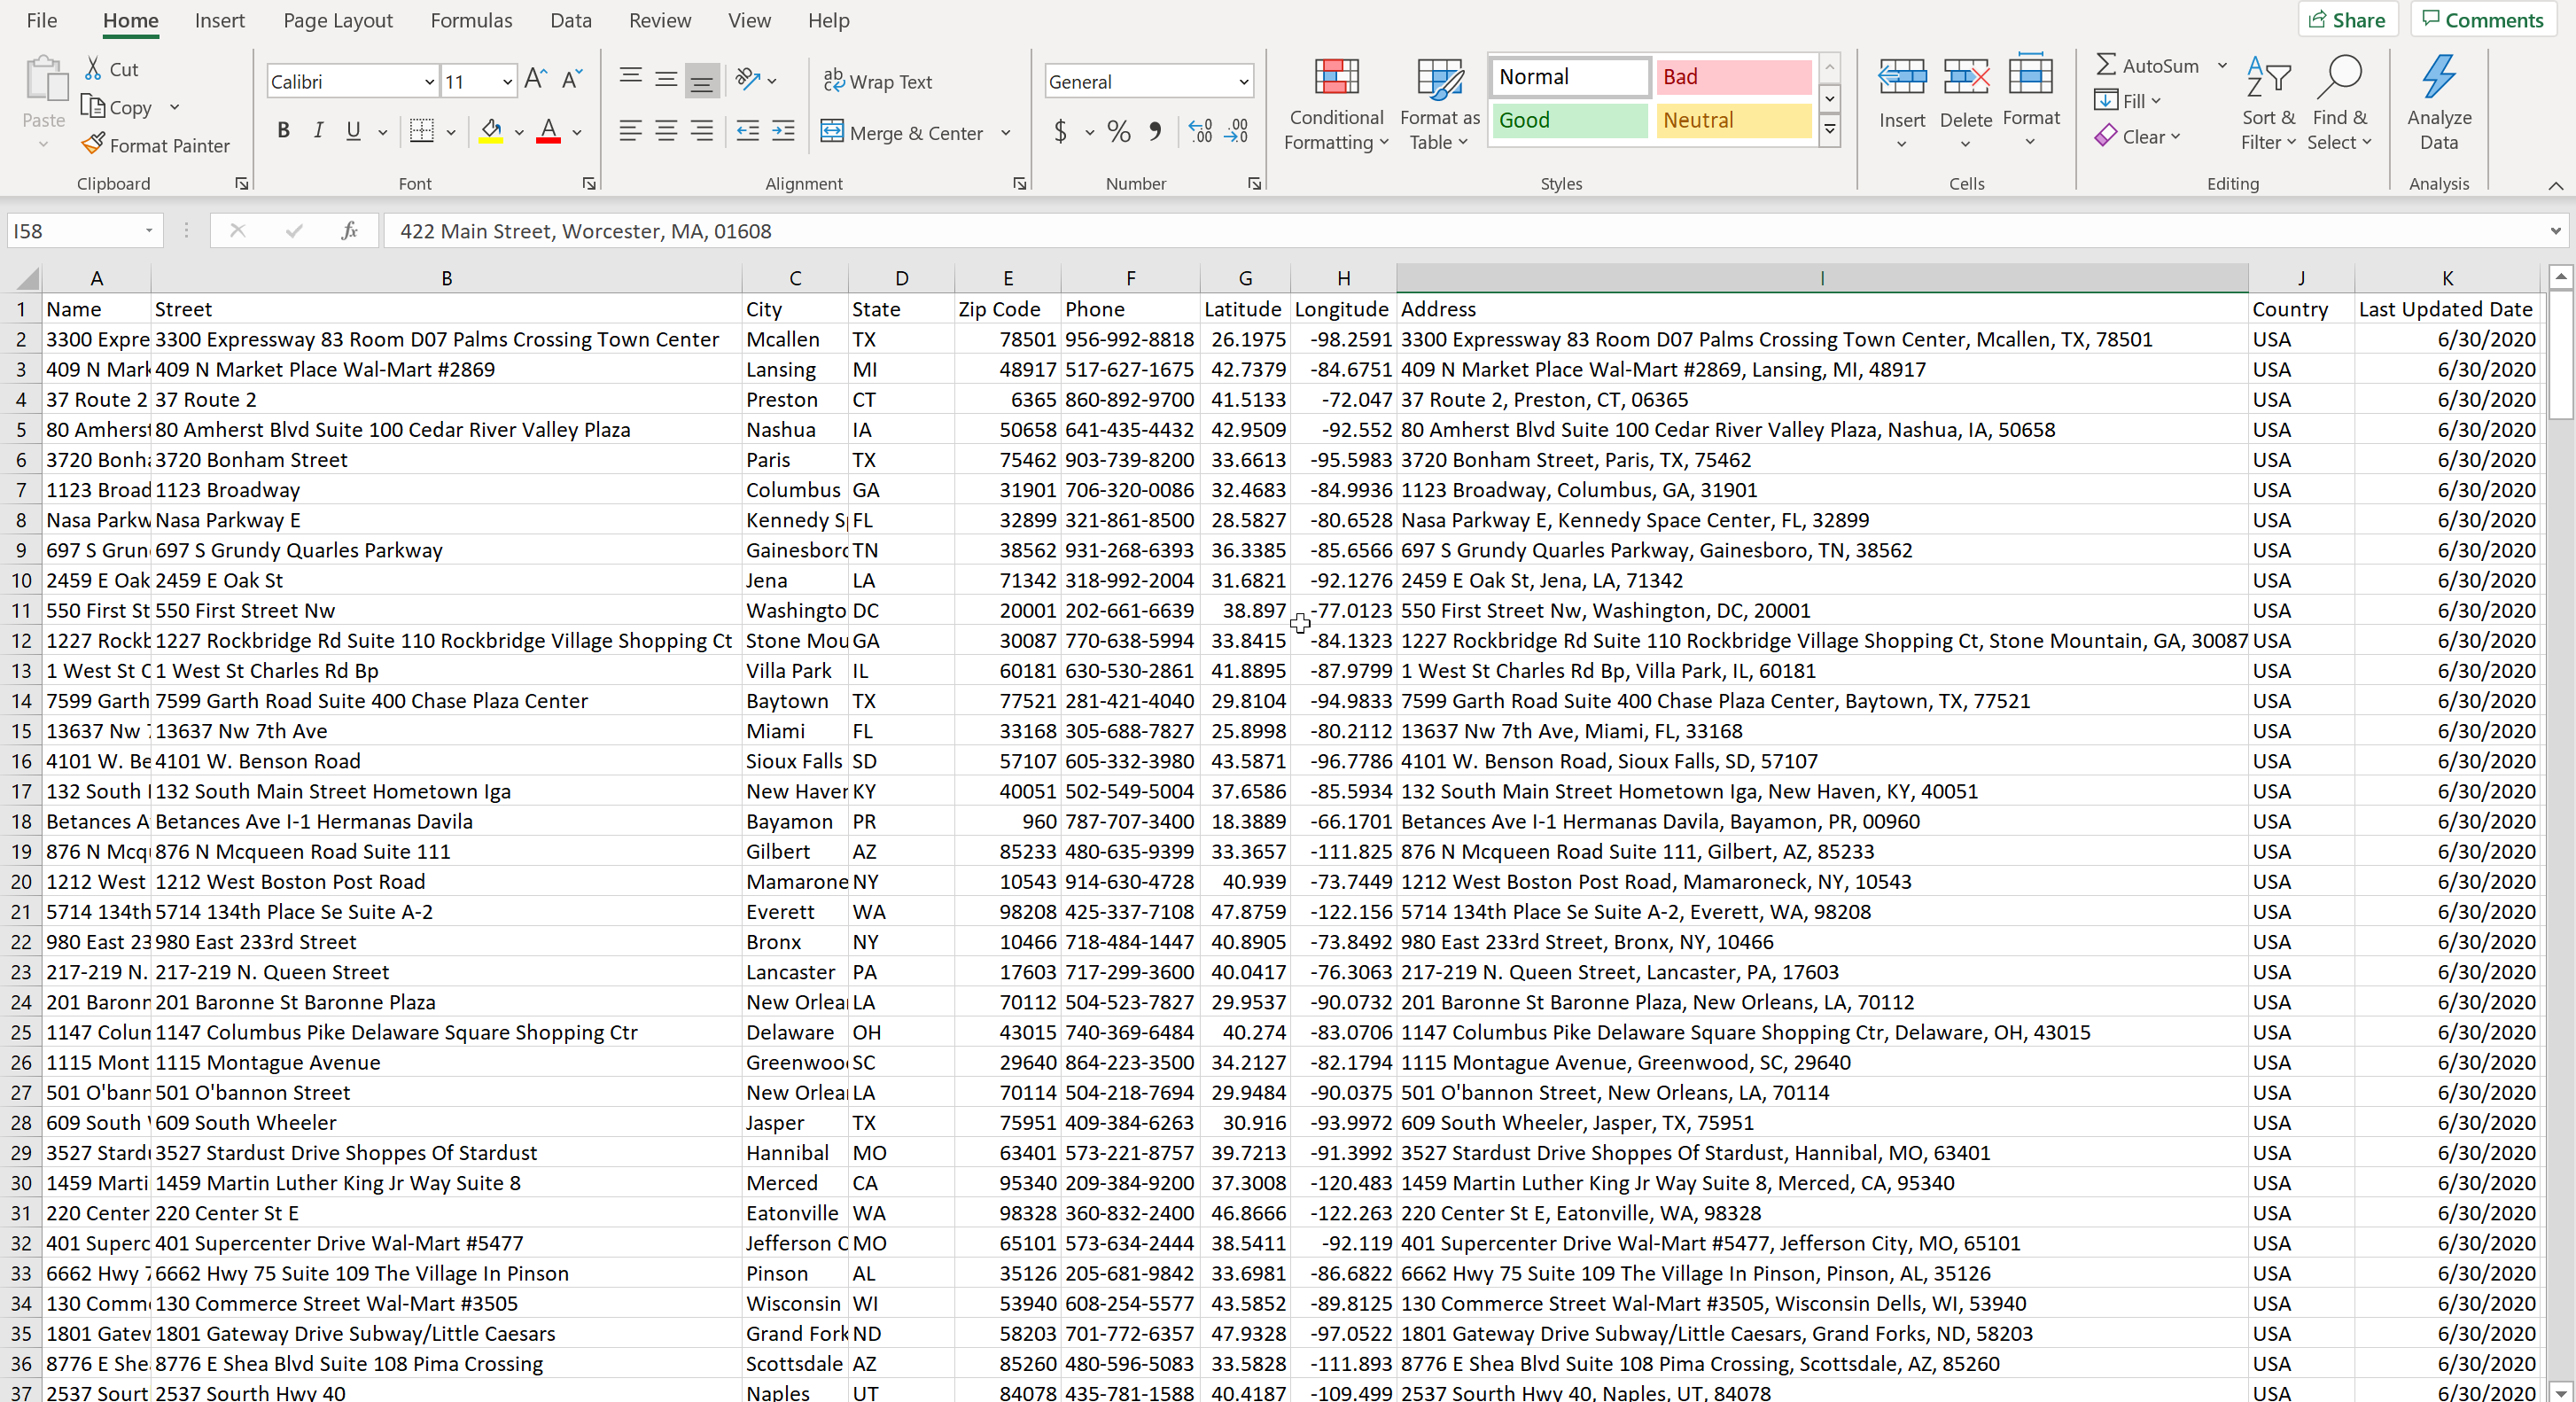
The Latitude and Longitude fields are the coordinates, and each record in the table will be added as a point vector.
Now, add a new ‘Delimited text layer’ and assign Longitude to the X coordinate and Latitude to the Y coordinate.
Go to the Layers tab from the main toolbar and select Add layer > Add Delimited Text Layer.
In the ‘Data Source Manager’ window that pops up, browse for the ScrapeHero CSV file as File name. Select the Longitude and Latitude as X field and Y field, respectively.
Also, select the respective Geometry CRS (coordinate reference system) based on the area or country used. For the United States, EPSG 4326 – WGS 84 is generally used.
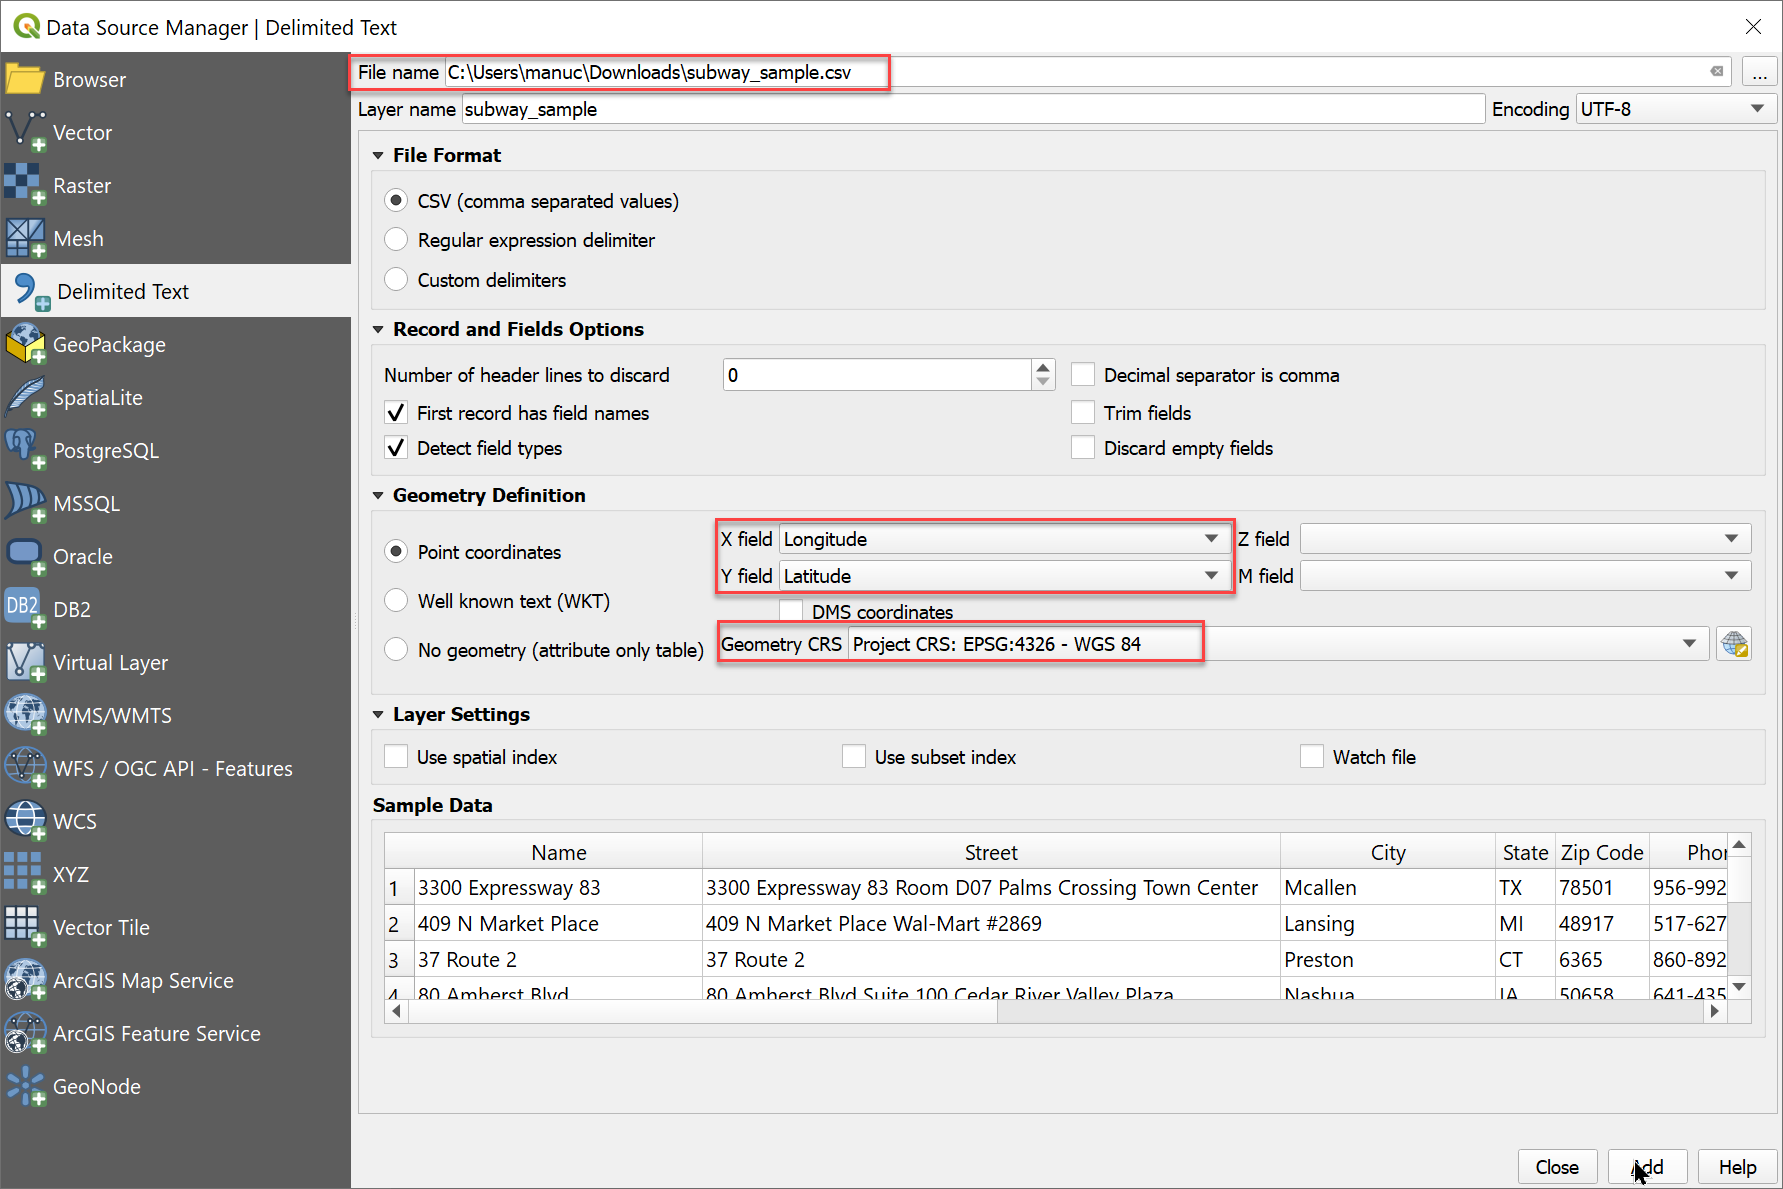
Clicking on the Add button should add many points as a layer of the store locations over the base map.
Right-click the point data layer, select the ‘Zoom to Layer’ option, and then pan the image to view as required:
3. Edit Symbology and Label
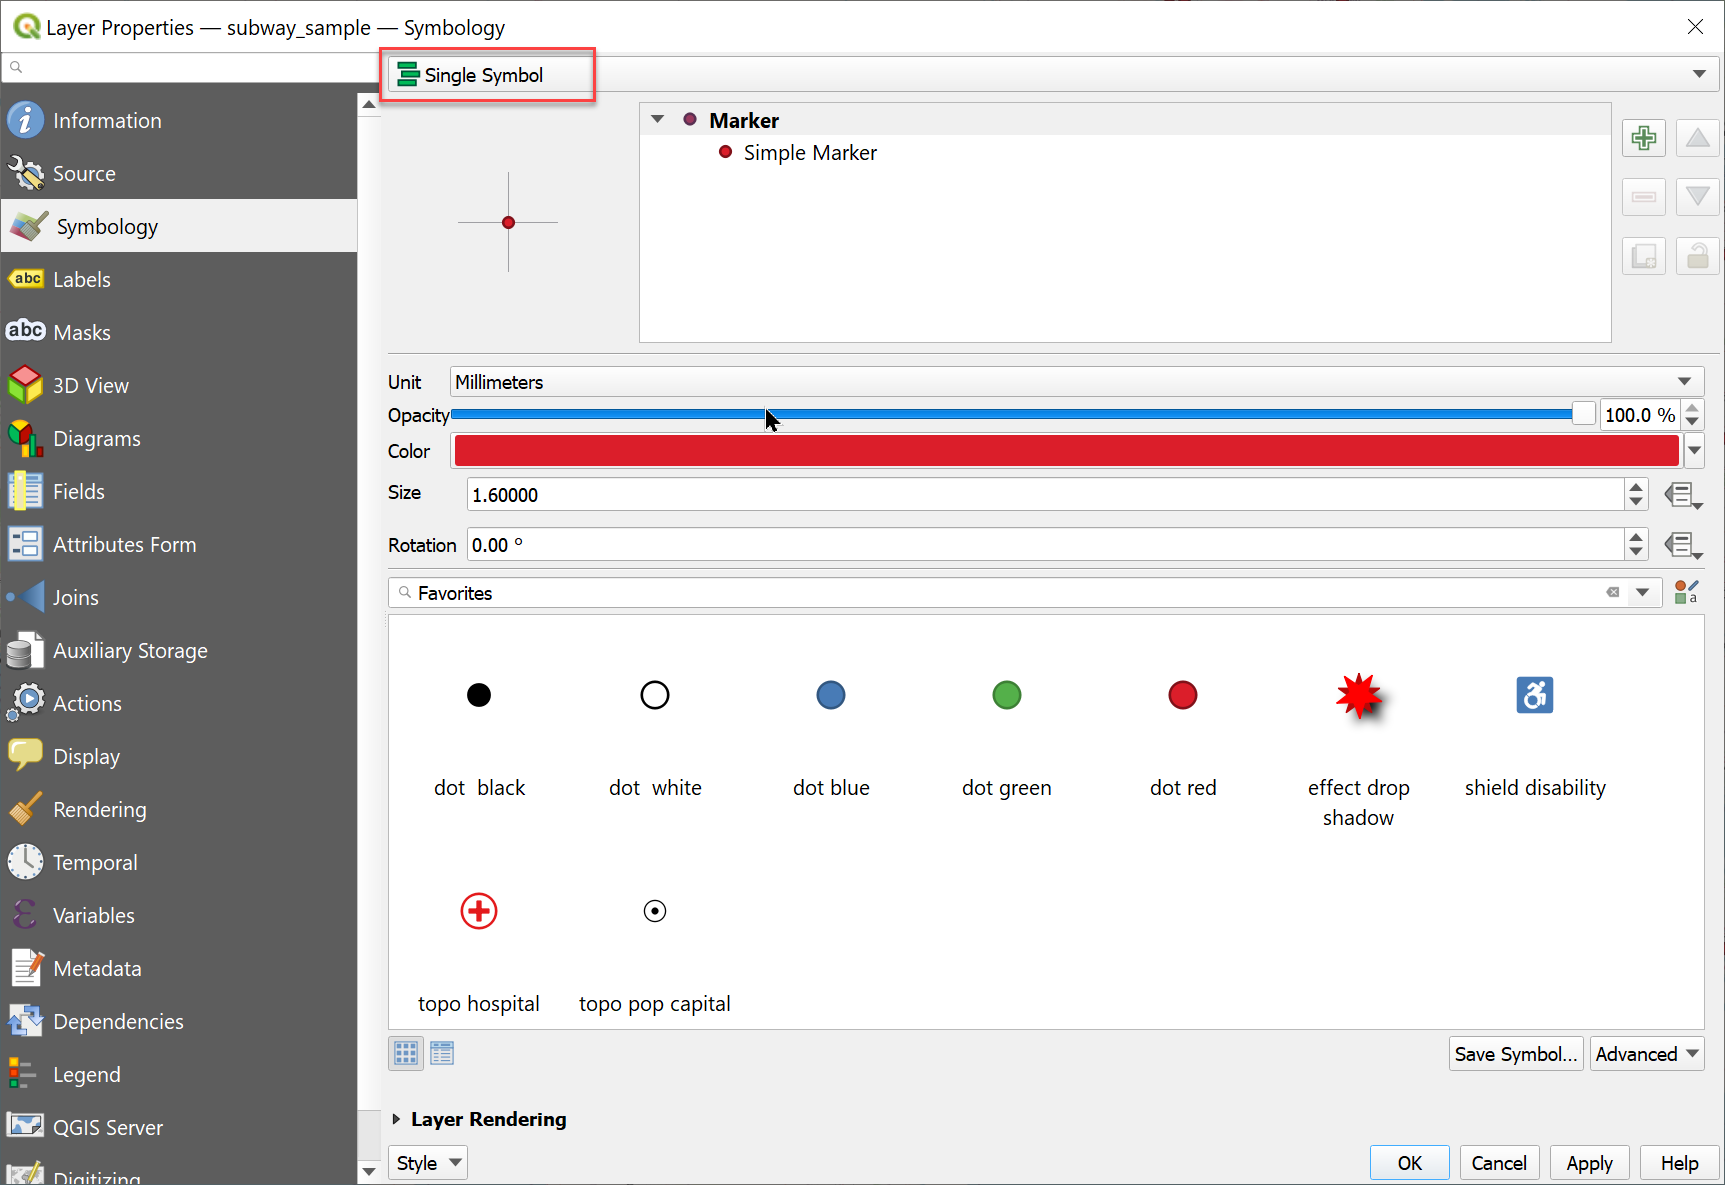
Next, edit the symbology of the point vector layer to make the map more elegant. Symbology here means the size, colors, shape, etc., of the symbols used for each point.
To do this, right-click the point data layer, select properties, and go to the Symbology tab.
From the symbology window, select the ‘Single Symbol’ option. Edit the size, color, and type of symbol to be used as required.
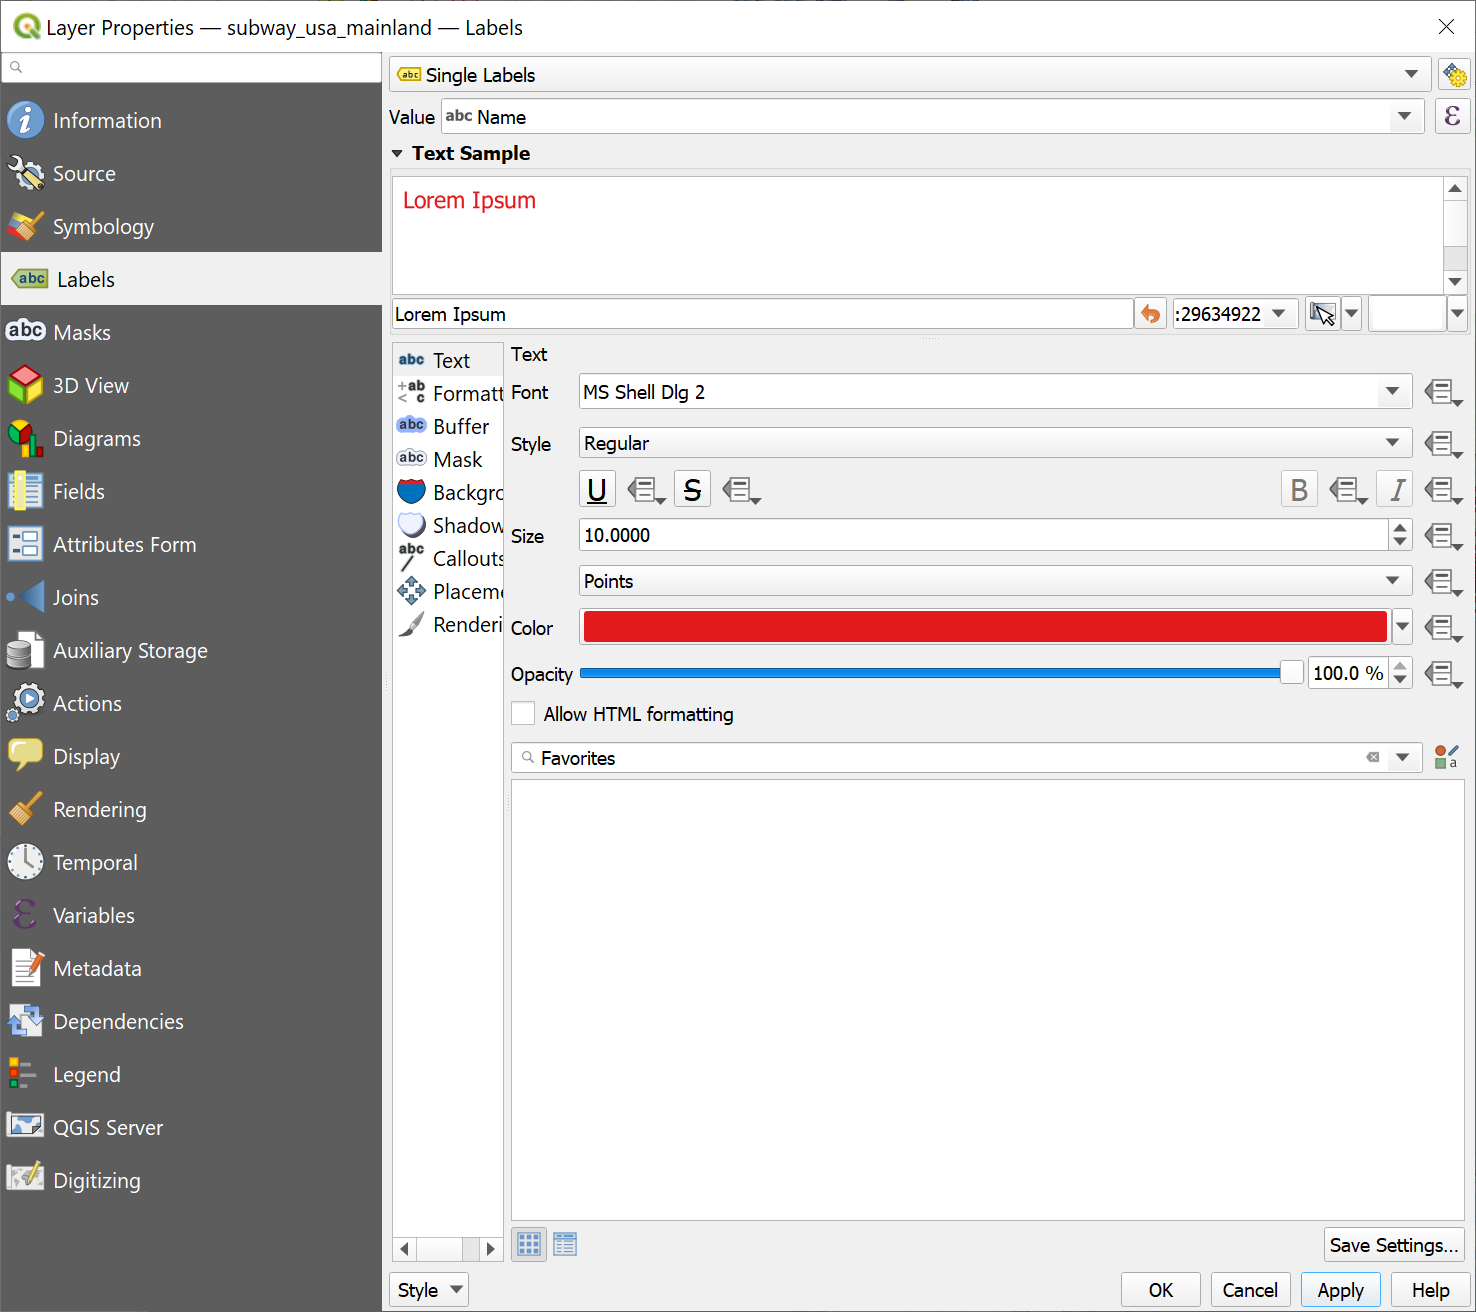
To give a label corresponding to each point data, right-click the point data layer, select properties, and go to the Label option.
Here, you can select the field to be added as the label and edit other properties of the label added.
Select ‘Single Labels‘ and then the ‘Value‘ field from the table as the label. Here, the ‘name’ of the store is labeled to correspond to each location.
Configure the font, font color, font size, opacity, and other attributes as you like.
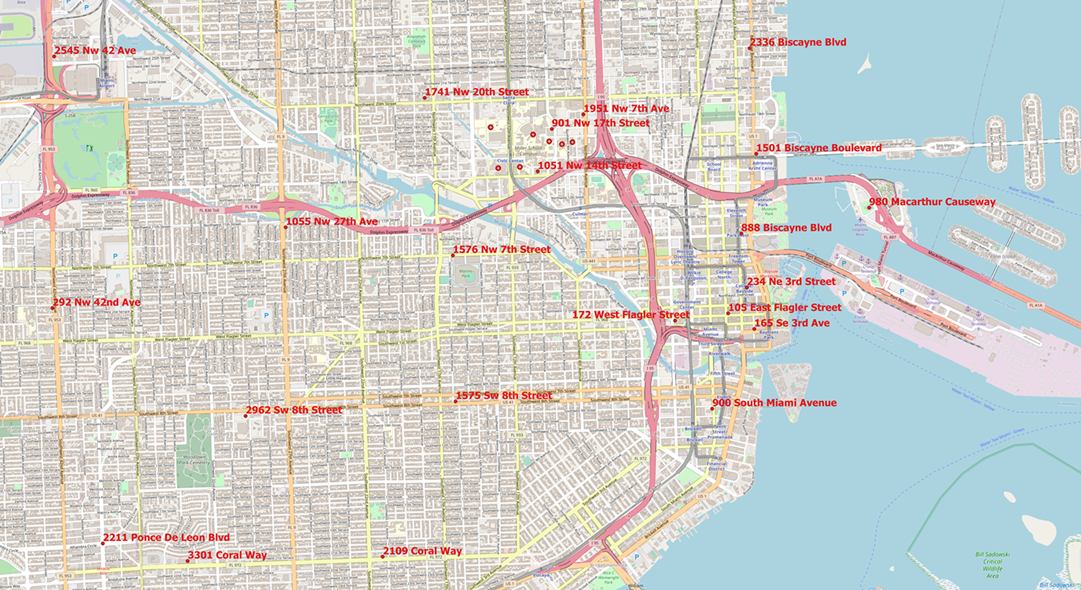
You will get the store location map after editing symbology and labels somewhat similar to this:
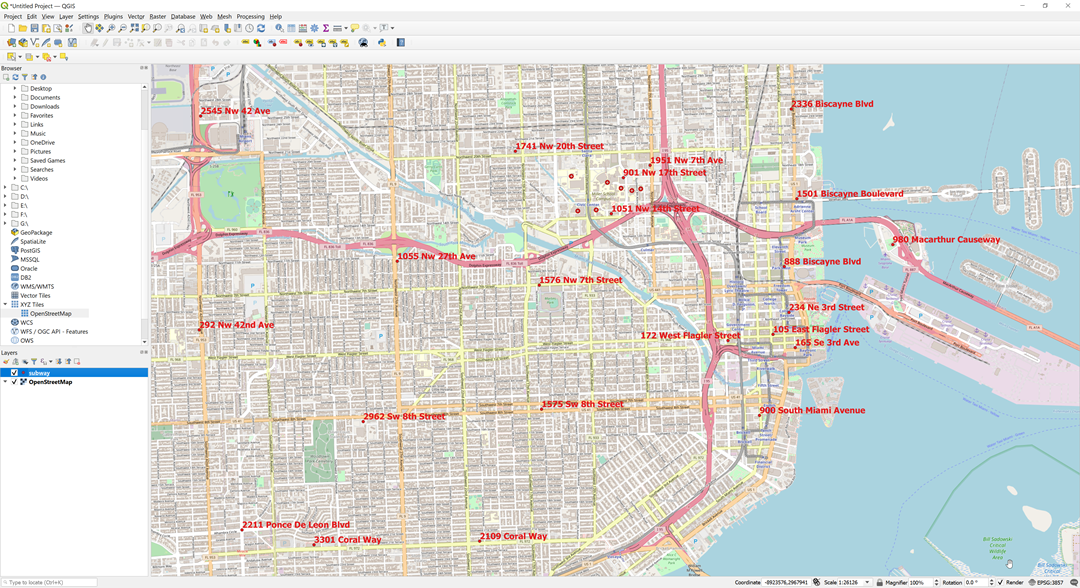
4. Export the Map as an Image or PDF
You can export the map viewed over the image canvas area of QGIS as a PDF or a PNG image.
Only a part of the whole map is exported here. To export the entire map, you can right-click the image layer and select the ‘Zoom to Layer‘ option. In that case, you can turn off the labels for a better appearance.
For now, you can export only a basic map without adding other map elements. You can add legends, scale, north arrows, and other map elements in QGIS if required.
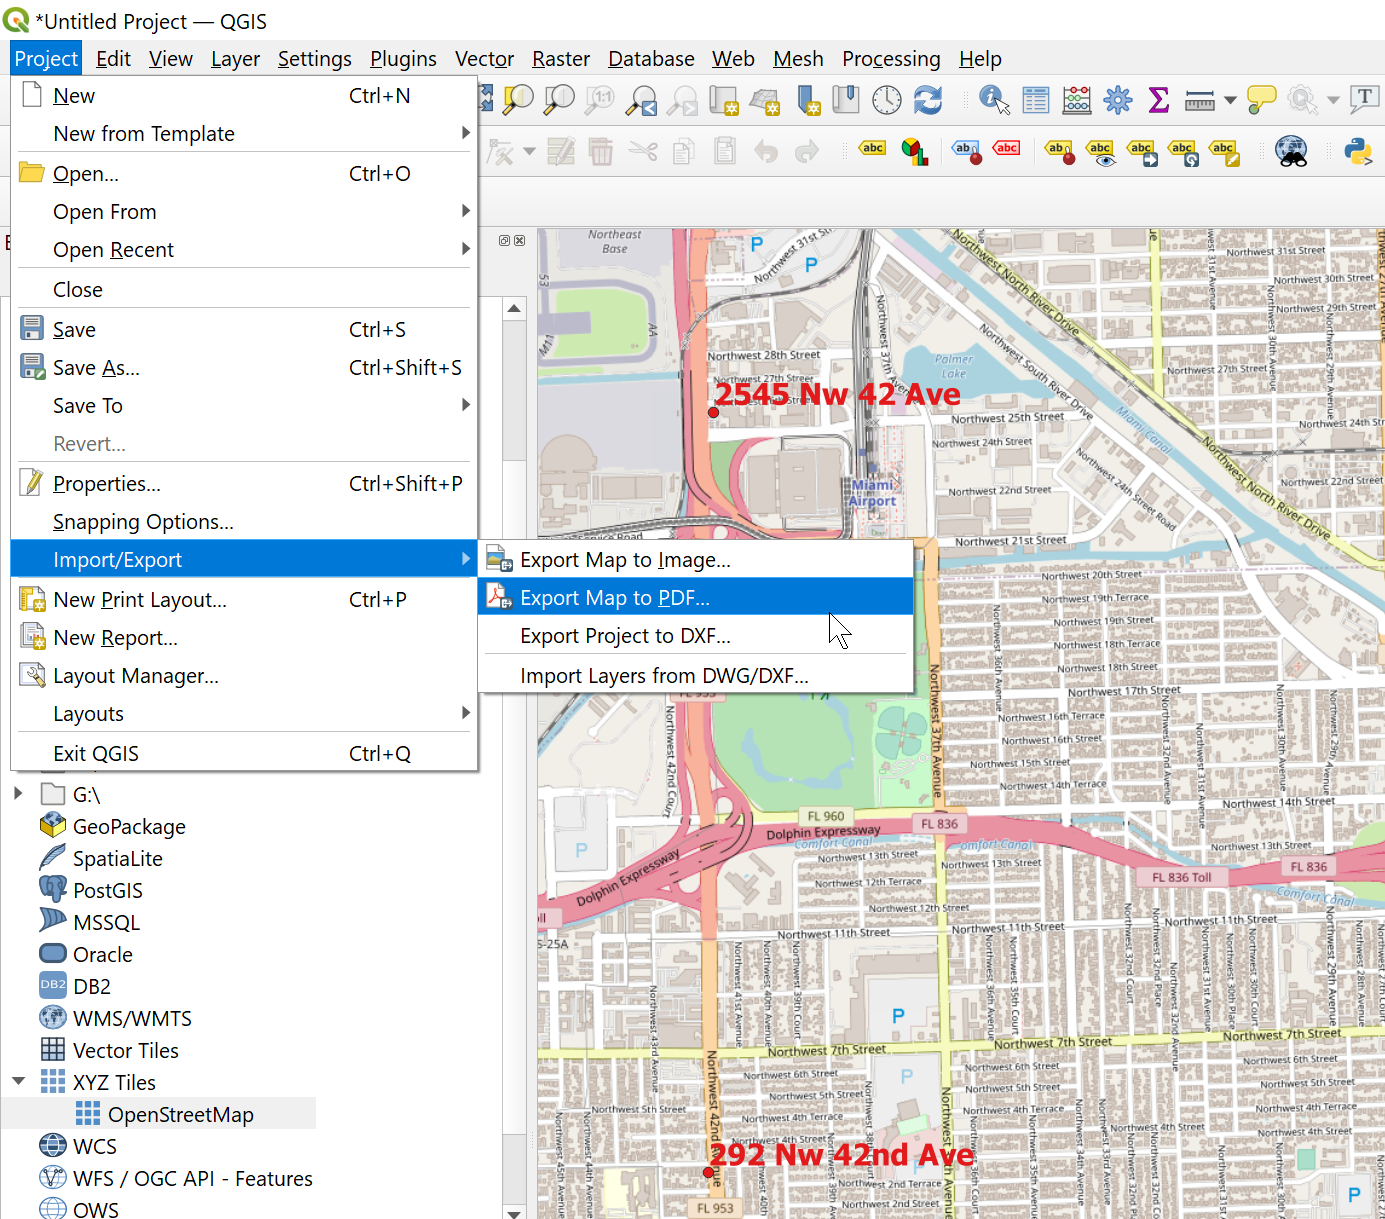
To export in PDF or PNG formats, first zoom in and pan the image over the canvas.
Go to Project> Import/Export > Export as Image for PNG format or Export as PDF to get the final map in PDF format.
ScrapeHero Data Store: Retail Store Location Data For Your Needs
If you are searching for reliable, accurate, and updated point-of-interest (POI) location data, ScrapeHero Data Store is an option to consider.
Our data store offers an extensive range of datasets covering thousands of brands and millions of locations globally, ensuring that users find the specific data they need for decision-making and strategic planning.
You can also opt for our data subscription plans to get unlimited access to regularly updated data for the brands you like to track and access the data on your schedule.
ScrapeHero Web Scraping Service for Your Specialized Needs
If you want a customized solution for your project, then we recommend the ScrapeHero web scraping service.
We are a fully managed, enterprise-grade solution that automates the entire data extraction process. This allows you to focus on analyzing the insights rather than worrying about the technicalities of scraping.
We can ensure your delivery of high-quality data through automated quality checks and customizing scraping options tailored to your specific requirements.
Our services are scalable, accommodating both small and large scraping needs, making us ideal for projects of any size.
Frequently Asked Questions
Import CSV data that contains coordinates into QGIS and use the Add Layer function to plot these as map points.
You can use the Layer menu to import your GPS data file as a new vector layer.
In QGIS, you can import a table with coordinate columns through the “Layer”> “Add Layer”> “Add Delimited Text Layer” option.
You can convert a CSV file to a shapefile in QGIS by importing the CSV as a layer, right-clicking the layer in the Layers panel, and selecting “Export”> “Save Features As” to choose the shapefile format.
Yes, you can automate plotting multiple CSV files on QGIS.
For this, you have to write Python scripts using the PyQGIS library, which allows you to load and plot data programmatically.
Some best practices for plotting map locations from a CSV file in QGIS are ensuring that the file is well-formatted with clear headers for latitude and longitude and verifying the coordinate reference system (CRS) for accuracy before plotting to avoid spatial discrepancies.
When plotting CSV data as points on QGIS, you may encounter incorrect point mapping due to mismatched CRS settings.
To overcome this, confirm that both your project and layer CRS settings align correctly with your data’s geographic scope.
We can help with your data or automation needs
Turn the Internet into meaningful, structured and usable data