
About the Report
We scraped Amazon US search results for 32 Halloween keywords every day from Oct 19 to 25, 2026. The data covers 13 decor keywords and 19 costume keywords, with 81,544 listing rows. If you sell, advertise or analyze on Amazon, these gaps affect how you price, bid and compete.
What You Will Learn
This post uses 81,544 listing rows scraped from Amazon US between Oct 19 and 25, 2026. It answers six questions about Halloween decor and costumes:
- How big is the listing pool? How many distinct products Amazon returns for 32 Halloween keywords, and how fast that pool changes.
- What do typical prices look like? Median sale price for each keyword.
- How much of page 1 is sponsored? The paid share of top results, by keyword.
- Which brands dominate? How concentrated decor and costume listings are.
- Did anything change during the week? Daily price, sponsored share and product counts.
- Where are demand signals strongest? Amazon’s “bought in past month” bands, by category and keyword.
Key Insights
- Costumes return more products than decor. 5,115 distinct products a day vs 3,364. Per keyword, both return about 300 unique listings a day.
- The product pool turns over fast. Only 6% of costume products and 14% of decor products appeared on all seven days.
- Price depends on the keyword. Medians run from $7.99 (window clings) to $46.07 (inflatables).
- Paid placement is similar. Sponsored listings hold 11.7% of costume and 11.8% of decor page 1 spots.
- Two brands lead costumes. Spooktacular Creations and Rubies hold 12.7% of costume products. The top decor brand, JOYIN, holds 3.2%.
- The week was stable. Median price and sponsored share barely moved.
- Decor shows stronger demand bands. 32.6% of decor listings show a 1K+ “bought in past month” band vs 17.7% of costume listings.
How Big is the Halloween Listing Pool on Amazon US?
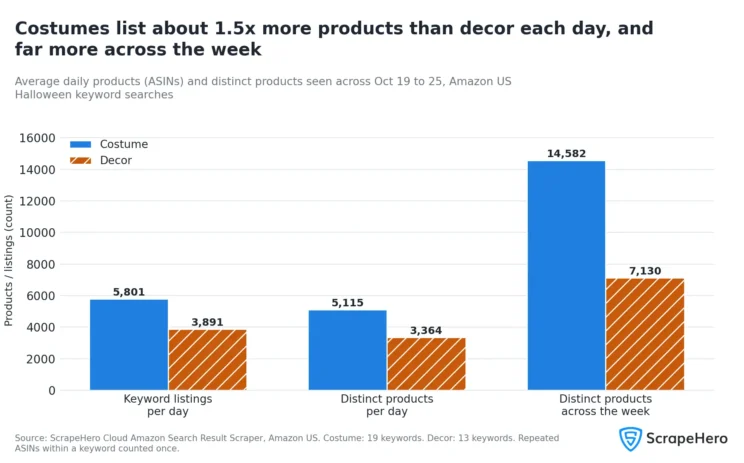
Costume searches return about 1.5 times as many distinct products as decor searches each day: 5,115 vs 3,364. Most of that gap comes from keyword count. We tracked 19 costume keywords and 13 decor keywords, and each keyword returned about 300 unique listings a day (305 for costumes, 299 for decor).
The pool also changes through the week. Across seven days, the data holds 14,582 distinct costume products and 7,130 distinct decor products. That is 2.9 times and 2.1 times the daily figures. Across both categories, there are 21,663 distinct products, and 49 of them appear in both costume and decor results.
| Measure | Costume | Decor |
|---|---|---|
| Keywords tracked | 19 | 13 |
| Raw rows, 7 days | 48,573 | 32,971 |
| Keyword listings per day (average) | 5,801 | 3,891 |
| Distinct products per day (average) | 5,115 | 3,364 |
| Distinct products across the week | 14,582 | 7,130 |
| Unique listings per keyword per day (average) | 305 | 299 |
Note: Keyword listings count each product once per keyword and day. Distinct products count each product once per day across all keywords in the category. Each keyword returns up to about 390 results, so these counts show what Amazon returned for these searches, not the size of the whole Halloween market.
- Turnover is high. On average, 53% of a day’s costume products and 66% of its decor products also appeared the day before.
- Few products stay all week. Only 886 costume products and 1,010 decor products appeared on all seven days.
What Do Typical Prices Look Like for Each Halloween Keyword?
The median sale price depends mostly on the keyword. It runs from $7.99 for halloween window clings to $46.07 for halloween inflatables. Averaged across keywords, the daily median is $24.92 for costumes and $19.12 for decor.
In costumes, 15 of 19 keywords have medians between $22 and $32 from baby halloween costume ($22.05) to inflatable costume ($31.72). Four sit lower: costume accessories ($9.84), makeup kit ($11.26), wig ($15.59) and dog costume ($17.06). In decor, inflatables ($46.07) and giant skeleton decoration ($38.82) sit at the top. Window clings ($7.99) and tablecloths ($10.56) sit at the bottom.
These gaps reflect what each keyword sells. The data does not show pricing strategy.
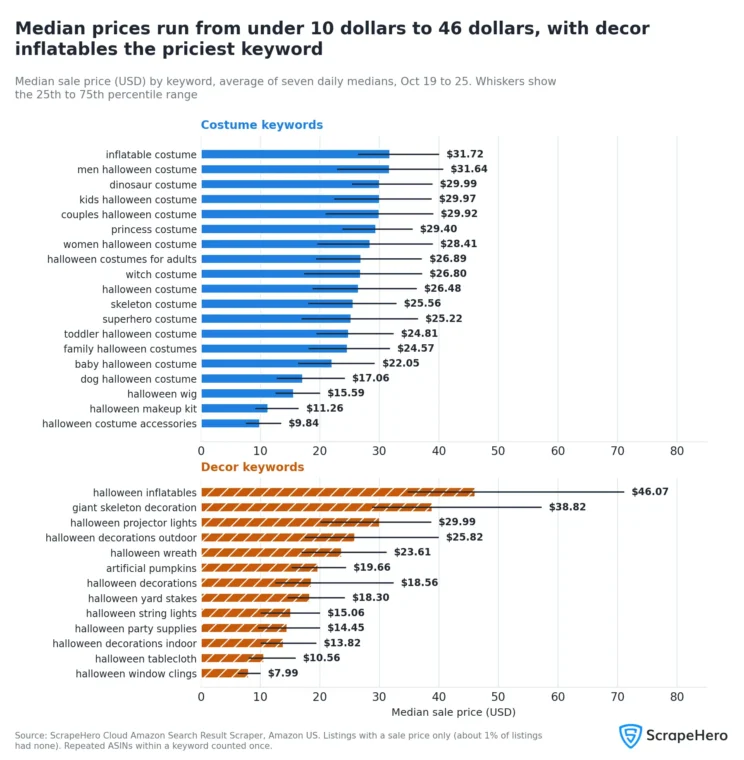
| Category | Keyword | Median Price | 25th to 75th Percentile |
|---|---|---|---|
| Costume | inflatable costume | $31.72 | $26.41 to $39.98 |
| Costume | men halloween costume | $31.64 | $22.87 to $40.66 |
| Costume | dinosaur costume | $29.99 | $25.37 to $38.90 |
| Costume | kids halloween costume | $29.97 | $22.36 to $38.74 |
| Costume | couples halloween costume | $29.92 | $20.88 to $39.03 |
| Costume | princess costume | $29.40 | $23.75 to $35.56 |
| Costume | women halloween costume | $28.41 | $19.50 to $38.98 |
| Costume | halloween costumes for adults | $26.89 | $19.28 to $37.11 |
| Costume | witch costume | $26.80 | $17.32 to $37.13 |
| Costume | halloween costume | $26.48 | $18.74 to $36.26 |
| Costume | skeleton costume | $25.56 | $18.00 to $32.81 |
| Costume | superhero costume | $25.22 | $16.91 to $36.44 |
| Costume | toddler halloween costume | $24.81 | $19.40 to $32.34 |
| Costume | family halloween costumes | $24.57 | $18.05 to $31.75 |
| Costume | baby halloween costume | $22.05 | $16.34 to $29.20 |
| Costume | dog halloween costume | $17.06 | $12.71 to $24.14 |
| Costume | halloween wig | $15.59 | $12.52 to $19.99 |
| Costume | halloween makeup kit | $11.26 | $9.13 to $16.42 |
| Costume | halloween costume accessories | $9.84 | $7.51 to $13.45 |
| Decor | halloween inflatables | $46.07 | $34.68 to $71.10 |
| Decor | giant skeleton decoration | $38.82 | $28.75 to $57.24 |
| Decor | halloween projector lights | $29.99 | $20.05 to $38.70 |
| Decor | halloween decorations outdoor | $25.82 | $17.42 to $39.95 |
| Decor | halloween wreath | $23.61 | $16.89 to $31.16 |
| Decor | artificial pumpkins | $19.66 | $15.18 to $24.35 |
| Decor | halloween decorations | $18.56 | $12.45 to $32.35 |
| Decor | halloween yard stakes | $18.30 | $14.54 to $24.13 |
| Decor | halloween string lights | $15.06 | $9.99 to $19.99 |
| Decor | halloween party supplies | $14.45 | $9.57 to $19.99 |
| Decor | halloween decorations indoor | $13.82 | $9.99 to $19.34 |
| Decor | halloween tablecloth | $10.56 | $7.99 to $15.88 |
| Decor | halloween window clings | $7.99 | $6.15 to $9.99 |
Note: Each figure is the median sale price of unique listings with a price, calculated for each keyword and day, then averaged over seven days. The percentile range is also averaged over seven days. Less than 1% of listings (511 of 67,840) had no sale price and are excluded here. A few listings cost thousands of dollars, which is why we use medians.
- Prices reflect the item type. Low-cost items such as accessories, makeup kits and window clings sit at the bottom. Large items such as inflatables and giant skeletons sit at the top.
- The middle range is wide. The 25th to 75th percentile spans $10 or more for 23 of 32 keywords, so one median hides a lot of variation.
How Much of Page 1 is Sponsored on Amazon US?
About 1 in 9 page 1 listings is sponsored: 11.7% for costumes and 11.8% for decor. The share by keyword is wide, from 5.6% for halloween string lights to 17.5% for skeleton costume and artificial pumpkins.
Page 1 is not always the most paid-heavy page. It has a higher sponsored share than pages 2 to 7 for 10 of 19 costume keywords and 7 of 13 decor keywords. For the others, later pages carry an equal or higher share.
Page 1 holds about 53 unique listings per keyword and day on average (range 45 to 60). One listing moves a keyword’s share by about 2 points, so treat small gaps with care.

| Category | Keyword | Page 1 sponsored share | Pages 2 to 7 sponsored share |
|---|---|---|---|
| Costume | skeleton costume | 17.5% | 9.7% |
| Costume | kids halloween costume | 17.1% | 12.0% |
| Costume | halloween costumes for adults | 16.6% | 10.8% |
| Costume | dog halloween costume | 14.2% | 9.1% |
| Costume | baby halloween costume | 14.2% | 11.1% |
| Costume | couples halloween costume | 11.8% | 11.5% |
| Costume | inflatable costume | 11.7% | 7.5% |
| Costume | witch costume | 11.4% | 10.8% |
| Costume | men halloween costume | 11.3% | 11.9% |
| Costume | halloween costume | 11.1% | 11.2% |
| Costume | halloween makeup kit | 9.5% | 7.8% |
| Costume | halloween costume accessories | 8.7% | 11.4% |
| Costume | women halloween costume | 8.6% | 13.3% |
| Costume | dinosaur costume | 8.5% | 8.0% |
| Costume | princess costume | 8.5% | 10.8% |
| Costume | family halloween costumes | 5.9% | 10.4% |
| Costume | superhero costume | 5.8% | 10.1% |
| Costume | toddler halloween costume | 5.8% | 11.2% |
| Costume | halloween wig | 5.8% | 9.7% |
| Decor | artificial pumpkins | 17.5% | 9.4% |
| Decor | halloween yard stakes | 17.3% | 8.4% |
| Decor | halloween decorations indoor | 14.7% | 8.8% |
| Decor | halloween decorations outdoor | 14.6% | 10.7% |
| Decor | halloween wreath | 11.6% | 6.8% |
| Decor | halloween inflatables | 11.2% | 8.5% |
| Decor | halloween decorations | 10.7% | 11.2% |
| Decor | halloween window clings | 9.2% | 7.3% |
| Decor | giant skeleton decoration | 8.9% | 9.2% |
| Decor | halloween tablecloth | 8.8% | 9.4% |
| Decor | halloween party supplies | 5.7% | 9.6% |
| Decor | halloween projector lights | 5.7% | 8.6% |
| Decor | halloween string lights | 5.6% | 8.1% |
Note: Sponsored listings divided by unique listings for each keyword, day and page group, averaged over seven days. A product shown more than once in a keyword counts once, at its best rank, and takes the sponsored flag of that row. Sponsored status is the label shown at scrape time.
- Costume leaders: Skeleton costume, kids halloween costume and halloween costumes for adults have the highest page 1 shares (17.5%, 17.1% and 16.6%).
- Decor leaders: Artificial pumpkins and halloween yard stakes lead decor (17.5% and 17.3%).
- Some keywords run the other way: For women halloween costume, family halloween costumes and halloween party supplies, pages 2 to 7 carry a higher sponsored share than page 1.
Which Brands Dominate Halloween Decor and Costumes?
Costumes are more concentrated. Spooktacular Creations (7.0%) and Rubies (5.7%) hold 12.7% of distinct costume products, and the top 10 costume brands hold 23.4%. In decor, JOYIN leads with 3.2%, and the top 10 brands hold 9.0%.
Both categories have a long tail. On an average day, 1,909 brand labels appear in costume results and 1,796 in decor results. About 62% of costume brand labels and 68% of decor brand labels list a single product that day.
For sellers, this means a costume newcomer competes against two names with large catalogs. A decor newcomer faces a more open field. The data shows listing share only, so it cannot say which brands win sales.
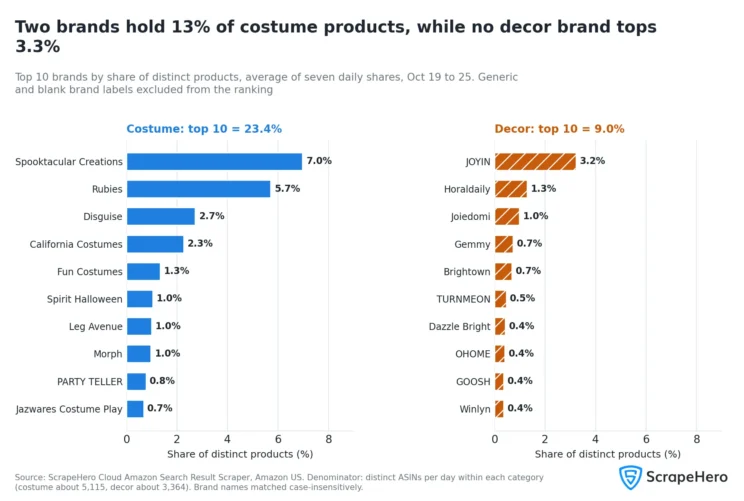
Costume
| Rank | Brand | Avg distinct products per day | Share of category |
|---|---|---|---|
| 1 | Spooktacular Creations | 356.4 | 7.0% |
| 2 | Rubies | 292.3 | 5.7% |
| 3 | Disguise | 138.9 | 2.7% |
| 4 | California Costumes | 115.4 | 2.3% |
| 5 | Fun Costumes | 68.1 | 1.3% |
| 6 | Spirit Halloween | 52.9 | 1.0% |
| 7 | Leg Avenue | 50.9 | 1.0% |
| 8 | Morph | 49.6 | 1.0% |
| 9 | PARTY TELLER | 39.3 | 0.8% |
| 10 | Jazwares Costume Play | 34.6 | 0.7% |
Decor
| Rank | Brand | Avg distinct products per day | Share of category |
|---|---|---|---|
| 1 | JOYIN | 108.7 | 3.2% |
| 2 | Horaldaily | 43.4 | 1.3% |
| 3 | Joiedomi | 32.9 | 1.0% |
| 4 | Gemmy | 24.9 | 0.7% |
| 5 | Brightown | 23.3 | 0.7% |
| 6 | TURNMEON | 15.6 | 0.5% |
| 7 | Dazzle Bright | 14.4 | 0.4% |
| 8 | OHOME | 13.6 | 0.4% |
| 9 | GOOSH | 12.3 | 0.4% |
| 10 | Winlyn | 12.3 | 0.4% |
Note: Share of distinct products per day within each category, averaged over seven days. Costume averages 5,115 distinct products a day and decor averages 3,364. “Generic” (0.9% of costume and 1.3% of decor products) and blank brand labels are excluded from the ranking but stay in the denominator. Brand names are matched ignoring capitalization.
- Share of listings is not share of sales. This data cannot show which brands sell the most.
- One company can appear under several labels. A brand label is the name the seller supplied, and similar spellings were not merged.
Did Prices and Paid Placement Change During the Week?
No. Both categories stayed stable from Oct 19 to 25. Costume median price held between $24.71 and $24.99, and decor between $18.99 and $19.94. Sponsored share stayed between 10.2% and 11.7% for costumes and between 9.0% and 10.2% for decor.
Decor’s median price peaked at $19.94 on Oct 20 and returned to $18.99 the next day. Costume sponsored share reached its highest point, 11.7%, on Oct 25. One day does not make a trend, and seven days is too short to call one.
Compare this with the first section: different products appeared each day, but the price level and the paid share did not move.
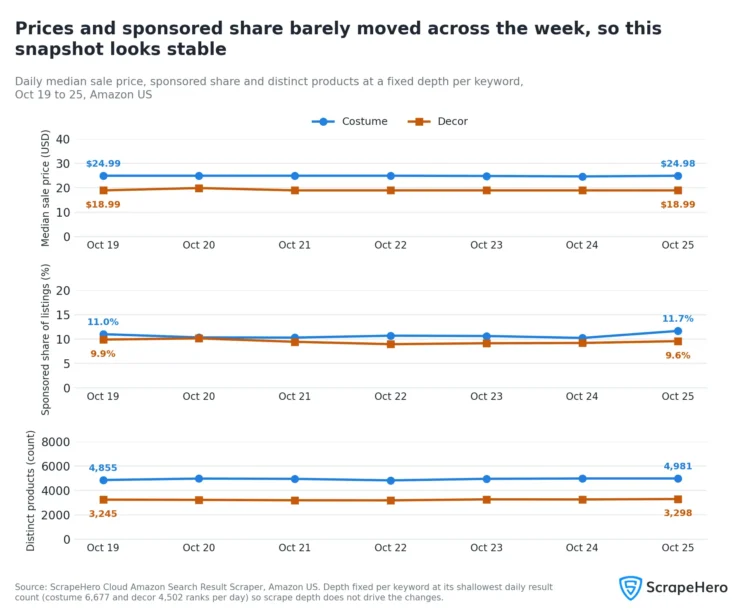
| Day | Costume median price | Costume sponsored share | Costume distinct products | Decor median price | Decor sponsored share | Decor distinct products |
|---|---|---|---|---|---|---|
| Oct 19 | $24.99 | 11.0% | 4,855 | $18.99 | 9.9% | 3,245 |
| Oct 20 | $24.99 | 10.4% | 4,971 | $19.94 | 10.2% | 3,227 |
| Oct 21 | $24.99 | 10.3% | 4,948 | $18.99 | 9.5% | 3,193 |
| Oct 22 | $24.99 | 10.7% | 4,824 | $18.99 | 9.0% | 3,186 |
| Oct 23 | $24.89 | 10.6% | 4,952 | $18.99 | 9.2% | 3,268 |
| Oct 24 | $24.71 | 10.2% | 4,980 | $18.99 | 9.2% | 3,258 |
| Oct 25 | $24.98 | 11.7% | 4,981 | $18.99 | 9.6% | 3,298 |
Note: Scrape depth varied by day, with some keywords stopping between 342 and 390 ranks. To keep days comparable, each keyword is cut at the lowest daily maximum rank it reached during the week (6,677 ranks per day in total for costumes and 4,502 for decor).
Where are Halloween Demand Signals Strongest on Amazon US?
Decor shows stronger demand signals. 32.6% of decor listings carry a 1K+ “bought in past month” band: 17.3% in the 1K+ to 2K+ group and 15.3% at 3K+ and above. For costumes the figure is 17.7% (12.7% and 5.0%).
Amazon shows these bands as floor values, such as “100+” or “1K+”. Among listings that show a band, 38.2% of decor and 22.8% of costume listings are in the 1K+ range. Also, 20.0% of costume listings and 13.5% of decor listings show no band at all. A missing band does not mean zero sales.
The data cannot turn these bands into units or revenue. It shows where Amazon displays higher purchase floors, not how much each product sold.
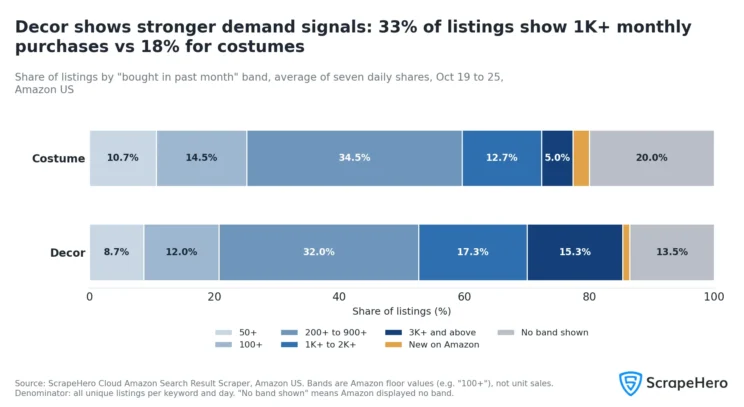
| Band group | Costume | Decor |
|---|---|---|
| 50+ | 10.7% | 8.7% |
| 100+ | 14.5% | 12.0% |
| 200+ to 900+ | 34.5% | 32.0% |
| 1K+ to 2K+ | 12.7% | 17.3% |
| 3K+ and above | 5.0% | 15.3% |
| New on Amazon | 2.6% | 1.1% |
| No band shown | 20.0% | 13.5% |
Note: Each share is the group’s listings divided by all unique listings per keyword and day, averaged over seven days. “No band shown” means the field was blank. “New on Amazon” is a separate label Amazon shows instead of a band. Bands are minimums set by Amazon, so they cannot be added up into units or revenue.
How do 1K+ Listings Differ from the Rest?
This table covers listings that show a numeric band, using averages of daily values.
| Category | Group | Median sale price | Median review count | Sponsored share |
|---|---|---|---|---|
| Costume | 1K+ band | $23.18 | 798 | 4.4% |
| Costume | Under 1K band | $25.54 | 133 | 9.2% |
| Decor | 1K+ band | $16.13 | 690 | 3.7% |
| Decor | Under 1K band | $19.99 | 56 | 10.3% |
- Highest 1K+ share by keyword: halloween decorations indoor (decor) 66.2%; halloween decorations (decor) 65.0%; halloween party supplies (decor) 58.3%; halloween decorations outdoor (decor) 56.0%; halloween costume accessories (costume) 43.3%.
- Lowest: baby halloween costume (costume) 5.4%; witch costume (costume) 7.5%; couples halloween costume (costume) 8.2%; skeleton costume (costume) 8.3%; dog halloween costume (costume) 8.5%.
- Broad decor terms lead. Four broad decor terms top the list. Narrower terms sit much lower, such as halloween wreath (10.5%) and halloween inflatables (12.9%). The data does not explain why.
- 1K+ listings carry fewer sponsored labels and more reviews. They also have lower median prices than the rest. This describes the data and does not show cause.
Comparing e-commerce data scraping providers? See how ScrapeHero stacks up in our guide to the best web scraping services for e-commerce.
Methodology
- Source: ScrapeHero Cloud Amazon Search Result Scraper, Amazon US.
- Collection window: Oct 19 to Oct 25, 2026. One file per day for each category (seven costume files and seven decor files).
- Sample size: 81,544 data rows, excluding header rows. Costume: 48,573 rows across 19 keywords. Decor: 32,971 rows across 13 keywords. After counting repeated ASINs once per keyword and day, 67,840 keyword listings remain (40,605 costume and 27,235 decor).
- Keywords:
- Costume: baby halloween costume, couples halloween costume, dinosaur costume, dog halloween costume, family halloween costumes, halloween costume, halloween costume accessories, halloween costumes for adults, halloween makeup kit, halloween wig, inflatable costume, kids halloween costume, men halloween costume, princess costume, skeleton costume, superhero costume, toddler halloween costume, witch costume, women halloween costume.
- Decor: artificial pumpkins, giant skeleton decoration, halloween decorations, halloween decorations indoor, halloween decorations outdoor, halloween inflatables, halloween party supplies, halloween projector lights, halloween string lights, halloween tablecloth, halloween window clings, halloween wreath, halloween yard stakes.
- Fields analyzed: search_term, asin, rank, listing_page, sale_price, is_sponsored, brand, sales_volume, review_count.
- Data preparation:
- Repeated ASINs within the same keyword and day were counted once, at the lowest rank. This removed 13,704 rows (16.8%).
- Weekly figures are the average of seven daily values, except where a table says “across the week.”
- Median sale price excludes 511 listings without a price (336 costume, 175 decor).
- Brand names were matched ignoring capitalization. “Generic” and blank labels were left out of brand rankings.
- The weekly changes view cuts each keyword at a fixed depth, so scrape depth does not drive day-to-day changes.
- Definitions:
- Distinct products: unique ASINs.
- Keyword listing: one ASIN in one keyword’s results on one day.
- Sponsored share: sponsored listings divided by unique listings in the same group.
- Page 1: listings with listing_page 1.
- 1K+ group: listings whose “bought in past month” band is 1K+ or higher.
- No band shown: blank sales_volume. It does not mean zero sales.
- What this data covers: Amazon US search results for the 32 keywords above, up to about 390 ranks per keyword, collected once a day from Oct 19 to 25.
- What this data does not cover: How many units these products sold and how much revenue each brand earned. The data shows listings and Amazon’s purchase bands, not sales.
- Limitations:
- Purchase bands are floors set by Amazon, not unit counts.
- Seven days cannot show a trend or a seasonal peak.
- Keywords overlap (for example, “halloween costume” and “kids halloween costume”), so keyword results are not separate market segments.
- Scrape depth differed by day, from 330 to 390 ranks for some keywords.
- Sponsored status is the label shown at scrape time.
Do You Want Clean Data to Understand a Market or Industry?
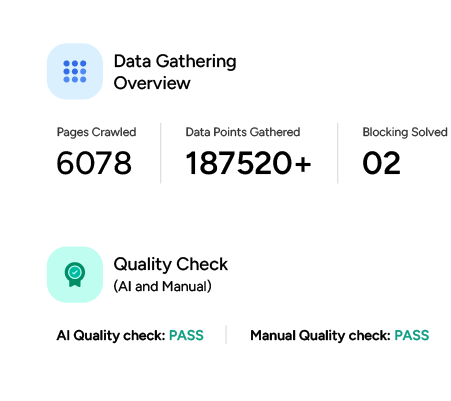
Every finding in this report started as a plain file of search results. Price gaps, sponsored share, brand concentration and demand bands only appear once the data is clean and structured. The story comes after the data.
If you want clean data to understand any market or industry, ScrapeHero is the name to trust. We are a fully managed web scraping service, so you get structured data without building or maintaining scrapers yourself.
Disclaimer: The data in this report comes from publicly available Amazon US search results. ScrapeHero produced this analysis independently. It is not affiliated with, endorsed by, or produced in association with Amazon or any of the brands or sellers named. All brand names and trademarks are the property of their respective owners.
Frequently Asked Questions
Across all 19 costume keywords, the average daily median sale price was $24.92. By keyword, medians ran from $9.84 (halloween costume accessories) to $31.72 (inflatable costume), and 15 of 19 keywords sat between $22 and $32.
Across all 13 decor keywords, the average daily median sale price was $19.12. By keyword, medians ran from $7.99 (halloween window clings) to $46.07 (halloween inflatables).
Sponsored listings held 11.7% of costume page 1 listings and 11.8% of decor page 1 listings, or about 1 in 9. By keyword, the share ranged from 5.6% (halloween string lights) to 17.5% (skeleton costume and artificial pumpkins).
Spooktacular Creations (7.0% of distinct products), Rubies (5.7%) and Disguise (2.7%) lead. This is share of listings, not share of sales.
JOYIN leads with 3.2% of distinct decor products, followed by Horaldaily (1.3%) and Joiedomi (1.0%). Decor is less concentrated than costumes: the top 10 decor brands hold 9.0%, vs 23.4% for costume brands.
No. From Oct 19 to 25, costume median price stayed between $24.71 and $24.99, and decor between $18.99 and $19.94. Sponsored share stayed between 10.2% and 11.7% for costumes and between 9.0% and 10.2% for decor.
No. Amazon shows these as minimum bands, such as “100+” or “1K+”, so they cannot be added up into units or revenue. In this data, 32.6% of decor listings and 17.7% of costume listings showed a 1K+ band.
We used the ScrapeHero Cloud Amazon Search Result Scraper on Amazon US, with one file per day for each category from Oct 19 to 25, 2026. The data holds 81,544 rows across 32 keywords (19 costume and 13 decor), covering 21,663 distinct products across the week.
You have three options:
– Build your own scraper: Write one in Python or JavaScript with a browser automation tool such as Playwright. This gives you control but takes coding skills and upkeep.
– Use a no-code scraper: The ScrapeHero Cloud Amazon Product Details and Pricing Scraper collects data from product URLs or ASINs, and you download the results to a spreadsheet.
– Use an API: The ScrapeHero Cloud Amazon Product Details and Pricing API streams product data into your own application.
For step-by-step instructions, read our guide on how to scrape Amazon product data. This report used a different tool, the ScrapeHero Cloud Amazon Search Result Scraper, which collects search results by keyword.