Walmart is the largest grocery chain in the US, with 4,592 locations across 52 states, followed by ALDI with 2,580 stores and Albertsons Companies with 2,279 locations. However, national dominance doesn’t translate to regional leadership—Publix controls Florida with 908 stores while Albertsons Companies dominates California with 585 locations. This demonstrates how regional grocery markets operate differently than national rankings suggest.
Introduction
The US grocery industry is experiencing its most dynamic period in decades.
With foot traffic surpassing pre-pandemic levels at 17.17 billion visits in 2024 and over 70% of retailers now offering online ordering, the competitive landscape has fundamentally shifted.
Understanding which chains dominate nationally versus regionally has become critical for investors analyzing market opportunities, real estate developers selecting sites, and retail strategists planning expansion.
This analysis examines 11 major grocery chains across the country, revealing the geographic distribution patterns, service evolution, and financial performance trends reshaping American grocery retail in 2026.
You’ll discover how the largest chain nationally doesn’t lead in the two most populous states, which ZIP codes show the highest store saturation, and how consumer behavior has permanently changed since 2020.
NB: The POI location data was downloaded from ScrapeHero Data Store.
Market Leadership: The Largest Grocery Chains by Store Count
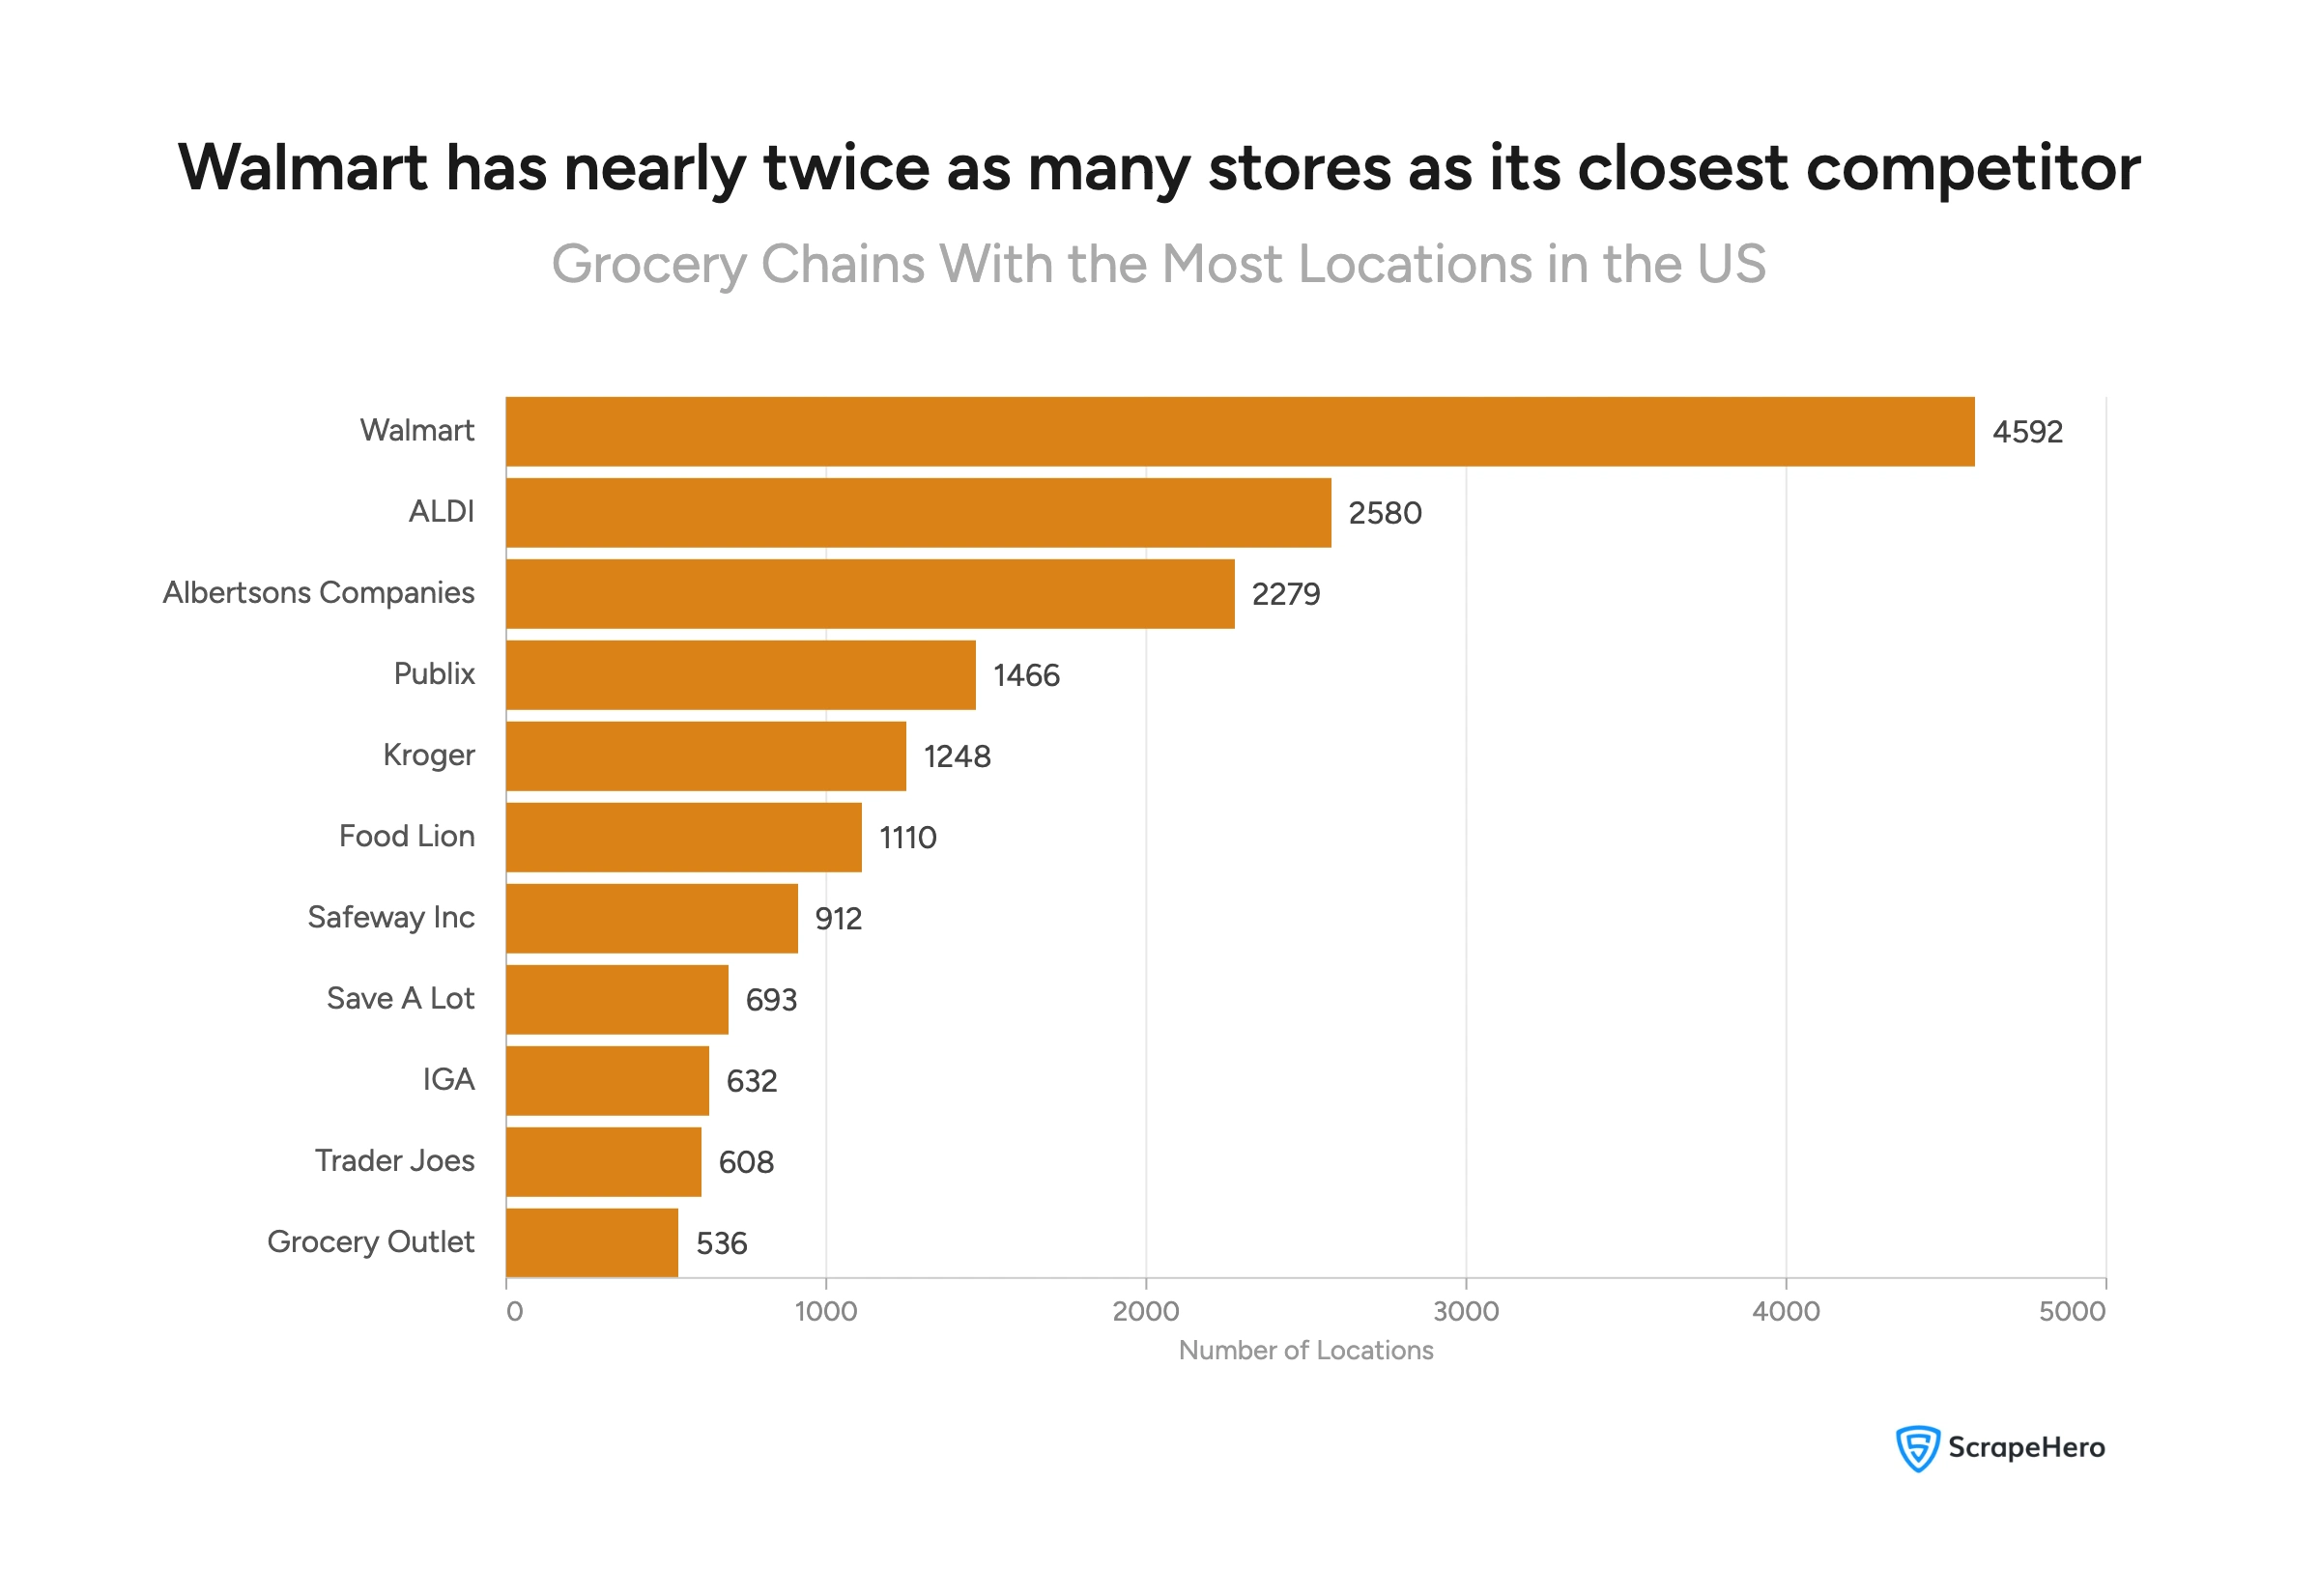
Walmart dominates the US grocery landscape with 4,592 stores, nearly double ALDI’s 2,580 locations and more than twice Albertsons Companies’ 2,279 stores.
Walmart however, is classified as a department store under NAICS rather than a pure grocery retailer.
The gap between the top three chains and the rest of the market is substantial—fourth-place Publix has just 1,466 locations, representing a 68% drop from Walmart’s footprint.
The top 11 grocery chains by store count show significant variation in scale:
Top 11 Grocery Chains by Store Count:
- Walmart – 4,592 locations
- ALDI – 2,580 locations
- Albertsons Companies – 2,279 locations
- Publix – 1,466 locations
- Kroger – 1,248 locations
- Food Lion – 1,110 locations
- Safeway Inc – 912 locations
- Save A Lot – 693 locations
- IGA – 632 locations
- Trader Joe’s – 608 locations
- Grocery Outlet – 536 locations
Top Three Chains Control 64% of These Locations
Walmart, ALDI, and Albertsons Companies collectively operate 9,451 stores, representing nearly two-thirds of all locations among the top 11 chains.
This concentration shows a clear divide in scale between the top three and the remaining eight chains.
Key Market Dynamics:
- Walmart’s scale advantage: With stores in 52 states (including DC and Puerto Rico), Walmart achieves unmatched geographic reach
- ALDI’s rapid expansion: The German discount chain has aggressively grown its US footprint, now operating in 40 states
- Albertsons’ consolidation: Operating multiple banners (Safeway, Vons, Jewel-Osco), Albertsons Companies maintains presence across 36 states
Geographic Reach: Which Grocery Chains Have the Widest Presence?
Store count alone doesn’t tell the full story. A chain with fewer locations but presence across more states often signals a broader market strategy than one concentrated in a few high-density areas.
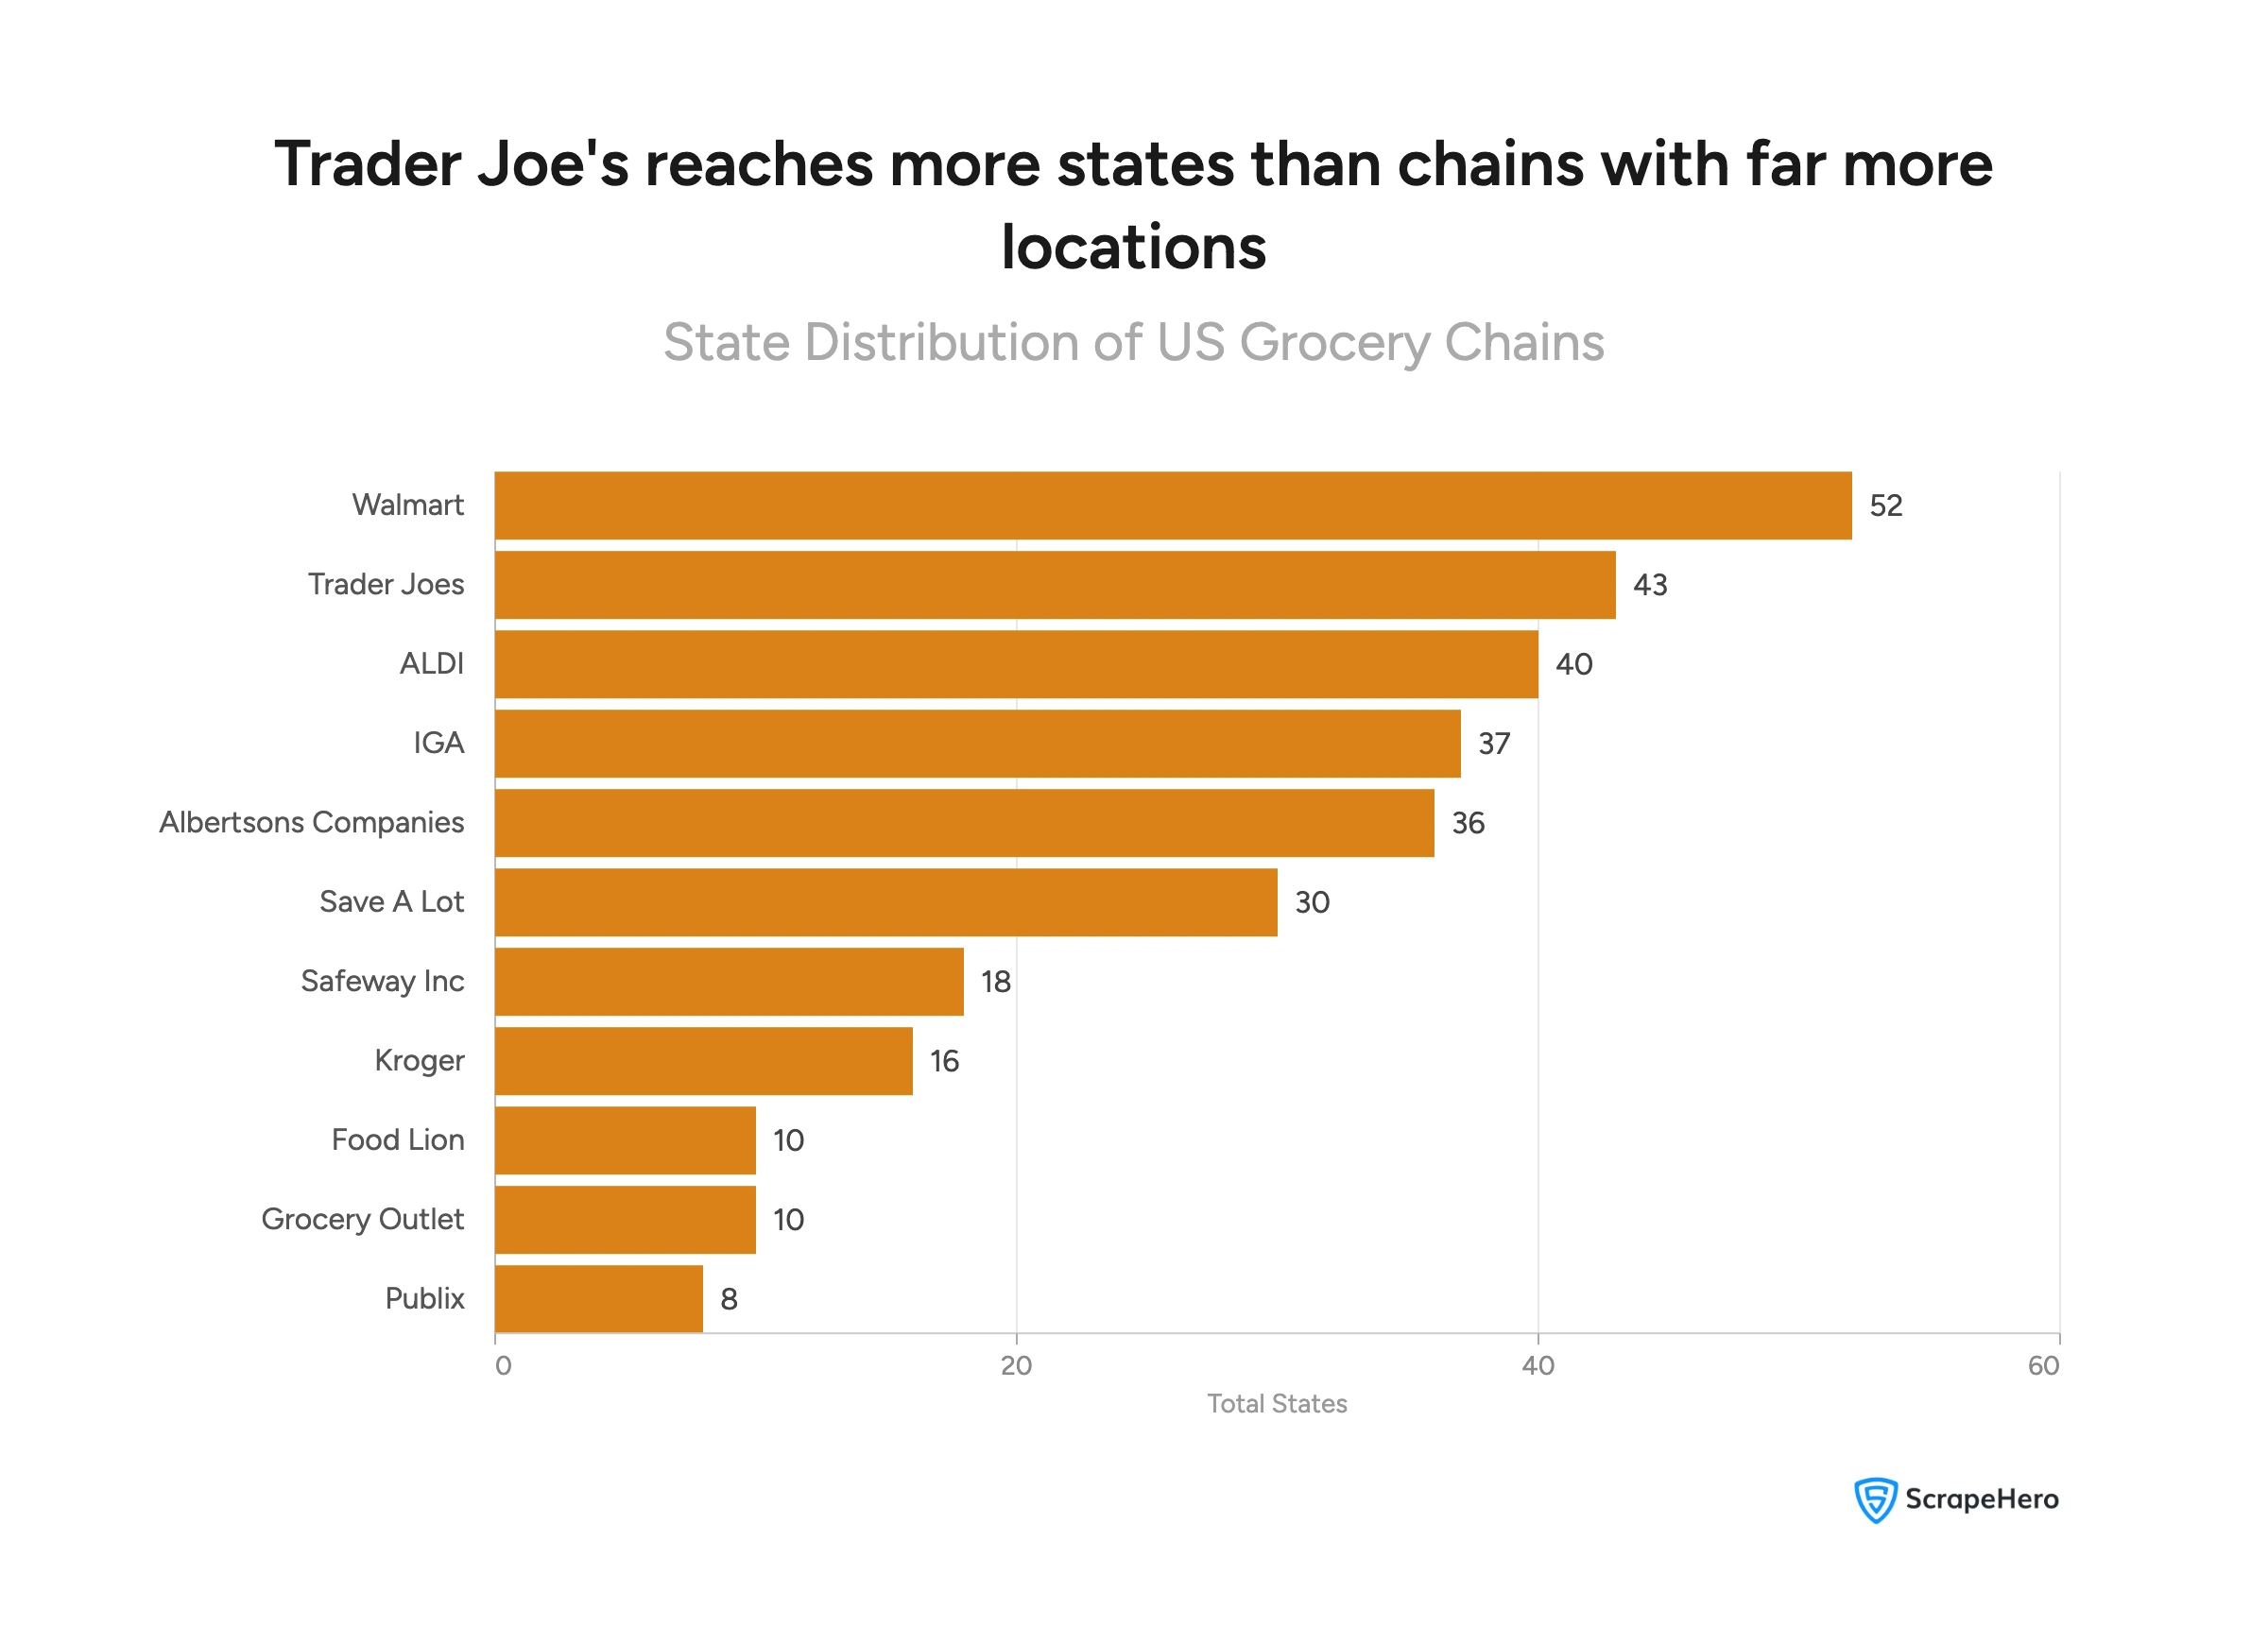
State Reach vs. Store Count: Two Different Metrics
Geographic reach and store count don’t always move together. Trader Joe’s operates in 43 states with just 608 locations, while Food Lion has 1,110 stores but is present in only 10 states.
These are two fundamentally different approaches to market presence.
Here’s how the top chains rank by number of states:
- Walmart – 52 states
- Trader Joe’s – 43 states
- ALDI – 40 states
- IGA – 37 states
- Albertsons Companies – 36 states
- Save A Lot – 30 states
- Safeway Inc – 18 states
- Kroger – 16 states
- Food Lion – 10 states
- Grocery Outlet – 10 states
- Publix – 8 states
What Does City Penetration Tell Us?
Beyond states, city-level distribution reveals how deeply a chain has penetrated individual markets across the US.
- Walmart – present in 2,641 cities
- ALDI – present in 1,716 cities
- Albertsons Companies – present in 1,215 cities
- Kroger – present in 593 cities
- Food Lion – present in 577 cities
- IGA – present in 554 cities
- Publix – present in 525 cities
- Save A Lot – present in 525 cities
- Safeway Inc – present in 519 cities
- Trader Joe’s – present in 457 cities
- Grocery Outlet – present in 443 cities
Walmart’s city penetration (2,641) is 54% higher than ALDI’s (1,716), reinforcing that its lead isn’t just in store count but in how broadly it is distributed across American communities.
Is Wider Always Better?
Not necessarily. A chain present in 43 states with 608 stores averages just 14 stores per state. A chain in 10 states with 1,110 stores averages 111 stores per state. Both are valid strategies with different risk and revenue profiles.
What the data tells us is this: geographic breadth and store density are separate competitive levers, and different chains have clearly pulled them differently.
Regional Powerhouses: Where National Leaders Don’t Lead
National store counts can be misleading. In some of America’s most populated and economically significant states, the chain with the most locations nationwide is not the market leader. Regional concentration tells a very different story.
Top States for Grocery Store Concentration
California, Florida, and Texas account for the highest grocery store density in the US—unsurprisingly, they are also among the most populated states in the country.
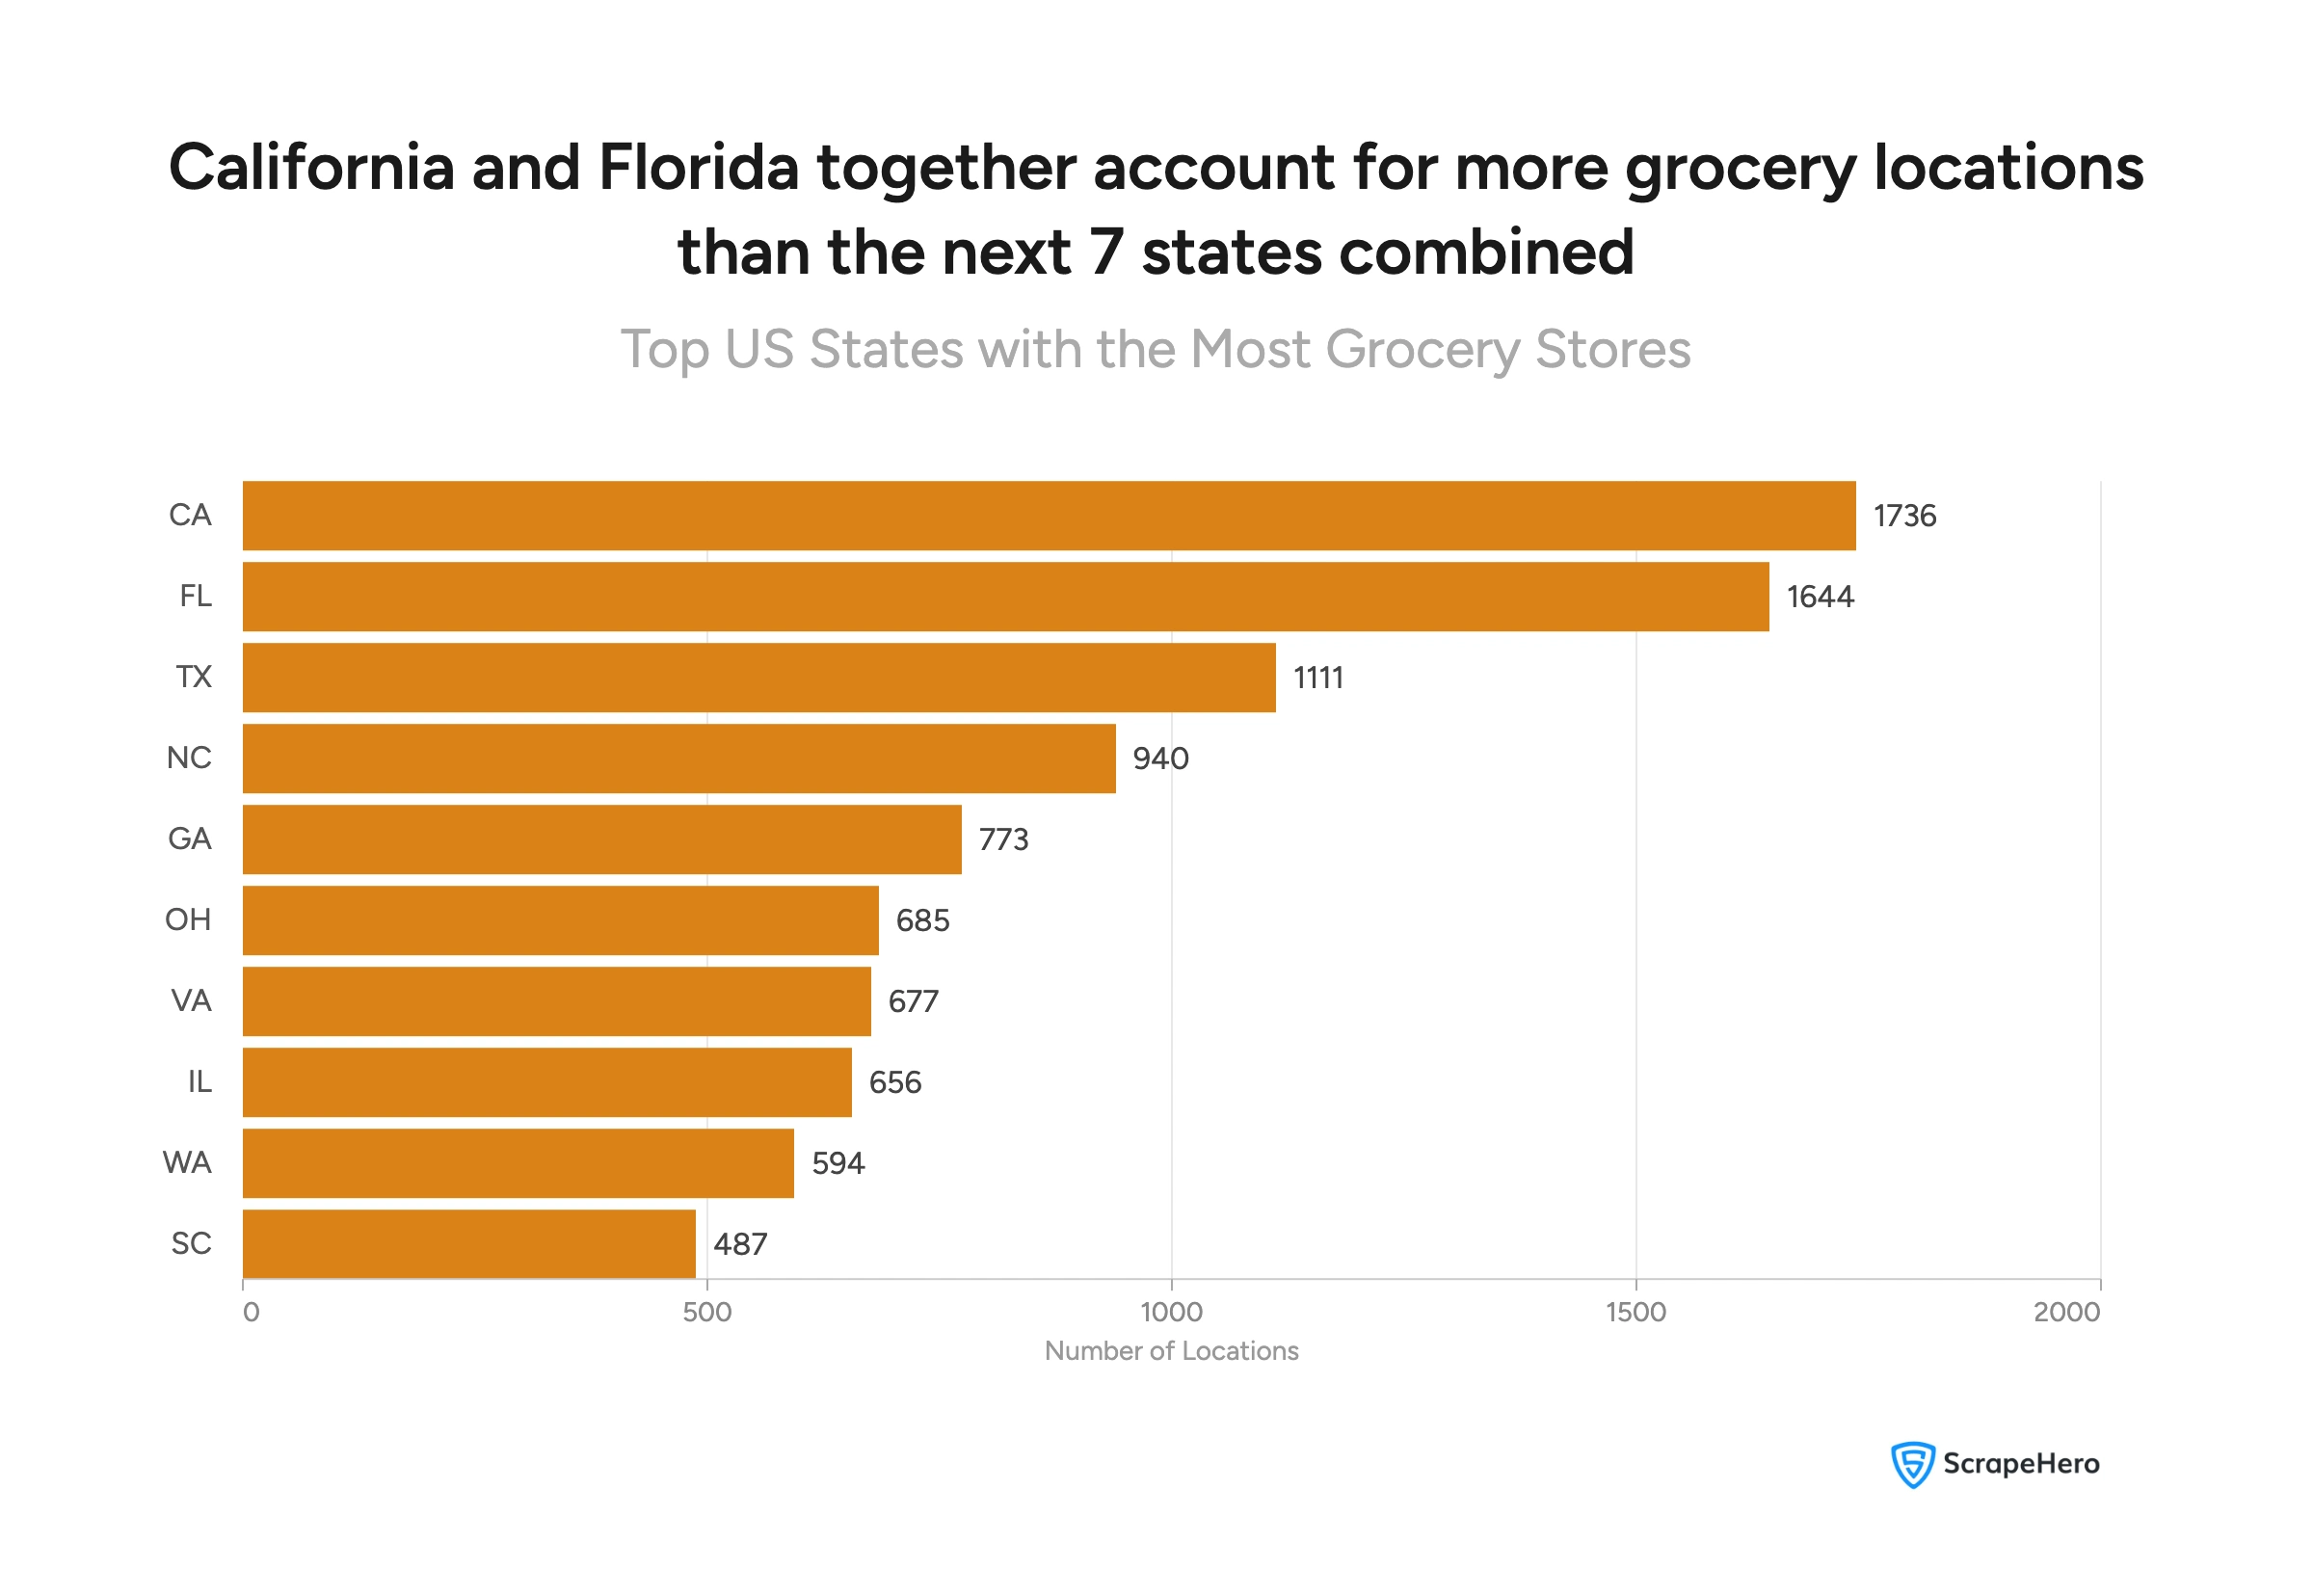
The top 10 states by total grocery store locations:
- California – 1,736 locations
- Florida – 1,644 locations
- Texas – 1,111 locations
- North Carolina – 940 locations
- Georgia – 773 locations
- Ohio – 685 locations
- Virginia – 677 locations
- Illinois – 656 locations
- Washington – 594 locations
- South Carolina – 487 locations
California and Florida alone account for 3,380 locations—more than the combined total of the remaining eight states on this list (6,923 locations combined across all ten).
The Regional Competition Story: Florida, California, and Texas
In America’s top three grocery states, the national leader by store count doesn’t always win. Each state has its own competitive dynamic.
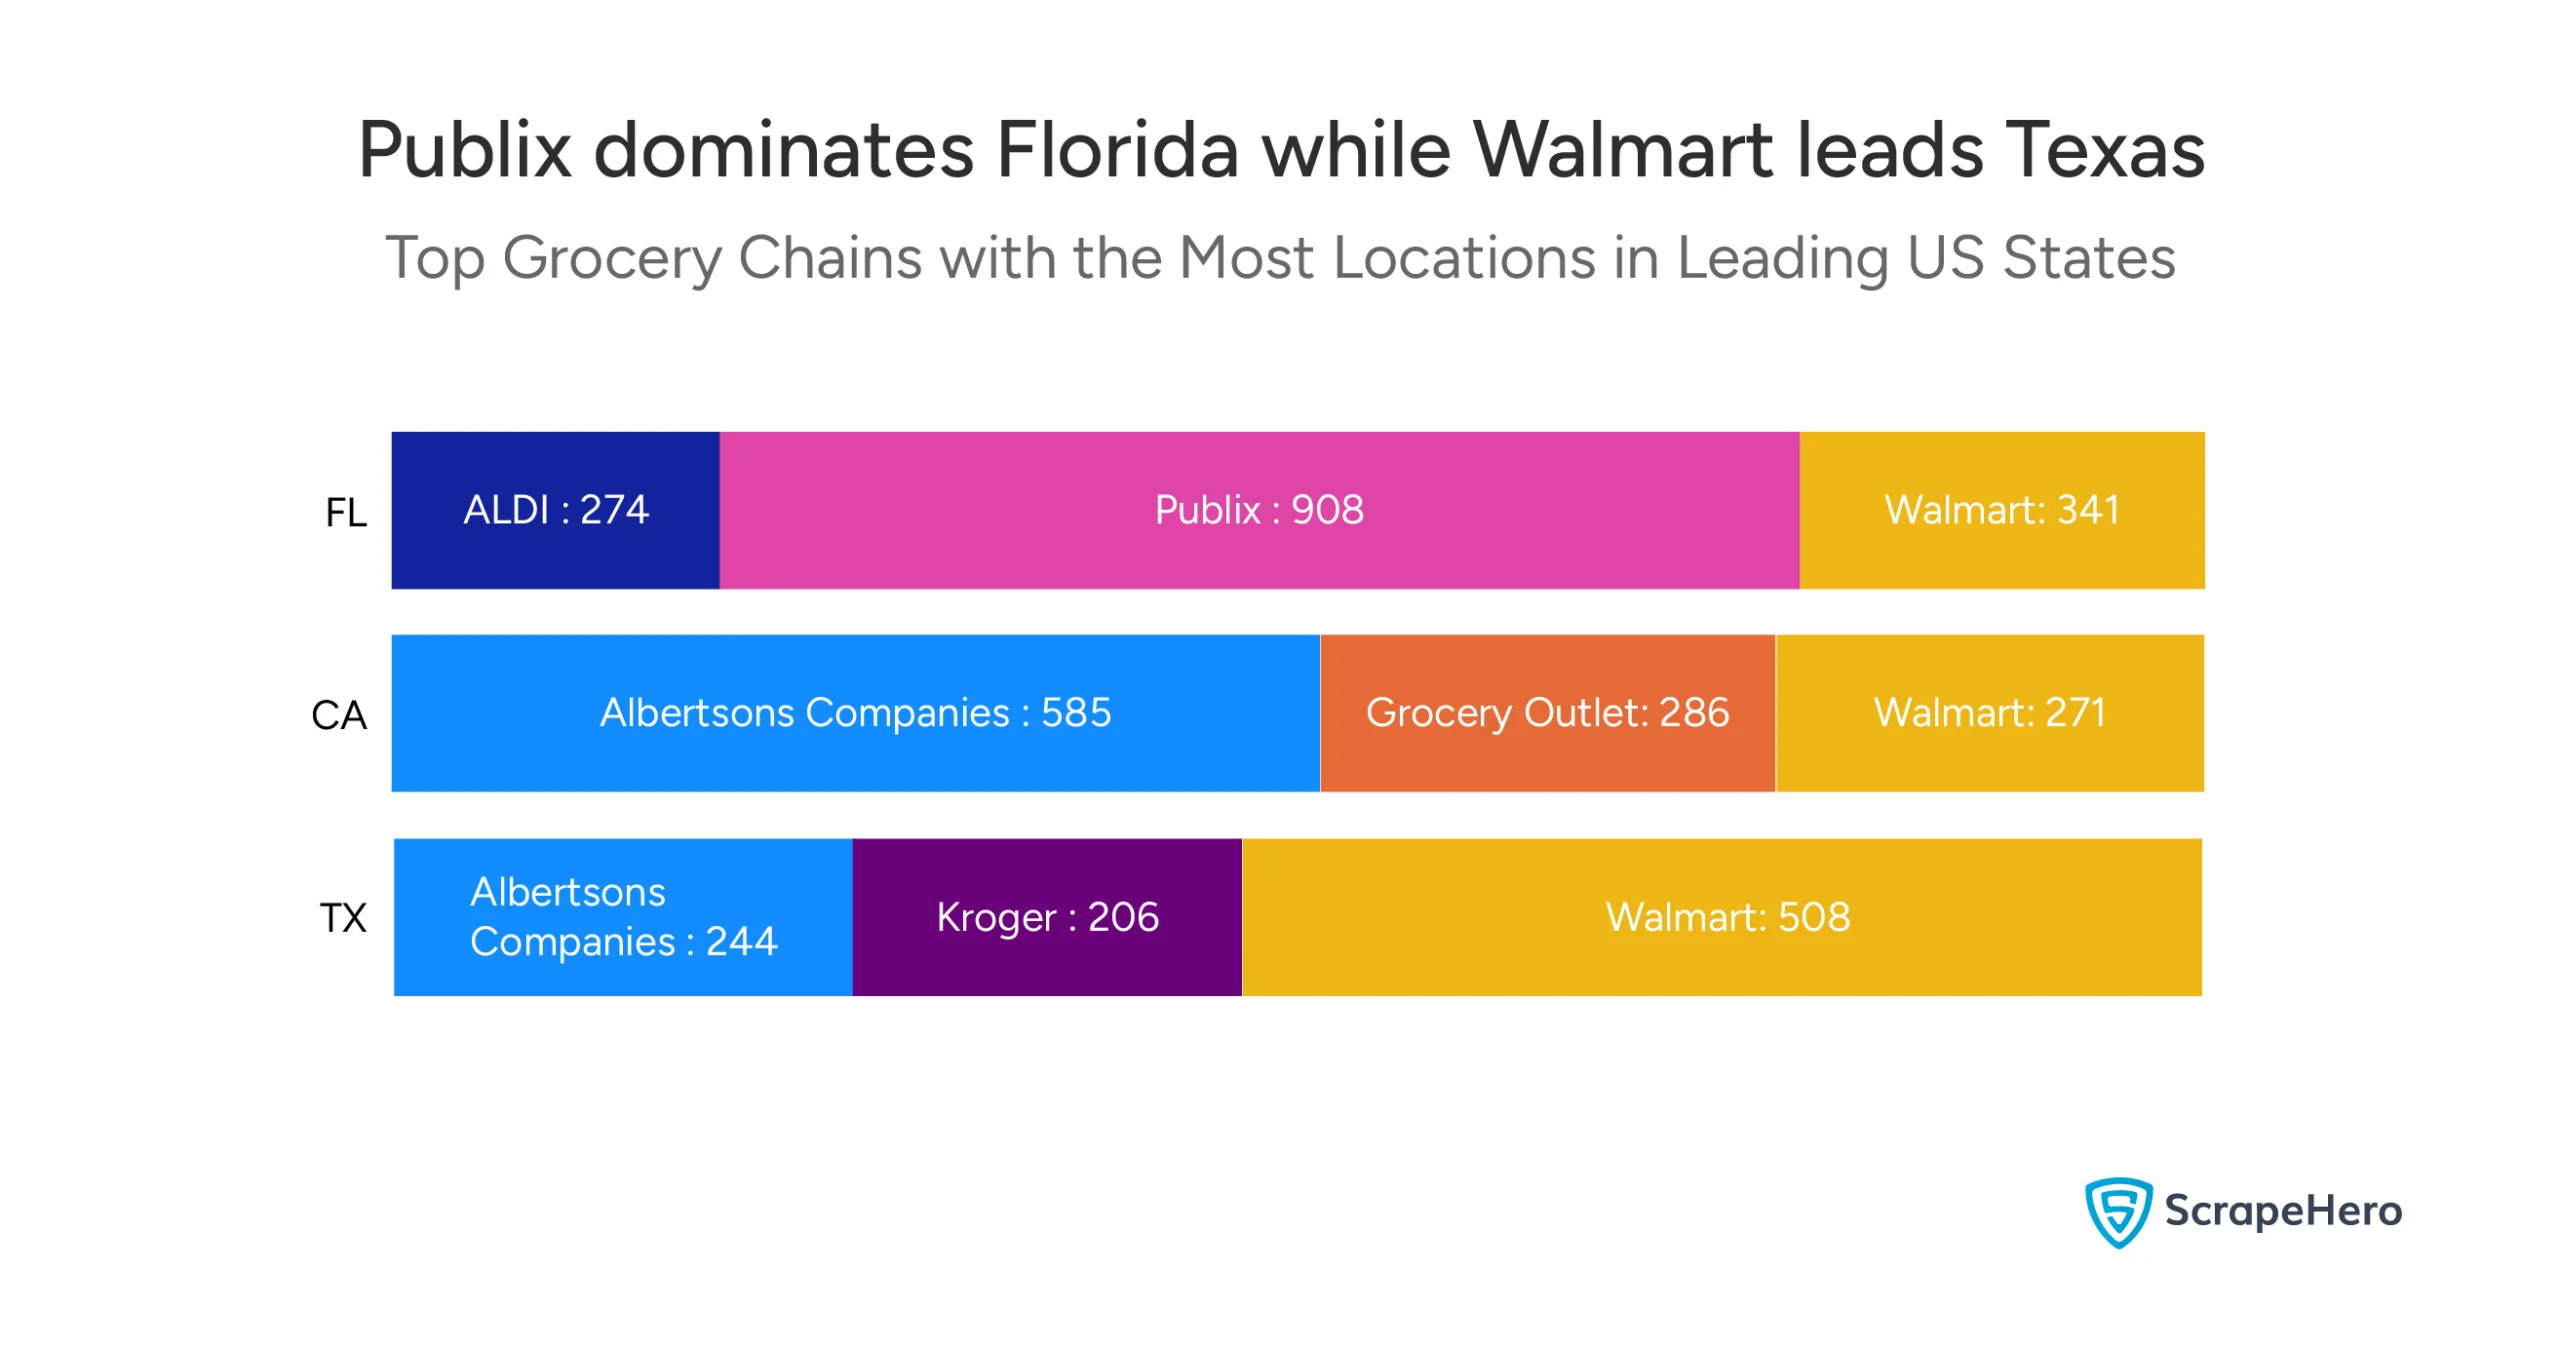
Here’s how the top three chains break down in each state:
Florida:
- Publix – 908 locations (leads the state)
- Walmart – 341 locations
- ALDI – 274 locations
California:
- Albertsons Companies – 585 locations (leads the state)
- Grocery Outlet – 286 locations
- Walmart – 271 locations
Texas:
- Walmart – 508 locations (leads the state)
- Albertsons Companies – 244 locations
- Kroger – 206 locations
Despite having 4,592 stores nationally, Walmart ranks second in Florida and third in California.
Publix, with just 1,466 total US locations, commands a dominant position in Florida with 908 stores—that’s 62% of its entire national footprint concentrated in one state.
Albertsons Companies similarly leads California with 585 stores, ahead of Walmart’s 271.
Texas is the exception, where Walmart’s national scale translates directly into state-level leadership with 508 locations.
Which Cities and Counties Have the Most Grocery Stores?
At the city level, Houston, Chicago, and Jacksonville lead the US in grocery store concentration.
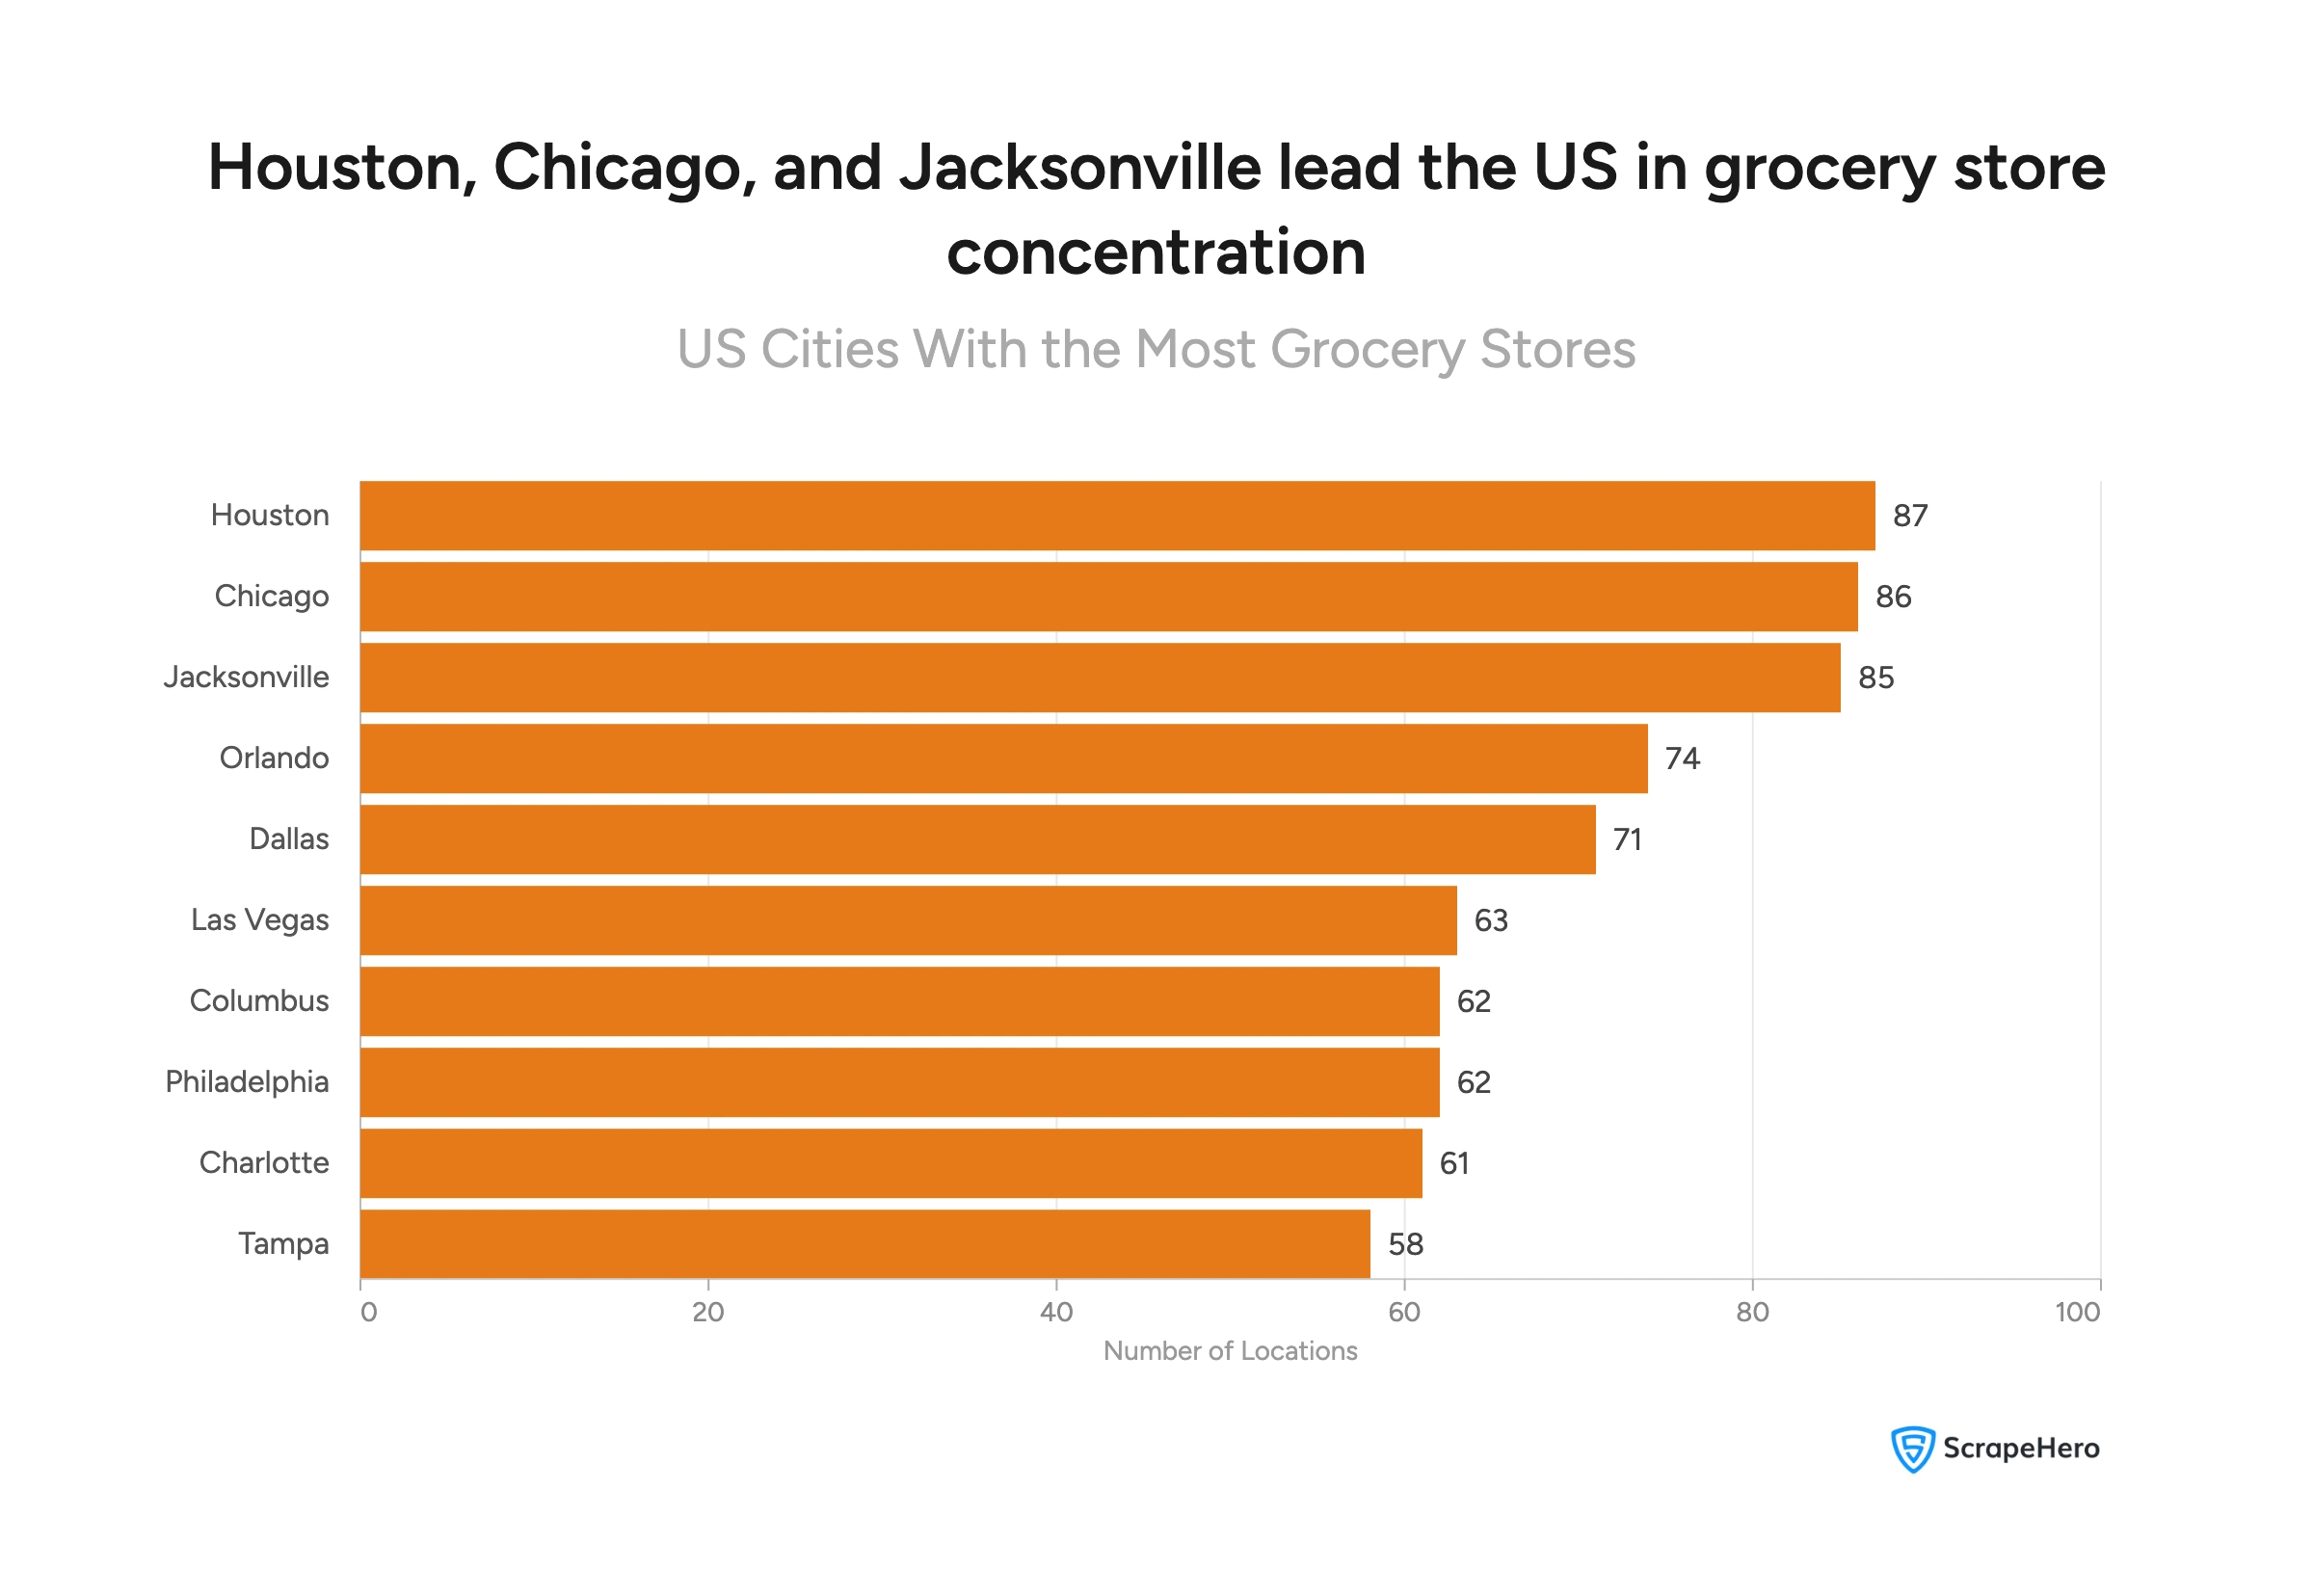
Top 10 US Cities by Grocery Store Count:
- Houston – 87 locations
- Chicago – 86 locations
- Jacksonville – 85 locations
- Orlando – 74 locations
- Dallas – 71 locations
- Las Vegas – 63 locations
- Columbus – 62 locations
- Philadelphia – 62 locations
- Charlotte – 61 locations
- Tampa – 58 locations
At the county level, Los Angeles County leads nationally with 272 grocery store locations, followed by Cook County, IL (222) and Maricopa County, AZ (218).
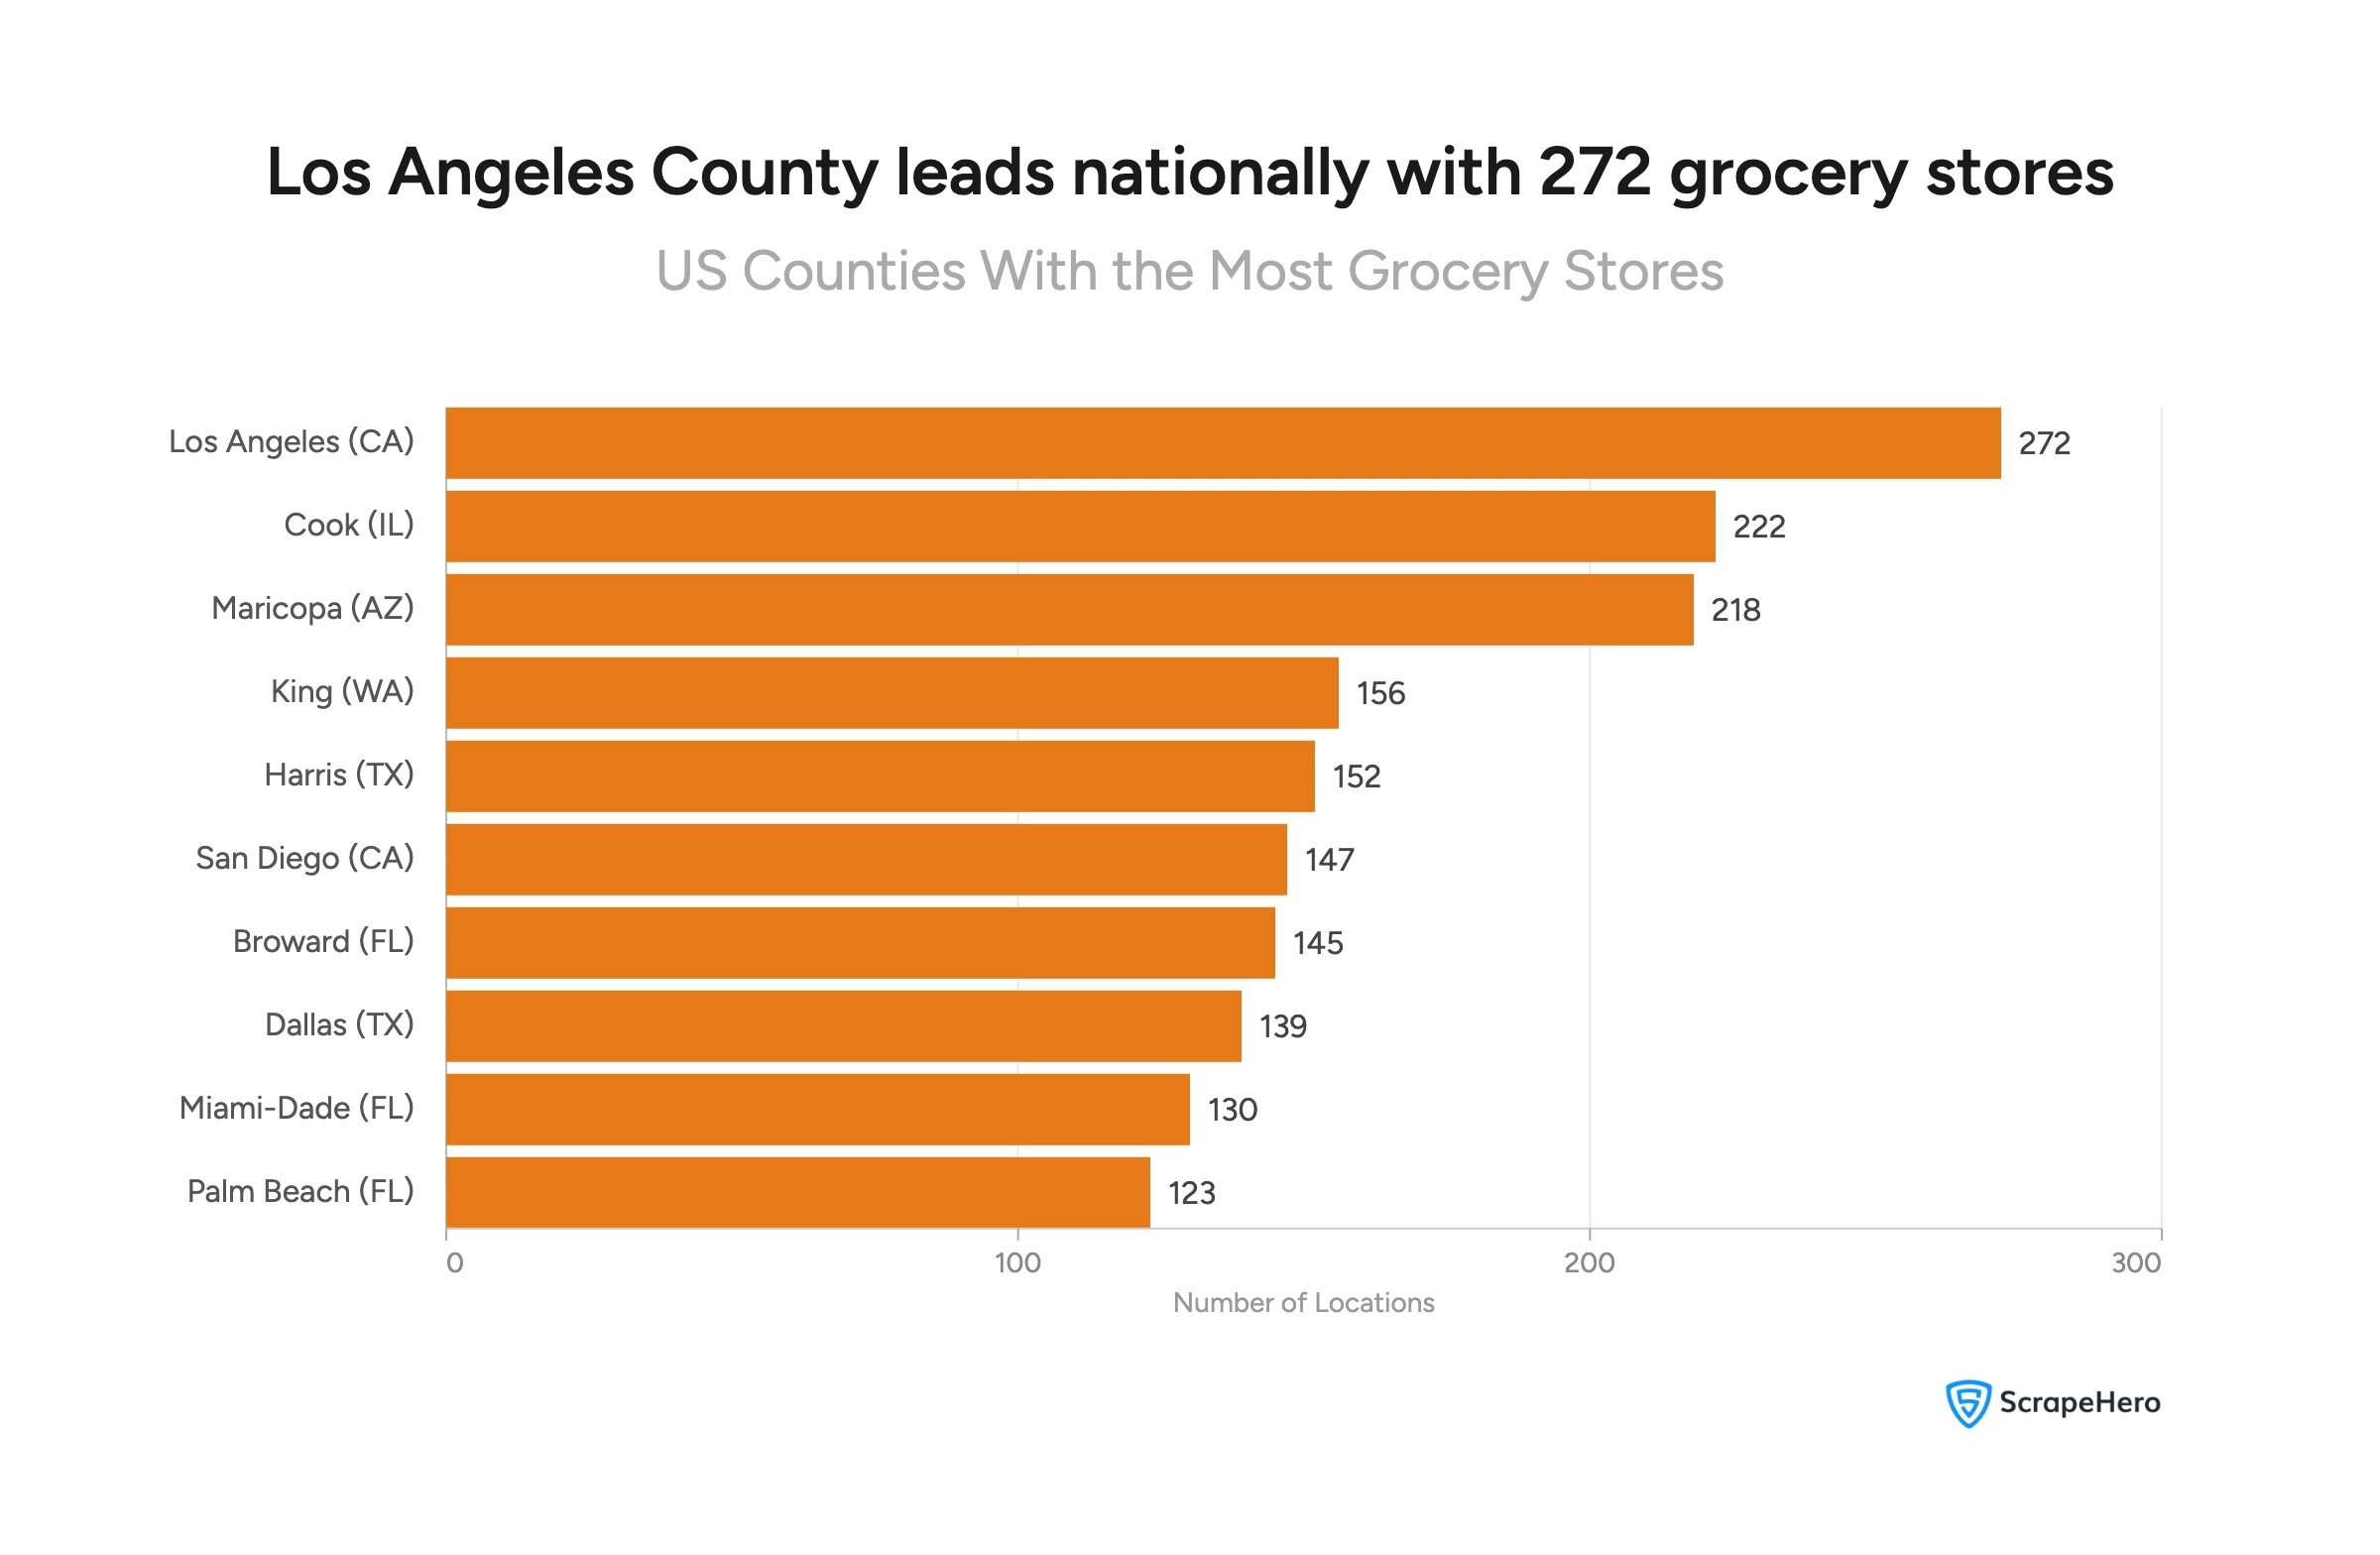
Top 5 Counties by Grocery Store Count:
- Los Angeles, CA – 272 locations
- Cook, IL – 222 locations
- Maricopa, AZ – 218 locations
- King, WA – 156 locations
- Harris, TX – 152 locations
Market Saturation: ZIP Codes with Highest Grocery Store Density
Some ZIP codes have reached a point where grocery store concentration is notably high relative to their population size. Identifying these areas matters for anyone evaluating market entry, expansion, or competitive positioning.
The data identifies four ZIP codes that each host 10 grocery store locations—the highest concentration in this dataset:
| Zip Code | Total Stores | Population | Stores per 10,000 People |
|---|---|---|---|
| 23322 | 10 | 66,543 | 1.5 |
| 28358 | 10 | 34,545 | 2.9 |
| 30004 | 10 | 69,145 | 1.45 |
| 72712 | 10 | 38,512 | 2.6 |
Population data sourced from city-data.com
What Does Store Density Relative to Population Tell Us?
The same store count means very different things depending on the population it serves.
ZIP code 28358 has 10 stores serving 34,545 people, roughly one store per 3,455 residents.
ZIP code 30004 also has 10 stores but serves 69,145 people, nearly double the population per store.
This means:
- 28358 and 72712 show higher saturation relative to population—these markets may already be well-served
- 30004 and 23322 serve larger populations with the same store count—potentially indicating stronger demand per store
Beyond Groceries: How Stores Are Evolving Their Service Offerings
Today’s grocery stores offer far more than food. From wine and beer sections to ATMs and recycling programs, the modern grocery store has evolved into a multi-service destination—and the data reflects this shift clearly.
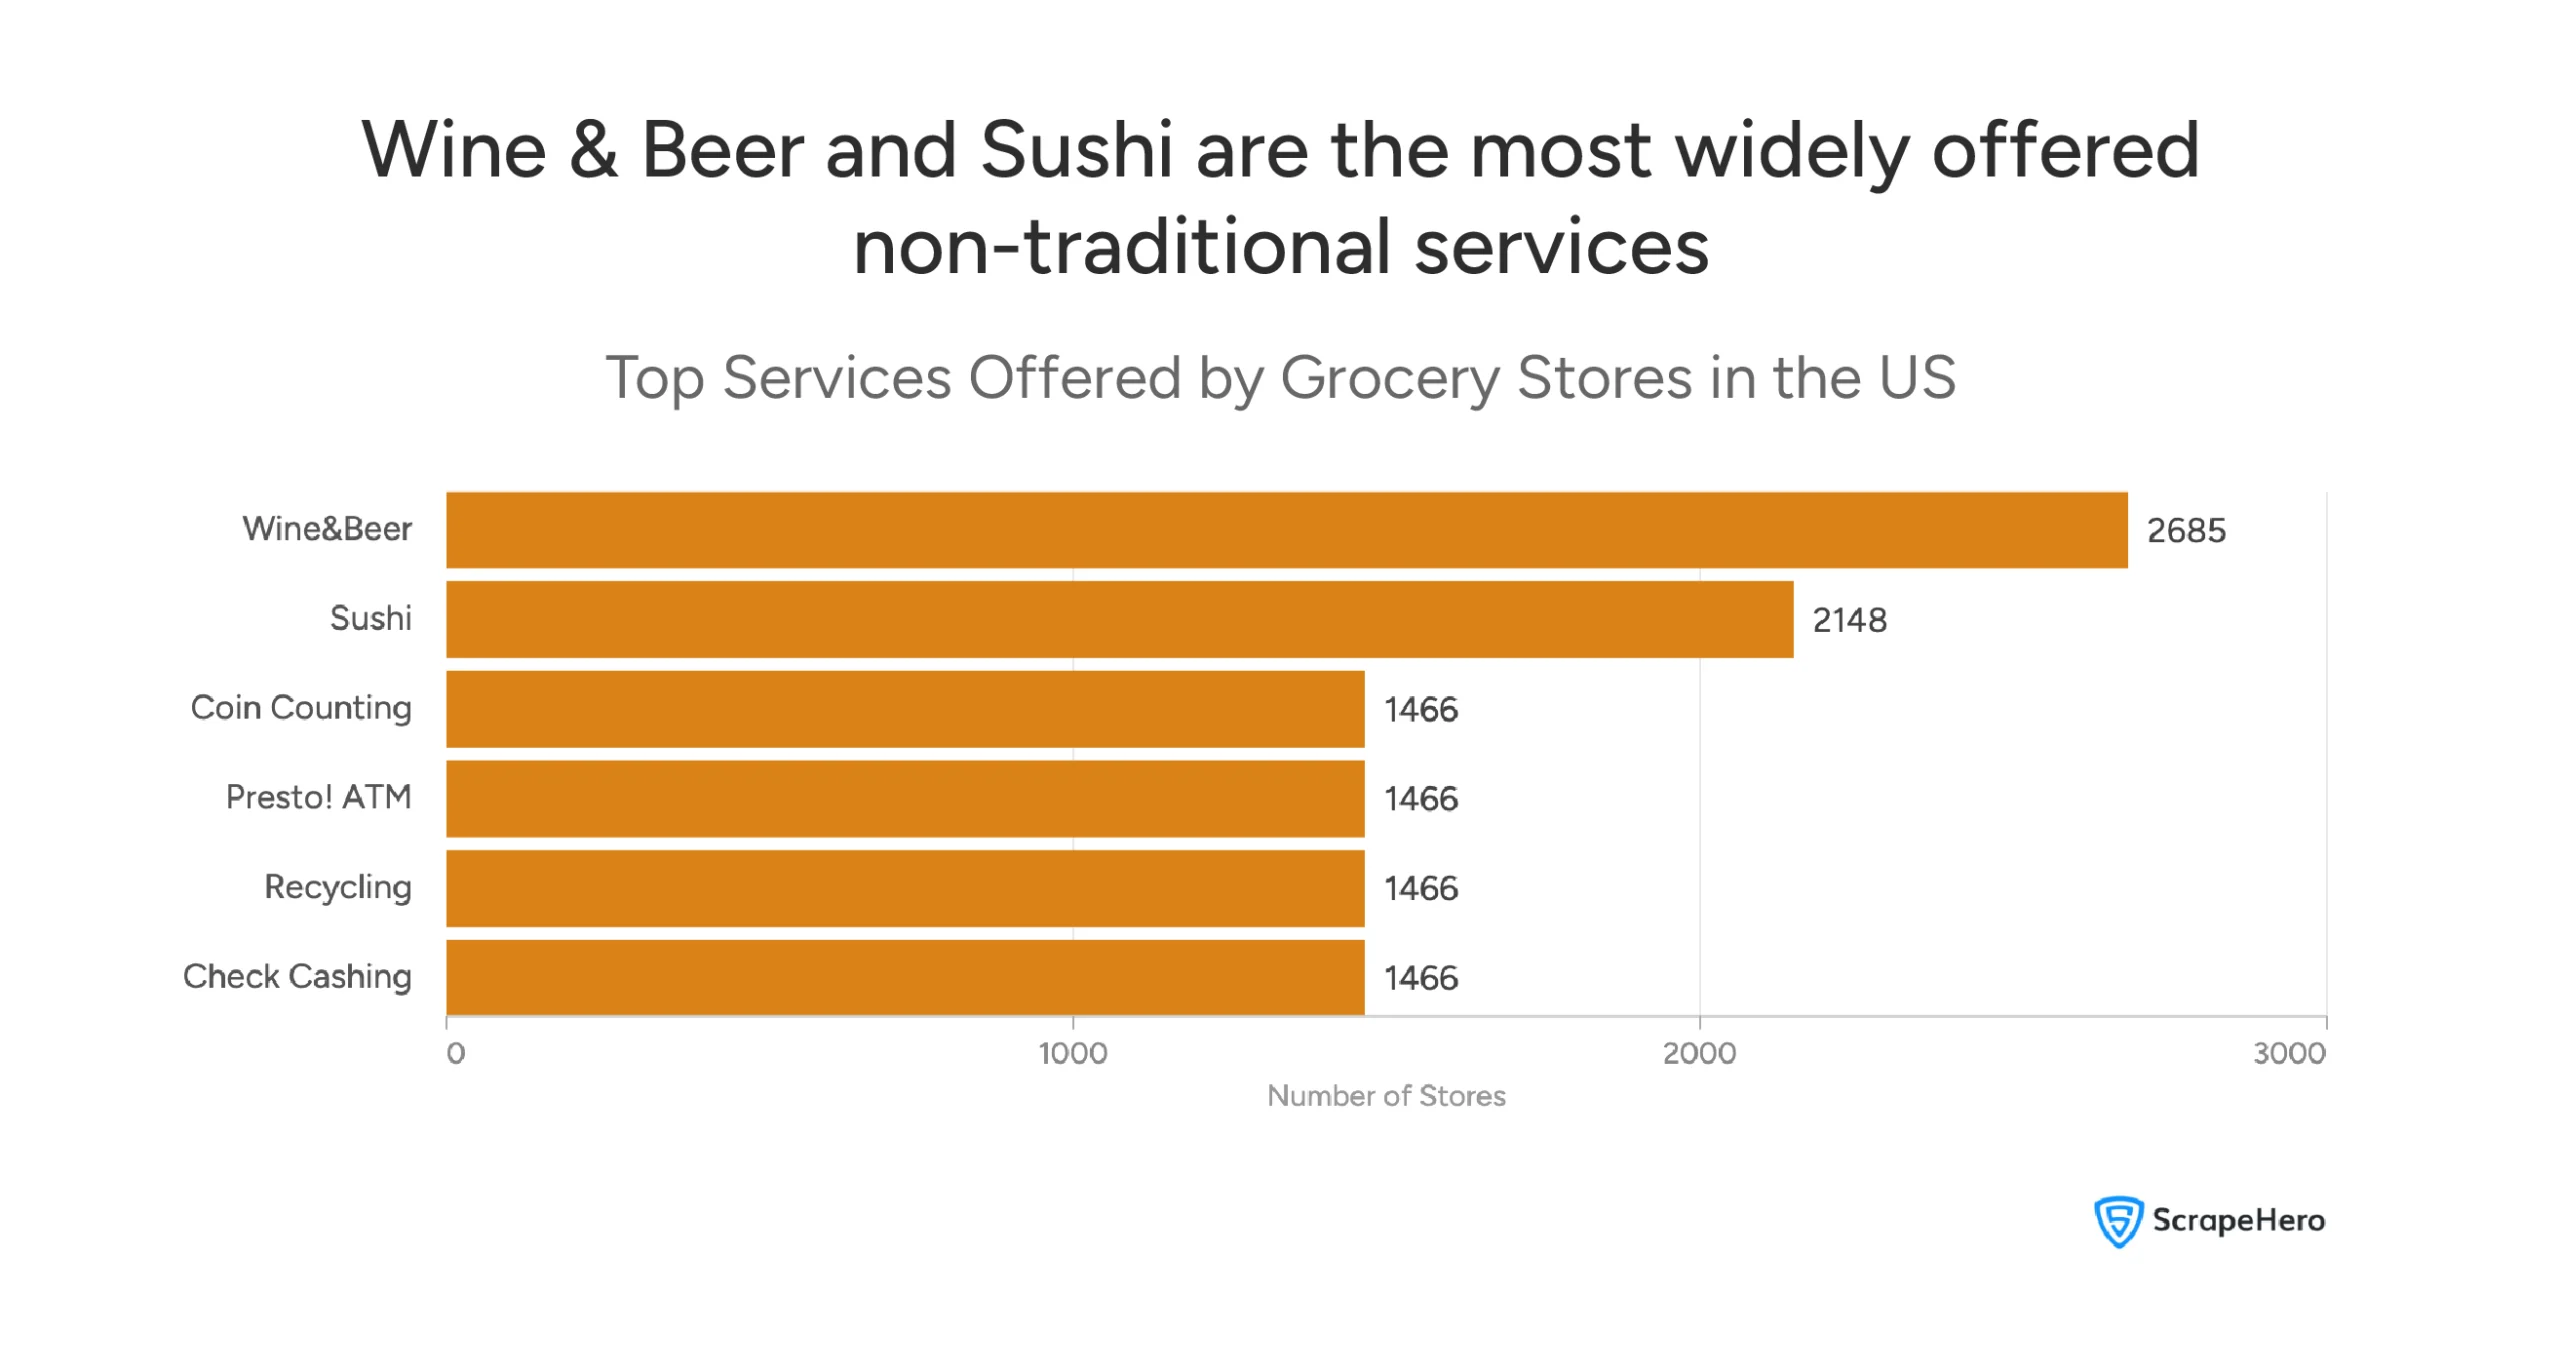
What Services Are Most Common in US Grocery Stores?
Wine & Beer is the most widely available service across US grocery stores, present in 2,685 locations.
Sushi follows at 2,148 stores, reflecting a growing consumer appetite for prepared and ready-to-eat food options in grocery settings.
The top services by store count:
- Wine & Beer – 2,685 stores
- Sushi – 2,148 stores
- Coin Counting – 1,466 stores
- Presto! ATM – 1,466 stores
- Recycling – 1,466 stores
- Check Cashing – 1,466 stores
What Do the Most Common Departments Tell Us?
Beyond services, core departments reveal what grocery stores consider non-negotiable offerings for their customers.
According to our analysis, these were the most common departments found in US grocery stores:
- Meat – 1,581 stores
- Produce – 1,466 stores
- Seafood – 1,466 stores
- Floral – 1,466 stores
The Meat department edges ahead as the most common, present in 1,581 stores.
Produce, Seafood, and Floral each appear in 1,466 stores.
Industry Performance: Revenue and Foot Traffic Trends
The US grocery industry is large, resilient, and recovering. Despite years of flat growth, 2026 marks a turning point, and physical stores remain firmly at the center of how Americans buy food.
How Is the Grocery Industry Performing Financially?
According to IBISWorld, the US supermarket and grocery store industry has been expanding at a sluggish CAGR of 0.4% over the past five years, rising 1.3% in 2026 alone to reach $912.4 billion.
Key financial metrics shaping the industry:
- Total industry revenue (2026): $912.4 billion (IBISWorld)
- 5-year CAGR: 0.4%—slow but stable
- Online grocery revenue (2025): $166.3 billion, growing at a CAGR of 2.3% (IBISWorld)
- Walmart’s total revenue: $693.15 billion—making it the highest-earning food retailer by a significant margin
The Post-Pandemic Recovery: Foot Traffic Analysis
Grocery stores took a hit in 2020. But they’ve come back stronger than before.
Foot traffic fell 11.4% in 2020 from 2019, but has since bounced back to pre-pandemic levels in 2022 and continued rising, reaching nearly 17.2 billion visits in 2024, 10.9% above 2019 levels.
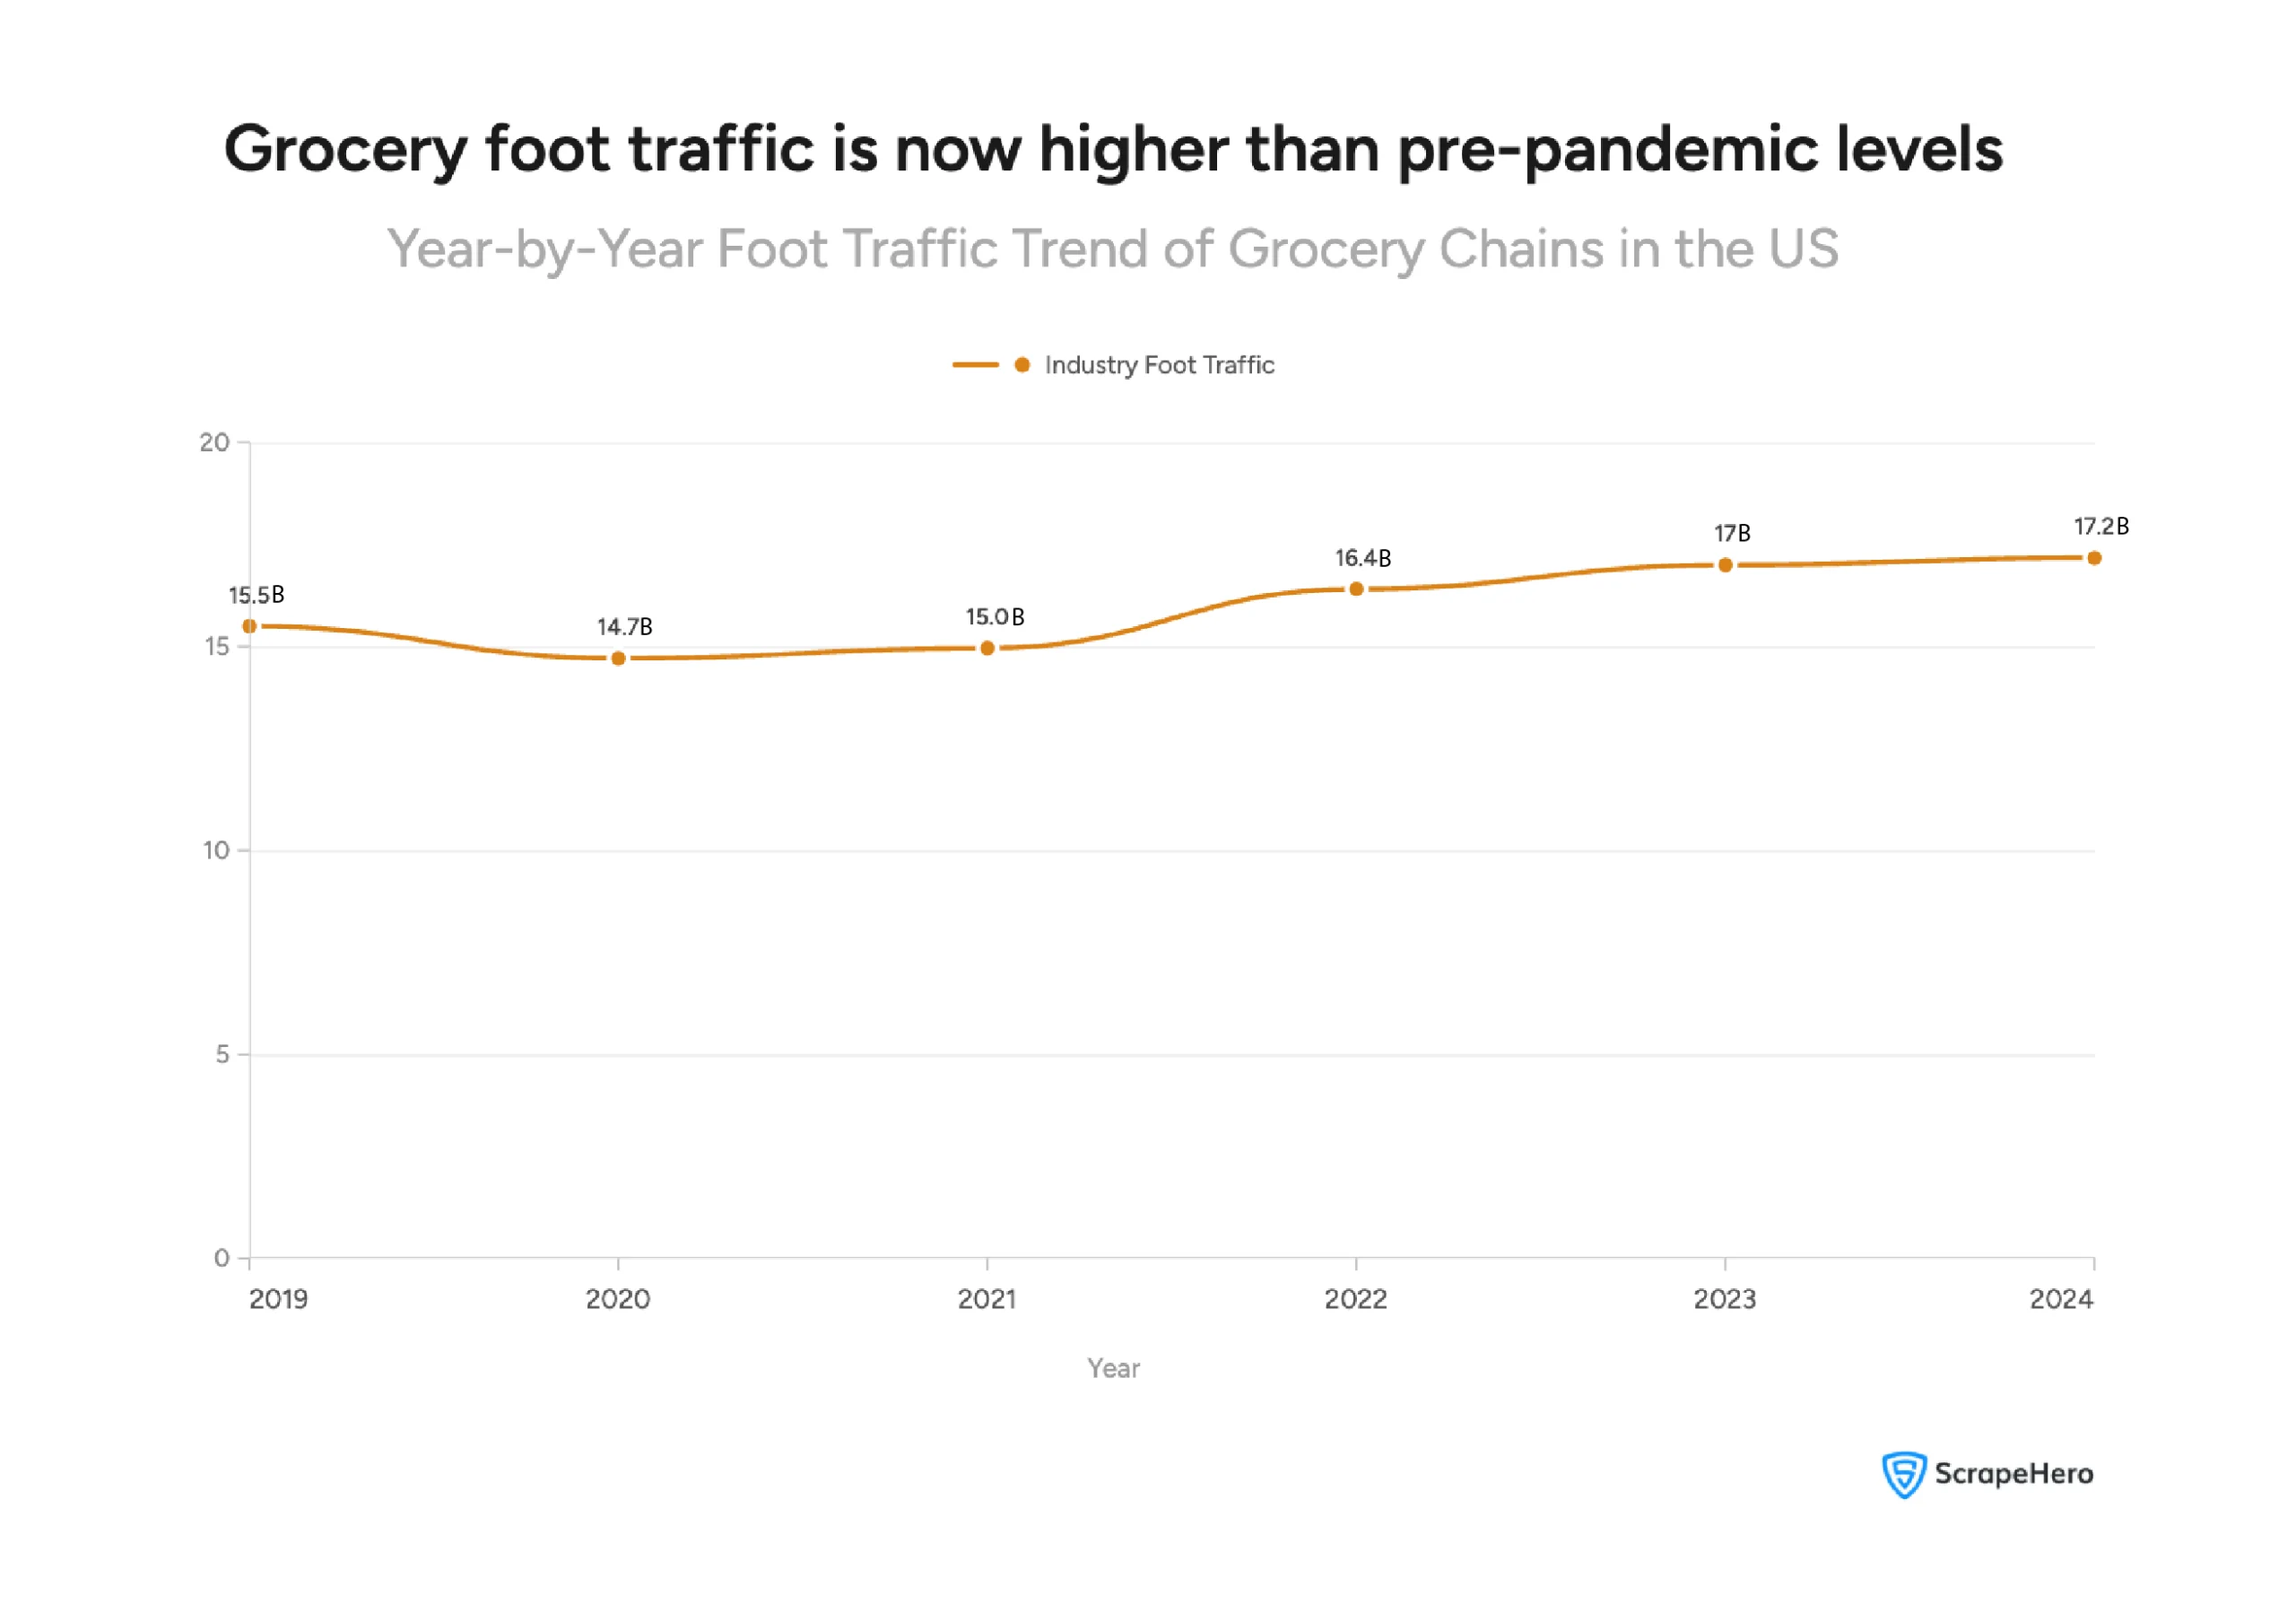
Source: JLL Research, U.S. Census Bureau
What the Data Tells Us About the US Grocery Landscape
The US grocery market is large, competitive, and far more nuanced than a simple store count ranking suggests. A few clear themes emerge from this analysis.
- National scale doesn’t equal regional dominance. Walmart leads nationally with 4,592 stores, but Publix owns Florida and Albertsons Companies owns California. Understanding regional dynamics matters as much as national rankings, sometimes more.
- Geographic breadth and store density are different strategies. Trader Joe’s operates in 43 states with just 608 stores. Food Lion has 1,110 stores across only 10 states. Both approaches can work, the data simply shows they serve different competitive purposes.
- Grocery stores are no longer just grocery stores. Wine & Beer sections in 2,685 stores, Sushi counters in 2,148, financial services and recycling programs across 1,466 stores each, the modern grocery store has become a multi-service community hub.
- Physical retail is holding its ground. Despite the rise of online ordering, foot traffic hit 17.2 billion visits in 2024, 10.9% above pre-pandemic levels. Americans are visiting grocery stores more than ever.
- The industry’s growth is modest but stable. A 5-year CAGR of 0.4% and $912.4 billion in 2026 revenue tell the story of a mature, resilient market, not a declining one.
Who Should Pay Attention to This Data?
This analysis has different implications depending on your perspective:
- Investors and analysts – Regional dominance patterns reveal where consolidation opportunities and competitive risks lie
- Retail strategists – Service and department trends signal where consumer expectations are heading
- Real estate developers – ZIP code saturation data highlights underserved markets worth evaluating
- Market researchers – City and county-level concentration data provides granular competitive intelligence
Where Does the Data Come From?
The location data used in this analysis was sourced from the ScrapeHero Data Store. We monitor thousands of brands globally for store openings, store closures, parking availability, in-store pickup options, services, subsidiaries, nearest competitor stores and much more.
Population data referenced in the ZIP code section is sourced from city-data.com. Revenue and industry performance data is sourced from IBISWorld. Foot traffic data is sourced from JLL’s Grocery Tracker.
Want Data for an Analysis Effortlessly?
The most effortless way to get data for an analysis is to outsource to a web scraping service like ScrapeHero.
Outsourcing with ScrapeHero’s web scraping service is the smarter choice if you require custom data extraction, complex web navigation, or simply want to save time.
We are among the top 3 global web scraping services. And since we are a full-service data provider that handles everything, including data collection, accuracy, and delivery, you don’t need software, hardware, or scraping expertise. Instead, you can focus on using data for your business, not extracting it.
Connect with ScrapeHero today.
Report by ScrapeHero using publicly available data. This report is independent and not affiliated with any grocery chains in the US.
Frequently Asked Questions About US Grocery Chains
Walmart leads by store count with 4,592 locations across 52 states. However, it is classified as a department store under NAICS rather than a pure grocery retailer. Among dedicated grocery chains, ALDI leads with 2,580 locations.
IBISWorld puts the number of supermarket and grocery store businesses at 77,543 as of 2026. The figure varies depending on how broadly “grocery store” is defined.
The US grocery industry reached $912.4 billion in revenue in 2026, growing at a 5-year CAGR of 0.4%. It is a mature but stable market.
Highly competitive. The top four grocery firms’ combined market share rose from 42.5% in 2000 to 67% in 2023 IBISWorld—meaning the industry is consolidating around a smaller number of dominant players.
Highly competitive. The top four grocery firms’ combined market share rose from 42.5% in 2000 to 67% in 2023 IBISWorld—meaning the industry is consolidating around a smaller number of dominant players.
Publix, with 908 locations—62% of its entire US footprint in one state. Walmart (341) and ALDI (274) follow.
California leads with 1,736 locations, followed by Florida (1,644) and Texas (1,111).
The most common are Wine & Beer (2,685 stores) and Sushi (2,148 stores). Financial services—ATMs, Coin Counting, Check Cashing—and Recycling are each available in 1,466 stores.
No—both are growing. Online grocery accounts for 7.1% of grocery sales, while physical foot traffic hit 17.2 billion visits in 2024, surpassing pre-pandemic levels.
The average US household spends $170 per week on groceries, and the average supermarket completes 13,500 transactions per week.
ScrapeHero’s Data Store provides verified POI datasets for all major US grocery chains, including addresses, coordinates, and opening hours. Download instantly or contact the team for custom data solutions.