About This Report
This analysis examines 18 major automobile dealer brands operating across Australia. The POI (Point of Interest) data used in this report was sourced from the ScrapeHero Data Store, a repository of ready-to-use location data across hundreds of business categories globally.
The dataset covers 1,962 stores across 655 cities, 474 postcodes, and all 8 Australian states and territories. Sales figures referenced throughout are sourced from the Australian Automotive Dealer Association (AADA) and the Federal Chamber of Automotive Industries (FCAI).
Key Findings
- Toyota dominates Australia’s dealer network with 323 stores across 294 postcodes, nearly 70% more stores than its nearest competitor, Mitsubishi (194).
- New South Wales is Australia’s automotive hub, accounting for 33% of all dealership locations and ~30% of national new vehicle sales in 2025.
- Tesla generates the highest sales per store of any brand analyzed, 28,900 units across just 13 locations, averaging ~2,223 sales per store annually.
- Premium brands cluster deliberately– Lamborghini, Porsche, and Audi concentrate almost exclusively in Australia’s highest-income cities, with postcode coverage as low as 5.
- Electric and hybrid vehicles are accelerating fast– BEV market share hit a record 16.4% in April 2026, up from 4% in the period covered by this dataset.
- The mass-market and luxury segments operate by entirely different rules– the brands with the widest networks do not always generate the highest sales, and the brands with the fewest stores are not always the weakest performers.
How Big Is the Automotive Industry in Australia?
Australia’s automobile dealer industry is large, established, and growing. According to AADA, 3,910 dealers operate across the country, generating $91.3 billion in annual turnover.
That makes it one of the most significant retail sectors in the Australian economy.
To put that in perspective, in 2025, Australians bought 1,241,037 new vehicles, the highest number ever recorded in a single year. That figure, reported by the Federal Chamber of Automotive Industries (FCAI), reflects a market that has grown consistently over the past decade despite global supply disruptions and rising interest rates.
This analysis focuses on 18 of the most prominent brands operating within that market. Together, they account for 1,962 stores across 655 cities, 474 postcodes, and all 8 states and territories.
What the numbers cover:
- 18 major automobile dealer brands
- 1,962 total store locations
- 655 cities and towns
- 474 distinct postcodes
- 8 states and territories
That spread, with nearly 2,000 stores across almost 500 postcodes, gives a clear picture of how Australia’s automotive dealer network is structured, where it is concentrated, and where the gaps are.
Australia’s new car market has now set back-to-back sales records- 1,237,000 units in 2024, followed by 1,241,037 in 2025. Demand for new vehicles in Australia has never been higher. Source: FCAI
What Is the Structure of the Automotive Dealer Network in Australia?
Australia’s automotive dealer network is not evenly distributed. A small number of mass-market brands dominate the landscape, while premium and niche brands operate with deliberate restraint.
The data covers 18 brands — from Toyota’s 323-store national network to Lamborghini’s 10 carefully placed locations.
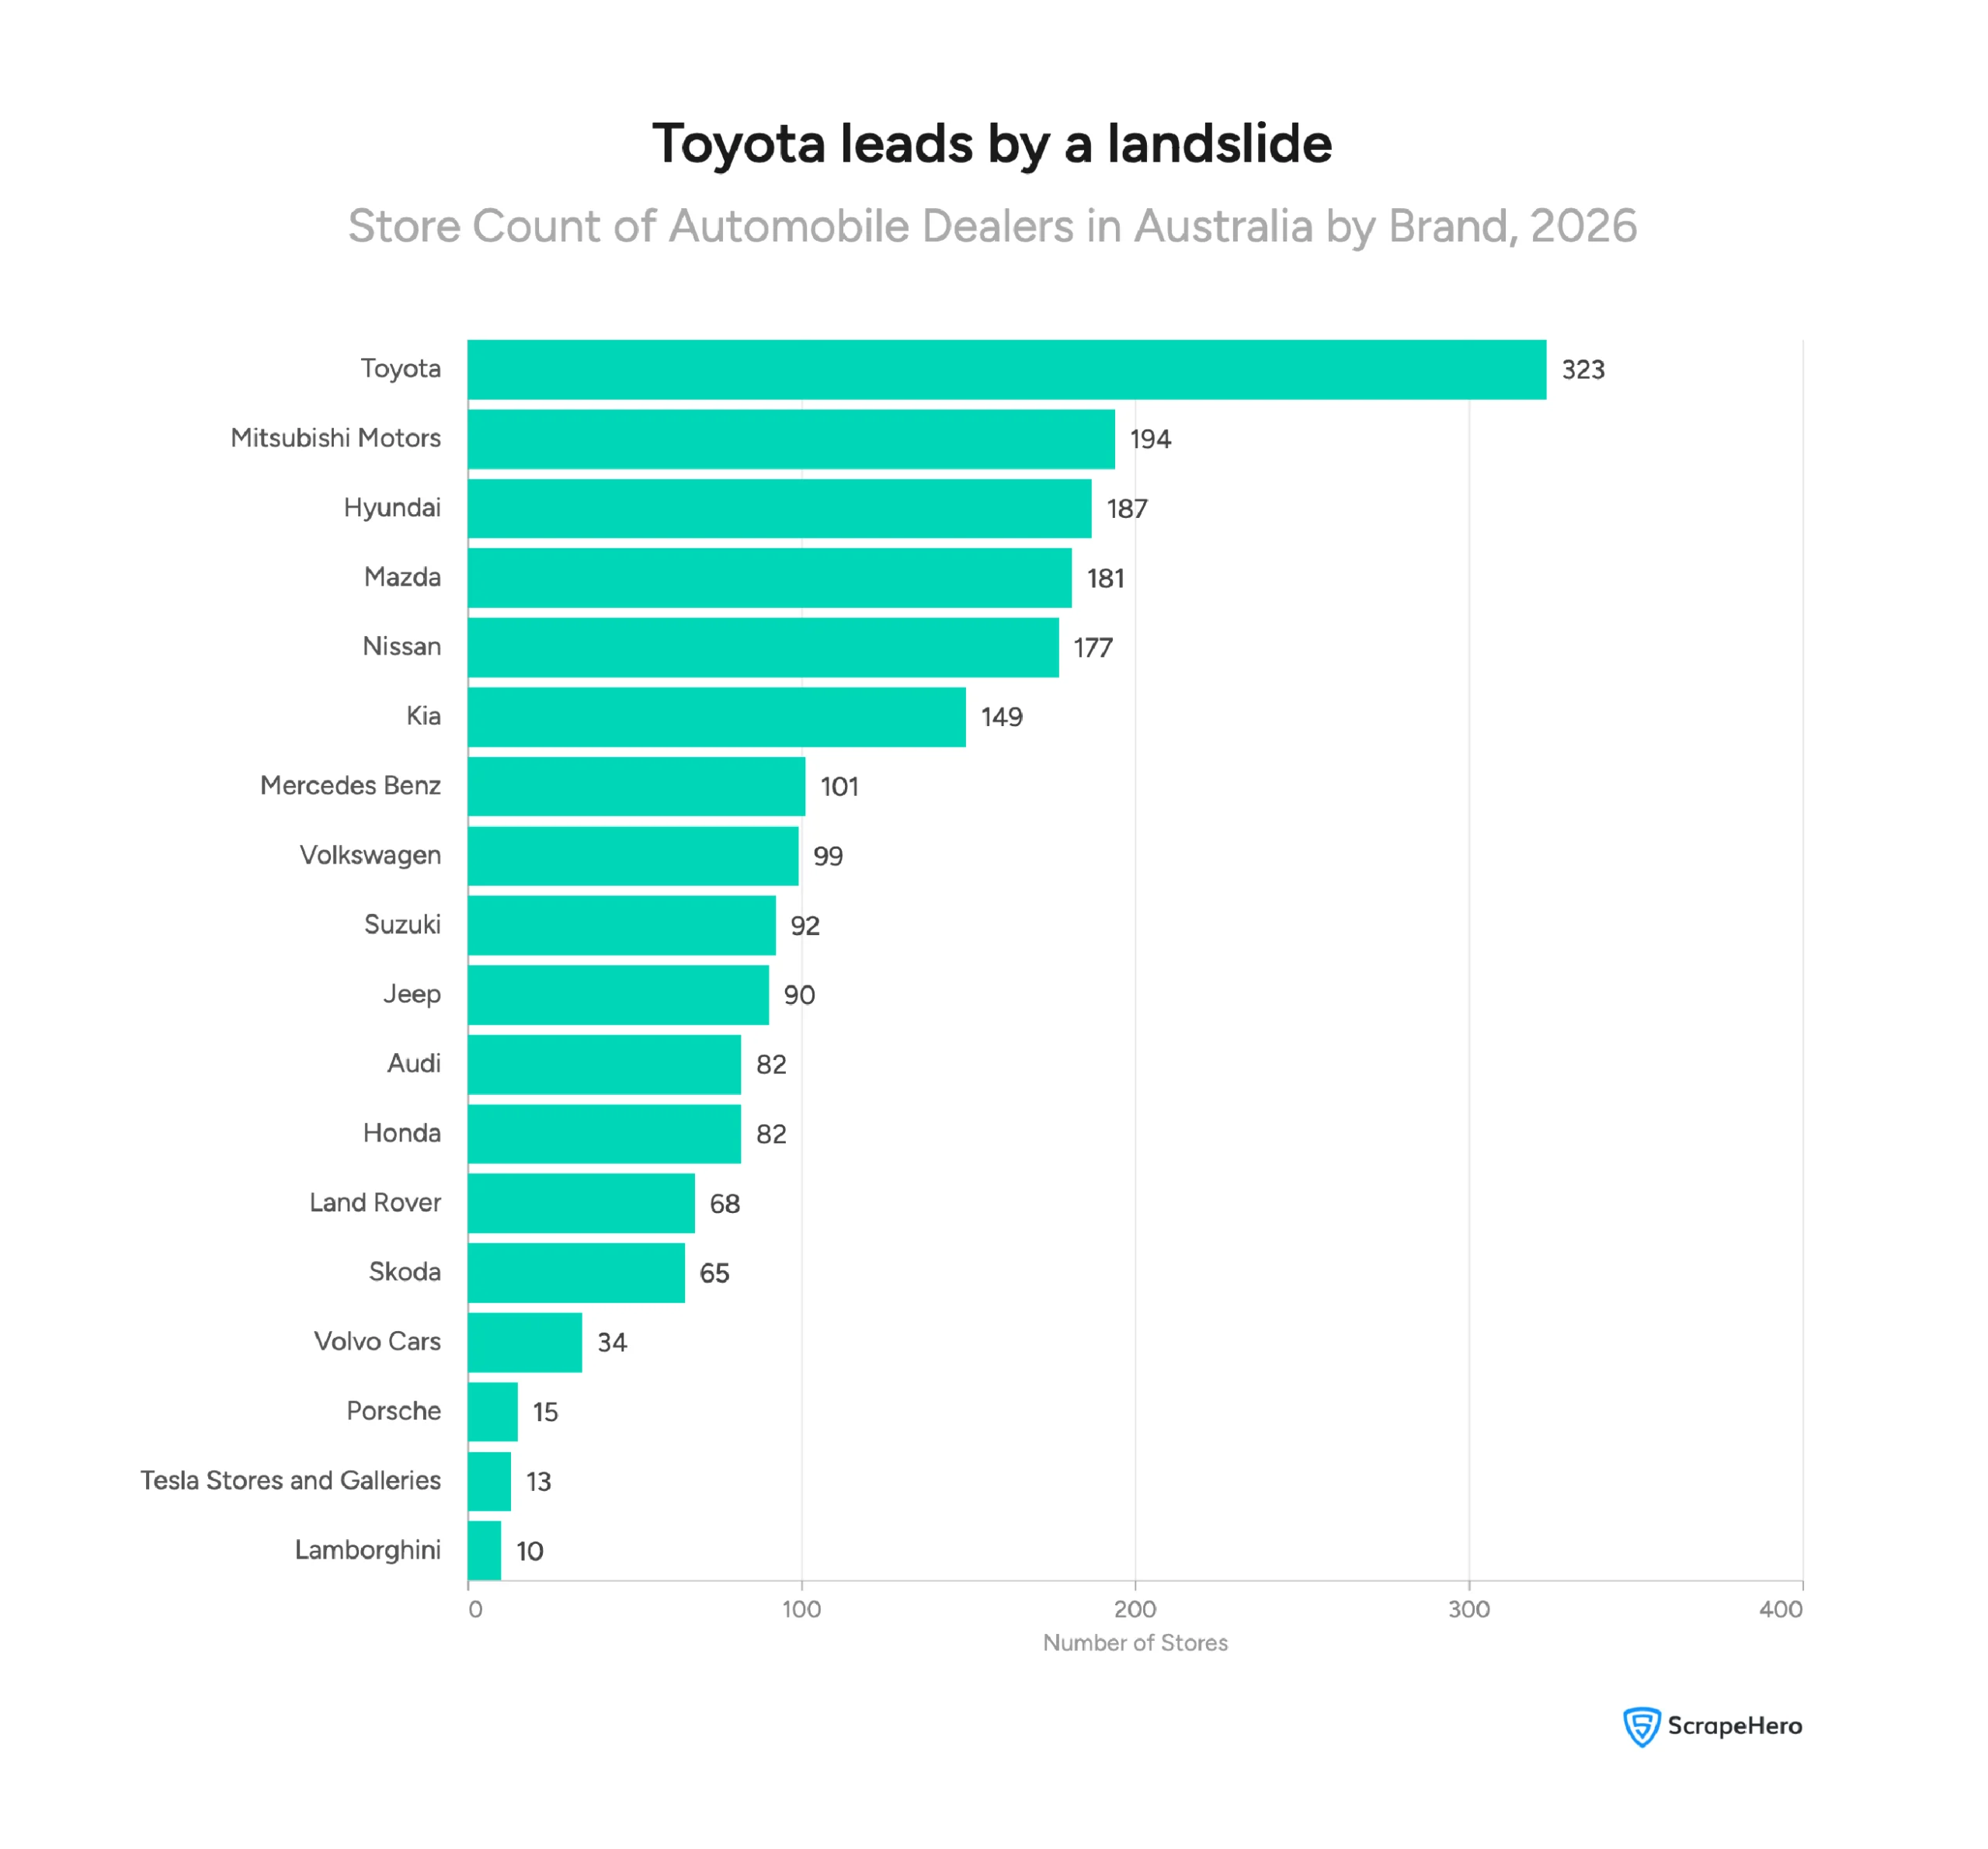
The gap between Toyota (323 stores) and every other brand is the first thing the data makes clear. Mitsubishi comes second at 194, a difference of 129 stores.
Want to download the complete list of all Toyota locations in Australia?
The “100+ store” brands form the backbone of the network:
- Toyota — 323 stores
- Mitsubishi Motors — 194 stores
- Hyundai — 187 stores
- Mazda — 181 stores
- Nissan — 177 stores
- Kia — 149 stores
- Mercedes-Benz — 101 stores
These seven brands account for the majority of dealership locations in Australia.
The majority of these brands are volume-driven, built on broad geographic reach and everyday accessibility.
Below this group, the network thins considerably. Volkswagen (99), Suzuki (92), Jeep (90), Audi (82), and Honda (82) sit in a mid-tier cluster. Then come Land Rover (68), Skoda (65), and Volvo (34), brands with selective but stable presences.
At the far end sit Porsche (15), Tesla (13), and Lamborghini (10). These are not underperforming networks. They are intentional ones.
How Far Does Each Brand Actually Reach?
Store count tells you how many locations a brand operates. Postcode coverage tells you how many communities it actually serves. The two are related, but not always in proportion.
| Network Reach | Brands | Postcode Coverage |
|---|---|---|
| Wide reach (150+ postcodes) | Toyota, Mitsubishi, Hyundai, Nissan, Mazda, Kia | 149–294 |
| Moderate reach (50–149 postcodes) | Volkswagen, Suzuki, Mercedes-Benz, Honda, Jeep, Skoda, Land Rover | 59–96 |
| Selective reach (under 50 postcodes) | Audi, Volvo, Porsche, Tesla, Lamborghini | 5–45 |
Toyota again leads, with a presence in 294 distinct postcodes. That means a Toyota dealership is within reach of communities across nearly every corner of the country.
Mitsubishi (193), Hyundai (181), Nissan (177), Mazda (158), and Kia (149) follow closely — all covering 149 postcodes or more.
Seven brands sit in the moderate reach band, covering between 59 and 96 postcodes. These brands maintain a stable, selective presence, enough to serve their core markets without stretching the network thin.
At the other end, five brands cover fewer than 50 postcodes. Porsche covers 15. Tesla, 13. Lamborghini, just 5. These are not underperforming networks; they are deliberate ones, concentrated where their buyers are.
Toyota’s 323 stores span 294 distinct postcodes, more than any other brand in Australia. Lamborghini’s 10 stores, by contrast, cover just 5. That difference is not a gap in ambition. It is a gap in strategy.
Which State Has the Most Car Dealerships in Australia?
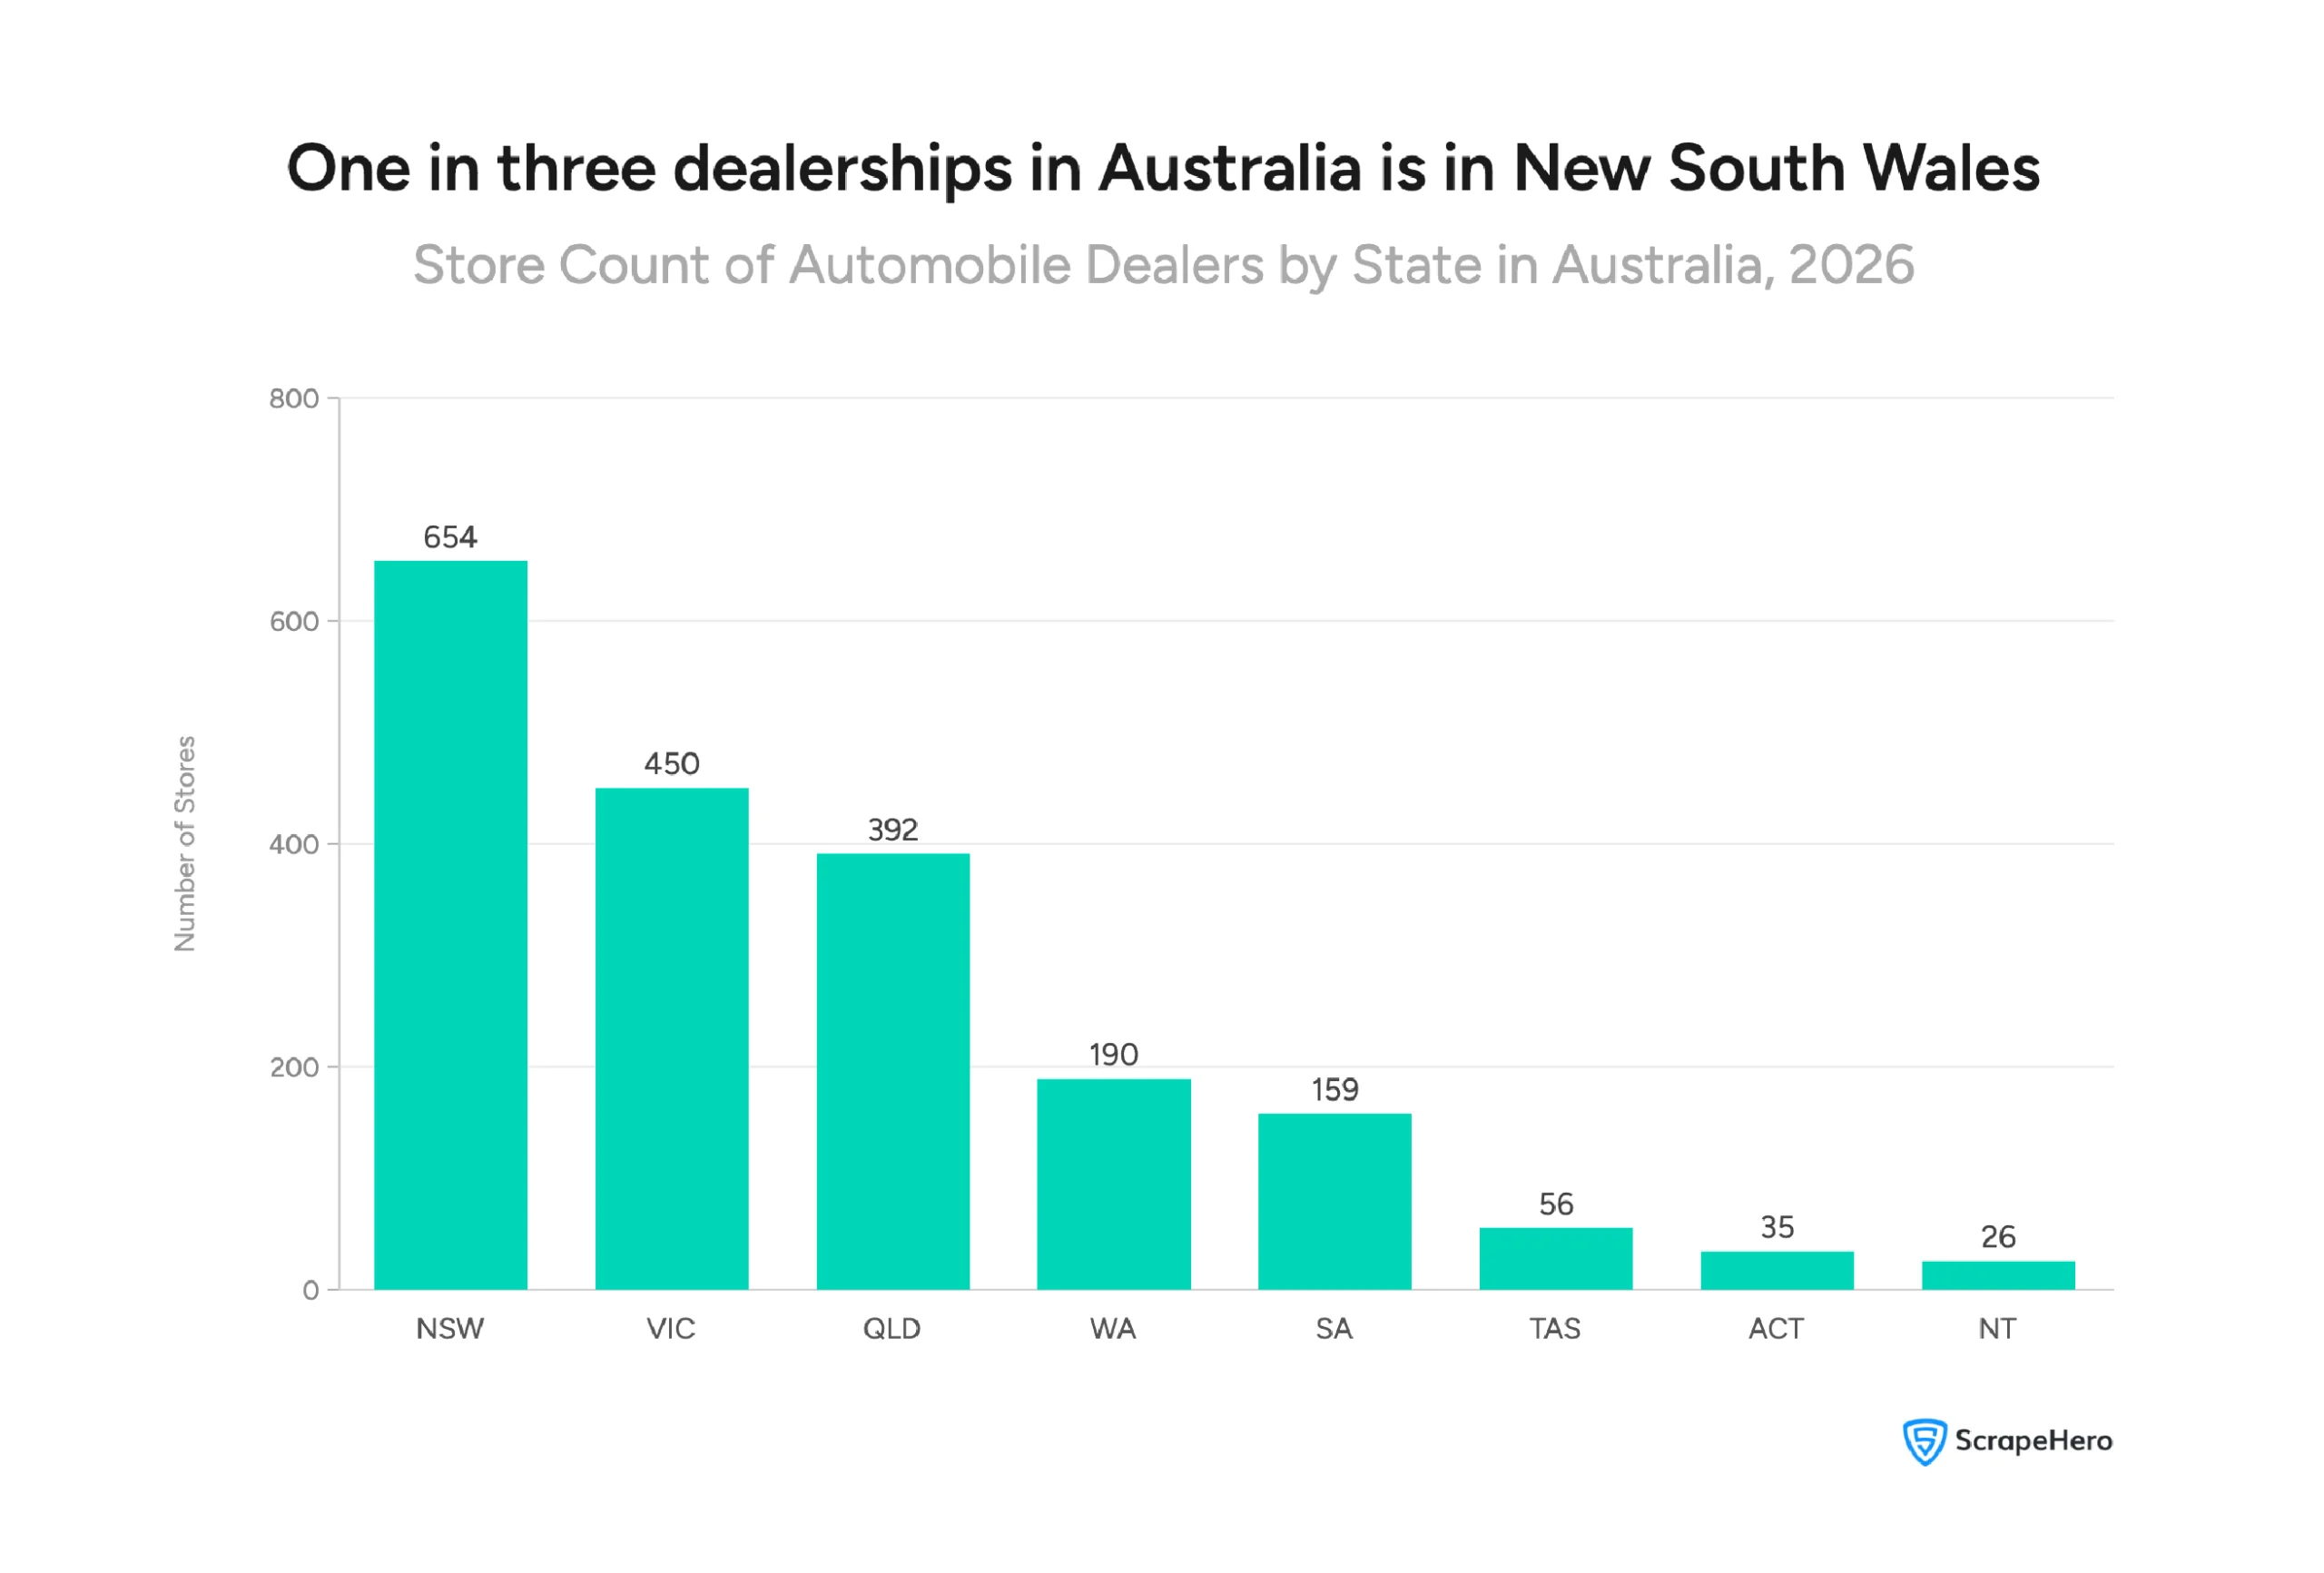
New South Wales has the most car dealerships in Australia. With 654 stores, it accounts for 33% of all dealership locations across the 18 brands analyzed, more than any other state or territory.
Store count by state:
- New South Wales — 654 stores (33%)
- Victoria — 450 stores
- Queensland — 392 stores
- Western Australia — 190 stores
- South Australia — 159 stores
- Tasmania — 56 stores
- Australian Capital Territory — 35 stores
- Northern Territory — 26 stores
NSW, Victoria, and Queensland together account for approximately 77% of all dealership locations in Australia. These are the three most populous states, and the concentration of stores reflects that directly.
The drop-off beyond the top three is significant.
Western Australia and South Australia have between 50% and 70% fewer stores than NSW, despite being large states by land area.
Tasmania, the ACT, and the Northern Territory each have fewer than 60 stores — reflecting smaller populations and more limited market size rather than geographic isolation alone.
This store distribution is not just a reflection of population; it is also a reliable predictor of sales volume. According to FCAI VFACTS 2025 data, NSW, Victoria, and Queensland together accounted for approximately 80% of all new vehicle sales in Australia in 2025. The states with the most dealerships are the states that sell the most cars. Source: FCAI
The ACT and Northern Territory present an interesting case.
Both are territory capitals with established economies, yet each has fewer than 40 stores across all 18 brands.
The data suggests that population size, not economic activity alone, is the primary driver of dealership network decisions in Australia.
Where Do Luxury and Everyday Car Brands Choose to Open Stores?
Not every brand distributes its stores the same way. Where a brand chooses to open and where it deliberately does not says as much about its strategy as its product range.
In Australia’s Most Expensive Cities, Luxury Brands Take Priority
Australia’s five highest median household income cities are Melbourne (VIC), Adelaide (SA), Brisbane (QLD), Sydney (NSW), and Perth (WA).
In these cities, the store distribution looks markedly different from the national picture:
- Audi operates 3 stores in Melbourne- its highest concentration in any single city
- Mercedes-Benz operates 3 stores in Brisbane
- Lamborghini has exactly 2 stores in each of Australia’s five highest-income cities and nowhere else. All 10 of its Australian locations sit exclusively in these wealthy urban centers
- Porsche has a single store in Melbourne
- Skoda maintains one store each in Adelaide and Sydney
Toyota, despite leading the national network by a wide margin, has just one store in Melbourne and one in Adelaide. For a brand with 323 stores nationally, that restraint in high-income cities is notable.
Every single Lamborghini dealership in Australia, all 10 of them, is located in one of the country’s five highest-income cities. Not one store exists outside these areas. That is perhaps the most deliberate geographic strategy in this entire dataset.
In Australia’s Most Affordable Cities, the Picture Shifts
Australia’s five most affordable cities by median household income are Geelong (VIC), Townsville (QLD), Wollongong (NSW), Darwin (NT), and Canberra (ACT).
Here, the dynamic changes considerably:
- Geelong stands out — almost every brand in this dataset has at least one store there, making it the most accessible mid-tier city in Australia
- Audi is the only brand to operate more than one store (2 stores) across most of these cities
- Most brands run a single store per city in this group — enough to establish a presence without committing to full network expansion
- Darwin and Canberra have the most limited brand presence of all five, despite being administrative capitals
Which Brands Sell the Most And Which Make the Most of Every Store?
Store count tells you how wide a brand’s network is. Sales figures tell you how much demand that network serves.
But the most revealing metric is the relationship between the two — how many vehicles each store sells on average.
That ratio surfaces something no standalone sales report or dealer directory shows on its own: network efficiency.
Who Sells the Most Cars in Australia?
Toyota is the clear leader. In 2025, it sold 239,900 vehicles — more than double the sales of its nearest competitor, Mazda (91,900).
That dominance spans both network size and sales volume, making Toyota the most significant brand in this dataset by every measure.
| Brand | 2025 Sales | Stores | Sales per Store |
|---|---|---|---|
| Toyota | 239,900 | 323 | ~742 |
| Mazda | 91,900 | 181 | ~508 |
| Kia | 82,100 | 149 | ~551 |
| Hyundai | 77,200 | 187 | ~413 |
| Mitsubishi | 61,200 | 194 | ~315 |
| Nissan | 35,500 | 177 | ~200 |
| Volkswagen | 32,000 | 99 | ~323 |
| Tesla | 28,900 | 13 | ~2,223 |
| Mercedes-Benz | 22,900 | 101 | ~277 |
| Honda | 22,000 | 82 | ~268 |
| Suzuki | 18,000 | 92 | ~196 |
| Audi | 16,000 | 82 | ~195 |
| Skoda | 8,500 | 65 | ~131 |
| Volvo | 7,200 | 34 | ~212 |
| Jeep | 6,000 | 90 | ~67 |
| Land Rover | 5,200 | 68 | ~76 |
| Porsche | 5,133 | 15 | ~342 |
| Lamborghini | 140 | 10 | 14 |
Source: AADA
Which Brand Makes the Most of Every Store?
The sales-per-store column is where the data gets interesting.
- Tesla stands apart.
- With just 13 stores generating 28,900 sales, Tesla averages approximately 2,223 vehicles per store annually — by far the highest ratio in this dataset. No other brand comes close.
- Porsche performs strongly relative to its size.
- At ~342 sales per store across 15 locations, it outperforms several brands with significantly larger networks — including Mercedes-Benz (~227), Honda (~268), and Nissan (~200).
- Mitsubishi presents the sharpest contrast.
- It has the second-largest network in Australia (194 stores) but ranks fifth in total sales (61,200 units) — producing just ~315 sales per store.
- Compared to Kia, which generates ~551 sales per store from 149 locations, Mitsubishi’s network appears to be carrying more locations than its current sales volume justifies.
- Jeep and Land Rover sit at the lower end.
- At ~67 and ~76 sales per store respectively, both brands generate relatively modest volume across fairly wide networks.
According to Pitcher Partners’ analysis of Australia’s automotive industry, brands averaging fewer than 14 new vehicle sales per month per dealership rooftop — roughly 168 annually — face serious viability questions. Cross-referencing that threshold against this dataset, Jeep (67 per store), Land Rover (76), and Lamborghini (14) fall below or near that benchmark. Source: Pitcher Partners, December 2025
How Is the Australian Car Market Shifting Toward EVs and Hybrids in 2026?
Petrol and diesel still dominate Australian car sales. But their share is shrinking — and the data shows the shift is accelerating faster than most expected.
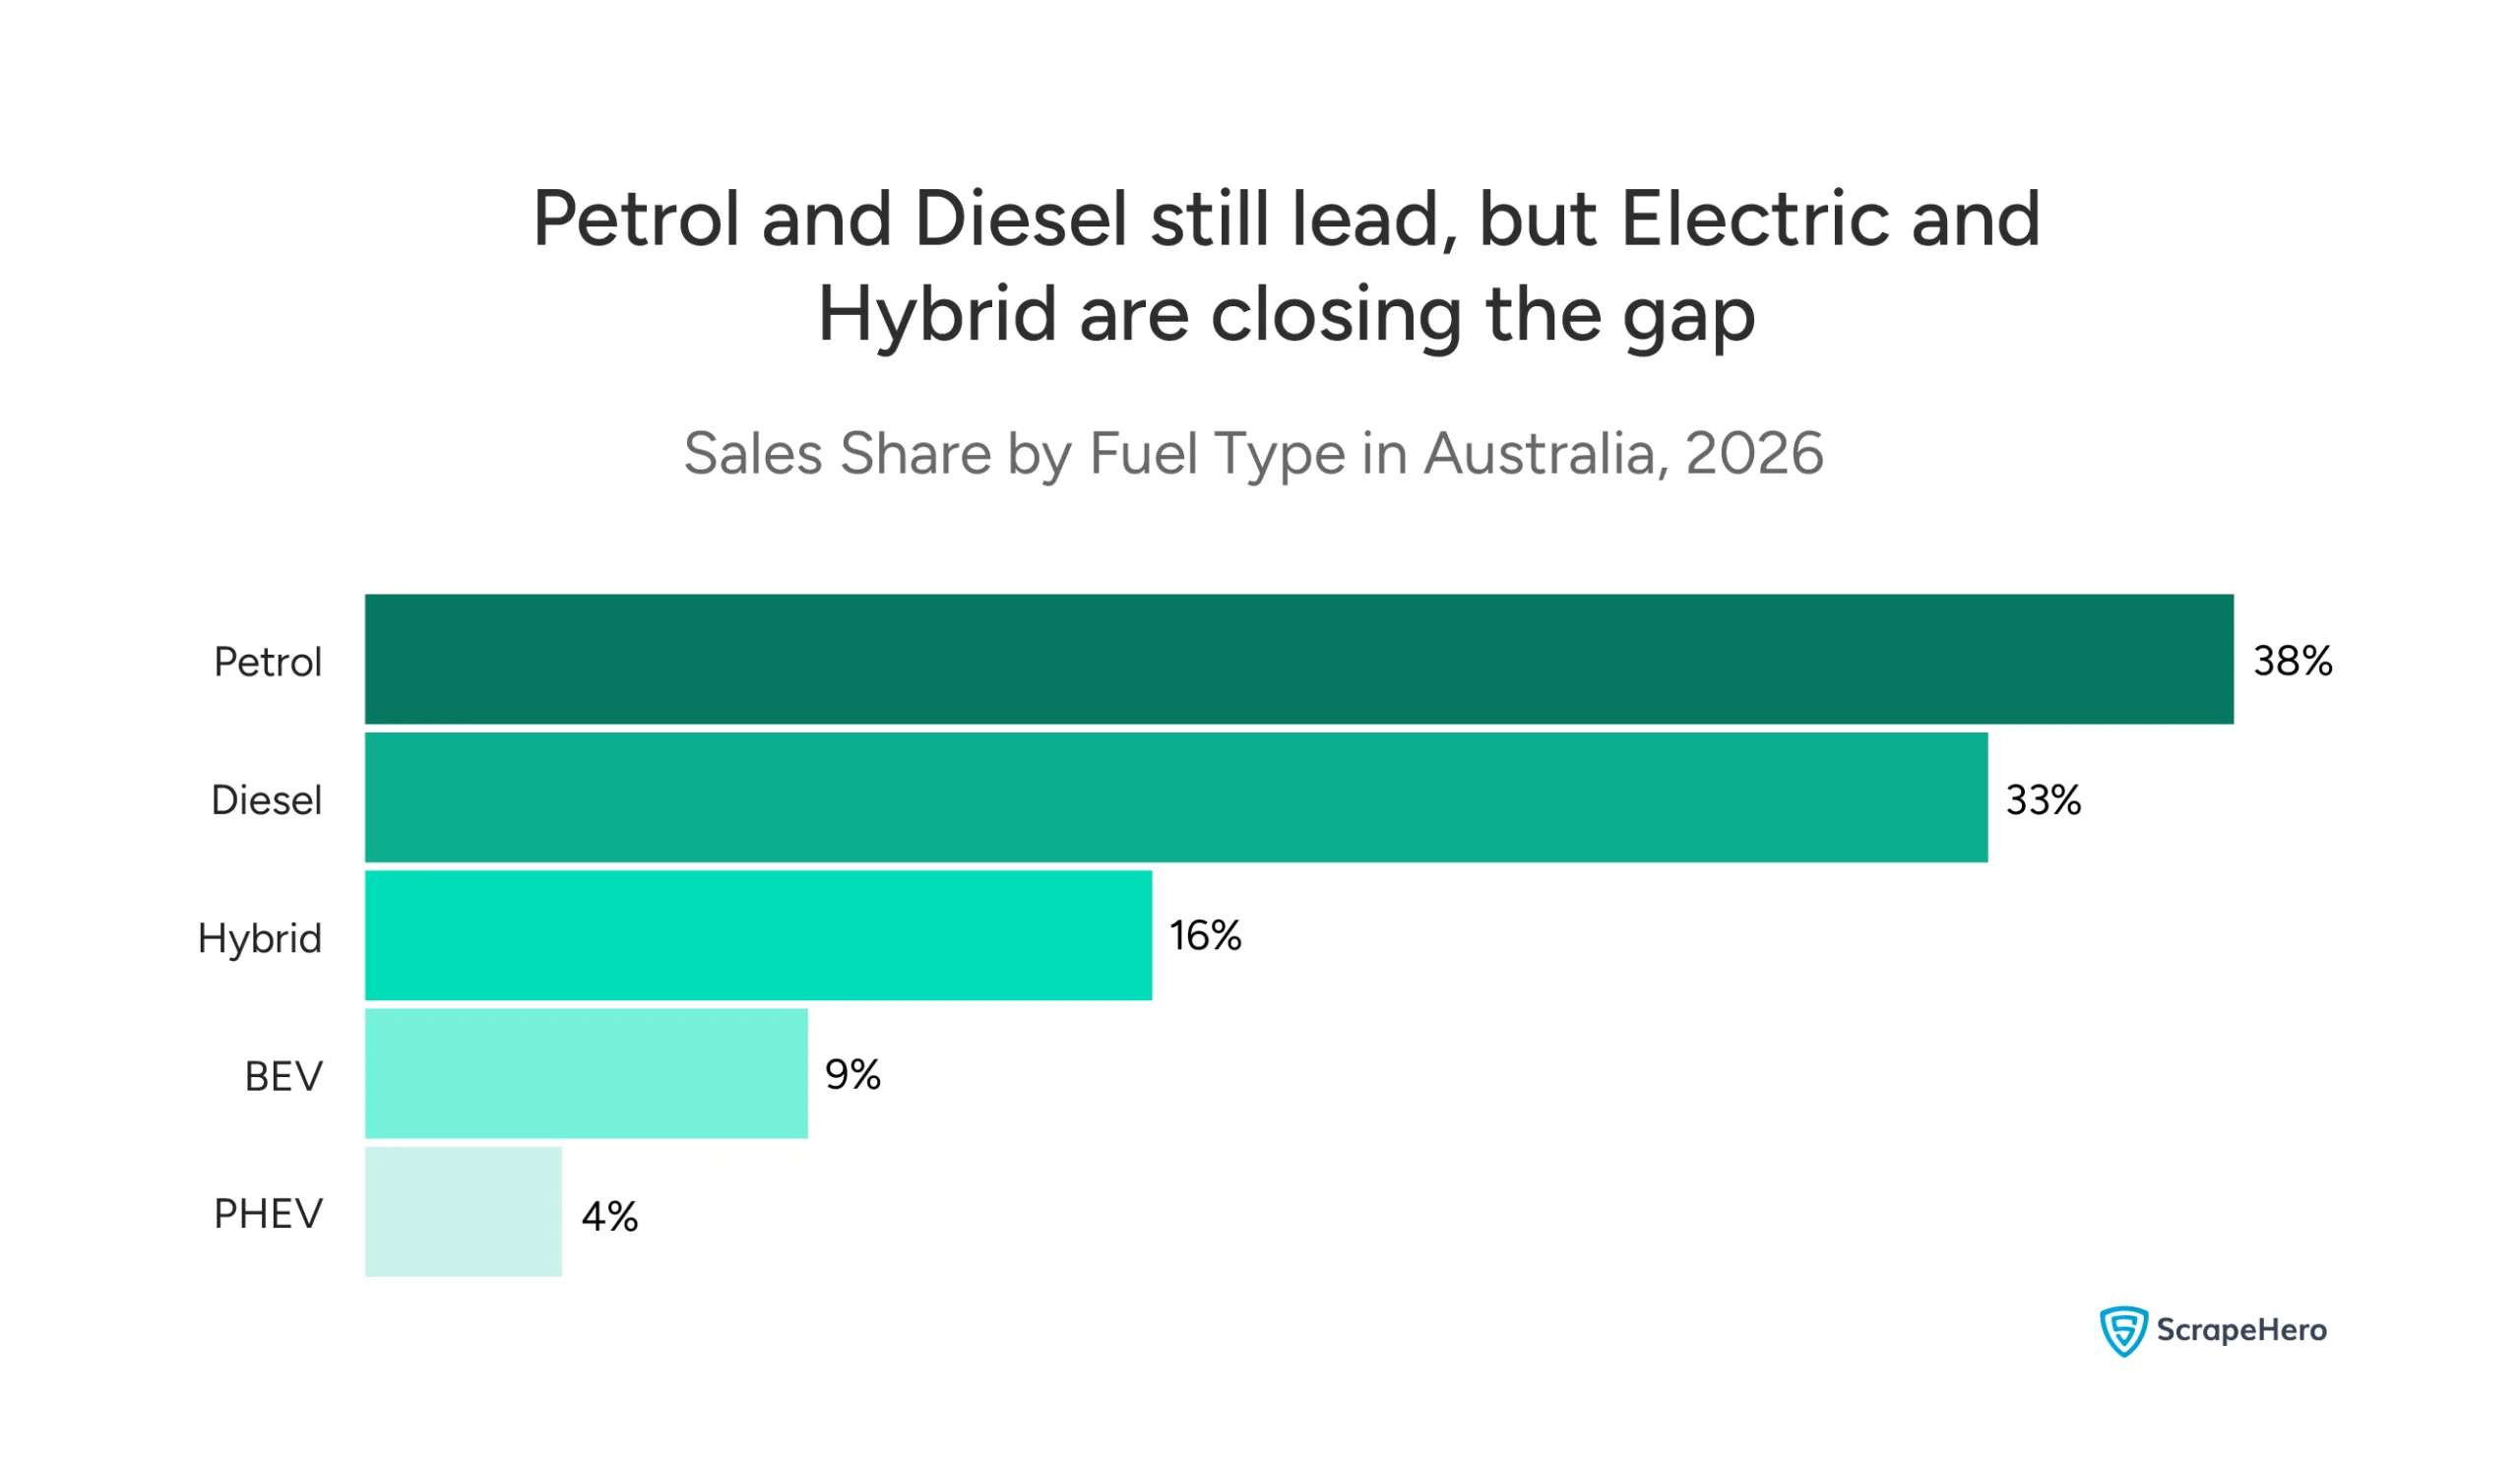
According to AADA data, petrol vehicles account for 38% of new vehicle sales in Australia, with diesel at 33%.
Together, traditional fuels still represent nearly three-quarters of the market.
Hybrid vehicles have established a firm foothold at 16%, the third largest share in the market. PHEVs (plug-in hybrid electric vehicles) account for 9%. Battery electric vehicles (BEVs) sit at 4%.
What Does This Mean for Dealership Networks?
The shift in fuel types has direct implications for how dealership networks are structured — and which brands are best positioned for what comes next.
Tesla is the clearest example in this dataset. Thirteen stores. 28,900 sales. A sales-per-store ratio that no traditional dealership network in Australia can match. Tesla’s model, built entirely around electric vehicles and direct-to-consumer sales, was designed for exactly the market conditions now emerging.
But Tesla is not the only story. Beyond the established networks in this analysis, a new wave of brands is rapidly building its presence across Australia.
BYD, GWM, and Chery- Chinese manufacturers with growing dealer networks- are not yet represented in traditional POI datasets at scale.
Yet, according to FCAI VFACTS 2025 data, Chinese-manufactured vehicles already account for approximately 20% of total new vehicle sales in Australia, making China the second-largest source of vehicles in the country after Japan. Their physical networks are catching up fast.
Key Takeaways
Australia’s automotive dealer landscape in 2026 is large, concentrated, and shifting. Here is what the data shows:
- Toyota dominates by every measure — 323 stores, 294 postcodes, and 239,900 vehicles sold in 2025. No other brand comes close on any single metric, let alone all three.
- New South Wales is Australia’s automotive hub, 33% of all dealership locations and approximately 30% of national new vehicle sales. Store distribution and sales volume align almost exactly.
- Network size and sales performance do not always move together — Tesla generates ~2,223 sales per store from 13 locations. Mitsubishi generates ~315 from 194. Scale alone does not determine efficiency.
- Luxury brands concentrate deliberately — Lamborghini’s entire Australian network of 10 stores sits exclusively in the country’s five highest-income cities. That is not a limitation. It is a strategy.
- The EV shift is real and accelerating — BEV market share reached a record 16.4% in April 2026, up from 4% in this dataset. The direction of travel is clear.
- A new wave of brands is reshaping the market — Chinese manufacturers now account for approximately 20% of new vehicle sales in Australia. Their physical dealer networks are still forming, but their commercial presence is already significant.
Disclaimer: The data used in this report is sourced from publicly available information. This analysis has been produced independently by ScrapeHero and is not affiliated with, endorsed by, or produced in association with any of the automobile brands. All brand names are the property of their respective owners.
Want to Make Better Decisions in the Australian Market?
ScrapeHero is one of the top 3 web scraping services globally, and unlike most data services, we are fully managed. That means real experts handle your data requirements from start to finish, no technical expertise needed on your end.
In an age where AI drives most of the process, ScrapeHero keeps a human involved at every step, from the initial conversation about your requirements to manual QA before delivery. You get clean, structured, trustworthy data without having to chase it yourself.
Frequently Asked Questions About Automotive Industry Australia
According to IBISWorld, there are 3,910 automobile dealers operating across Australia. This figure covers the full market — from large franchise networks with hundreds of locations to smaller independent operators. This analysis focuses on 18 of the most prominent brands, accounting for 1,962 stores across all 8 states and territories.
Toyota is the largest automobile dealer in Australia by every measure. It operates 323 stores across 294 postcodes — more locations and broader geographic reach than any other brand in this dataset. In 2025, it also led national sales with 239,900 vehicles sold, representing approximately 19.8% of the total market. No other brand comes close on store count, postcode coverage, or sales volume.
Source: AADA; FCAI
New South Wales has the most car dealerships in Australia. Across the 18 brands analysed, NSW accounts for 654 stores — 33% of all dealership locations nationally. Victoria follows with 450 stores, and Queensland third with 392. Together, these three states hold approximately 77% of all dealership locations in Australia, which closely mirrors their share of national new vehicle sales.
Source: ScrapeHero Data Store; FCAI VFACTS 2025
Based on 2025 VFACTS data — the most recent full-year figures available — Toyota was Australia’s best-selling car brand with 239,900 vehicles sold. It was followed by Mazda (91,900), Kia (82,100), Hyundai (77,200), and Mitsubishi (61,200). FCAI publishes updated VFACTS data monthly, so figures for 2026 will build throughout the year.
Source: AADA; FCAI
Quickly. According to AADA data, battery electric vehicles (BEVs) accounted for 4% of new vehicle sales in Australia in the period covered by this analysis. By April 2026, that figure had risen to a record 16.4% — roughly one in every six new vehicles sold. Plug-in hybrid vehicles (PHEVs) also more than doubled in 2025, growing 130.9% compared to 2024. Traditional fuels still hold the majority of the market, but their share is declining year-on-year.
Source: FCAI; Electric Vehicle Council (EVC), April 2026