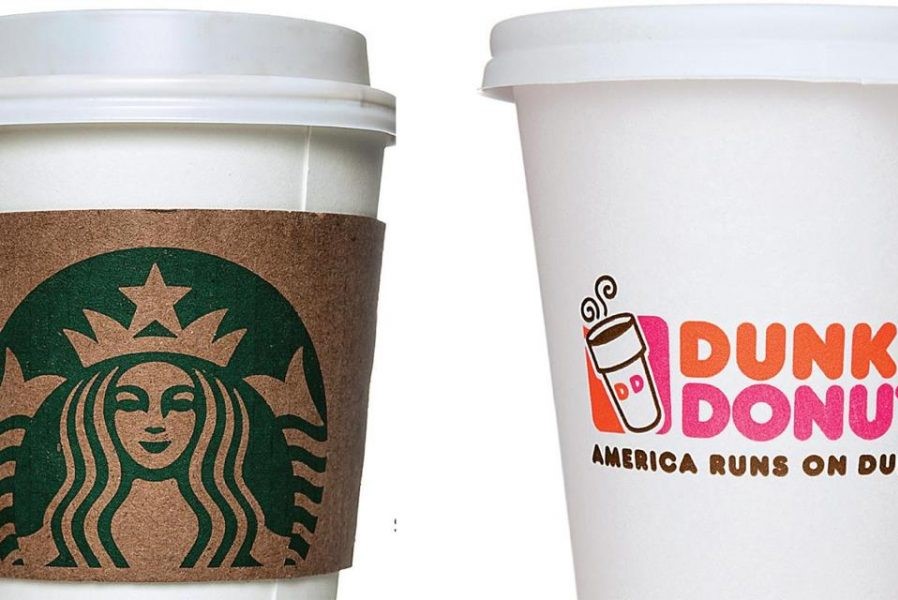
In the US, all coffee lovers are familiar with the most popular coffee chains – Starbucks and Dunkin’. There are many factors that drive consumers to choose from the two. It could be the food and drink options, prices, apps, and atmosphere. These coffee-focused eatery chains have a tight race between them, fighting for the top position as the coffee king for several years.
In this article, we created a comparative analysis of the two largest coffee chains in the US. Several factors such as annual revenue, store locations, demographics, and search trends were taken into consideration.
Insights in Brief
- Starbucks has a higher count of stores than Dunkin’.
- Dunkin’ stores are concentrated in the Northeast and Starbucks stores in urban cities.
- Starbucks has increased revenue and growth in the past years compared to Dunkin’.
- Starbucks is more popular in trending searches than Dunkin’.
Get coffee chains store locations data and more from our data store
Number of Locations – Starbucks vs Dunkin’
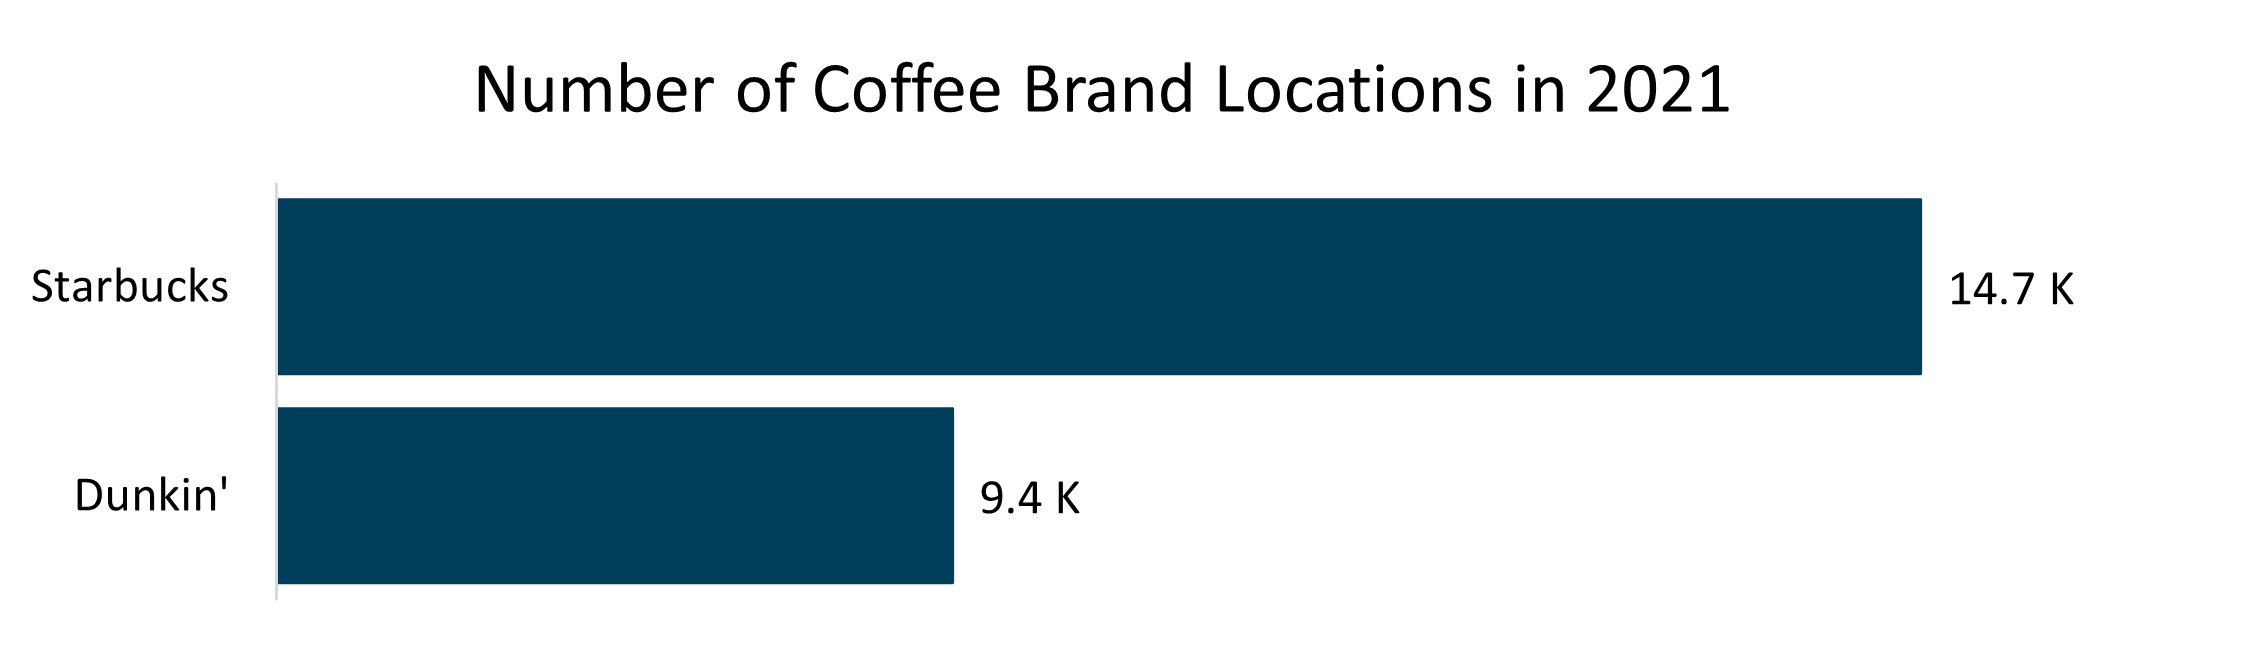
We analyzed a total of 24,038 locations. Starbucks has a larger footprint with 14.7K stores nationwide compared to the nearly 9.4K Dunkin’ locations.
Total Number of Stores from 2019 to 2021
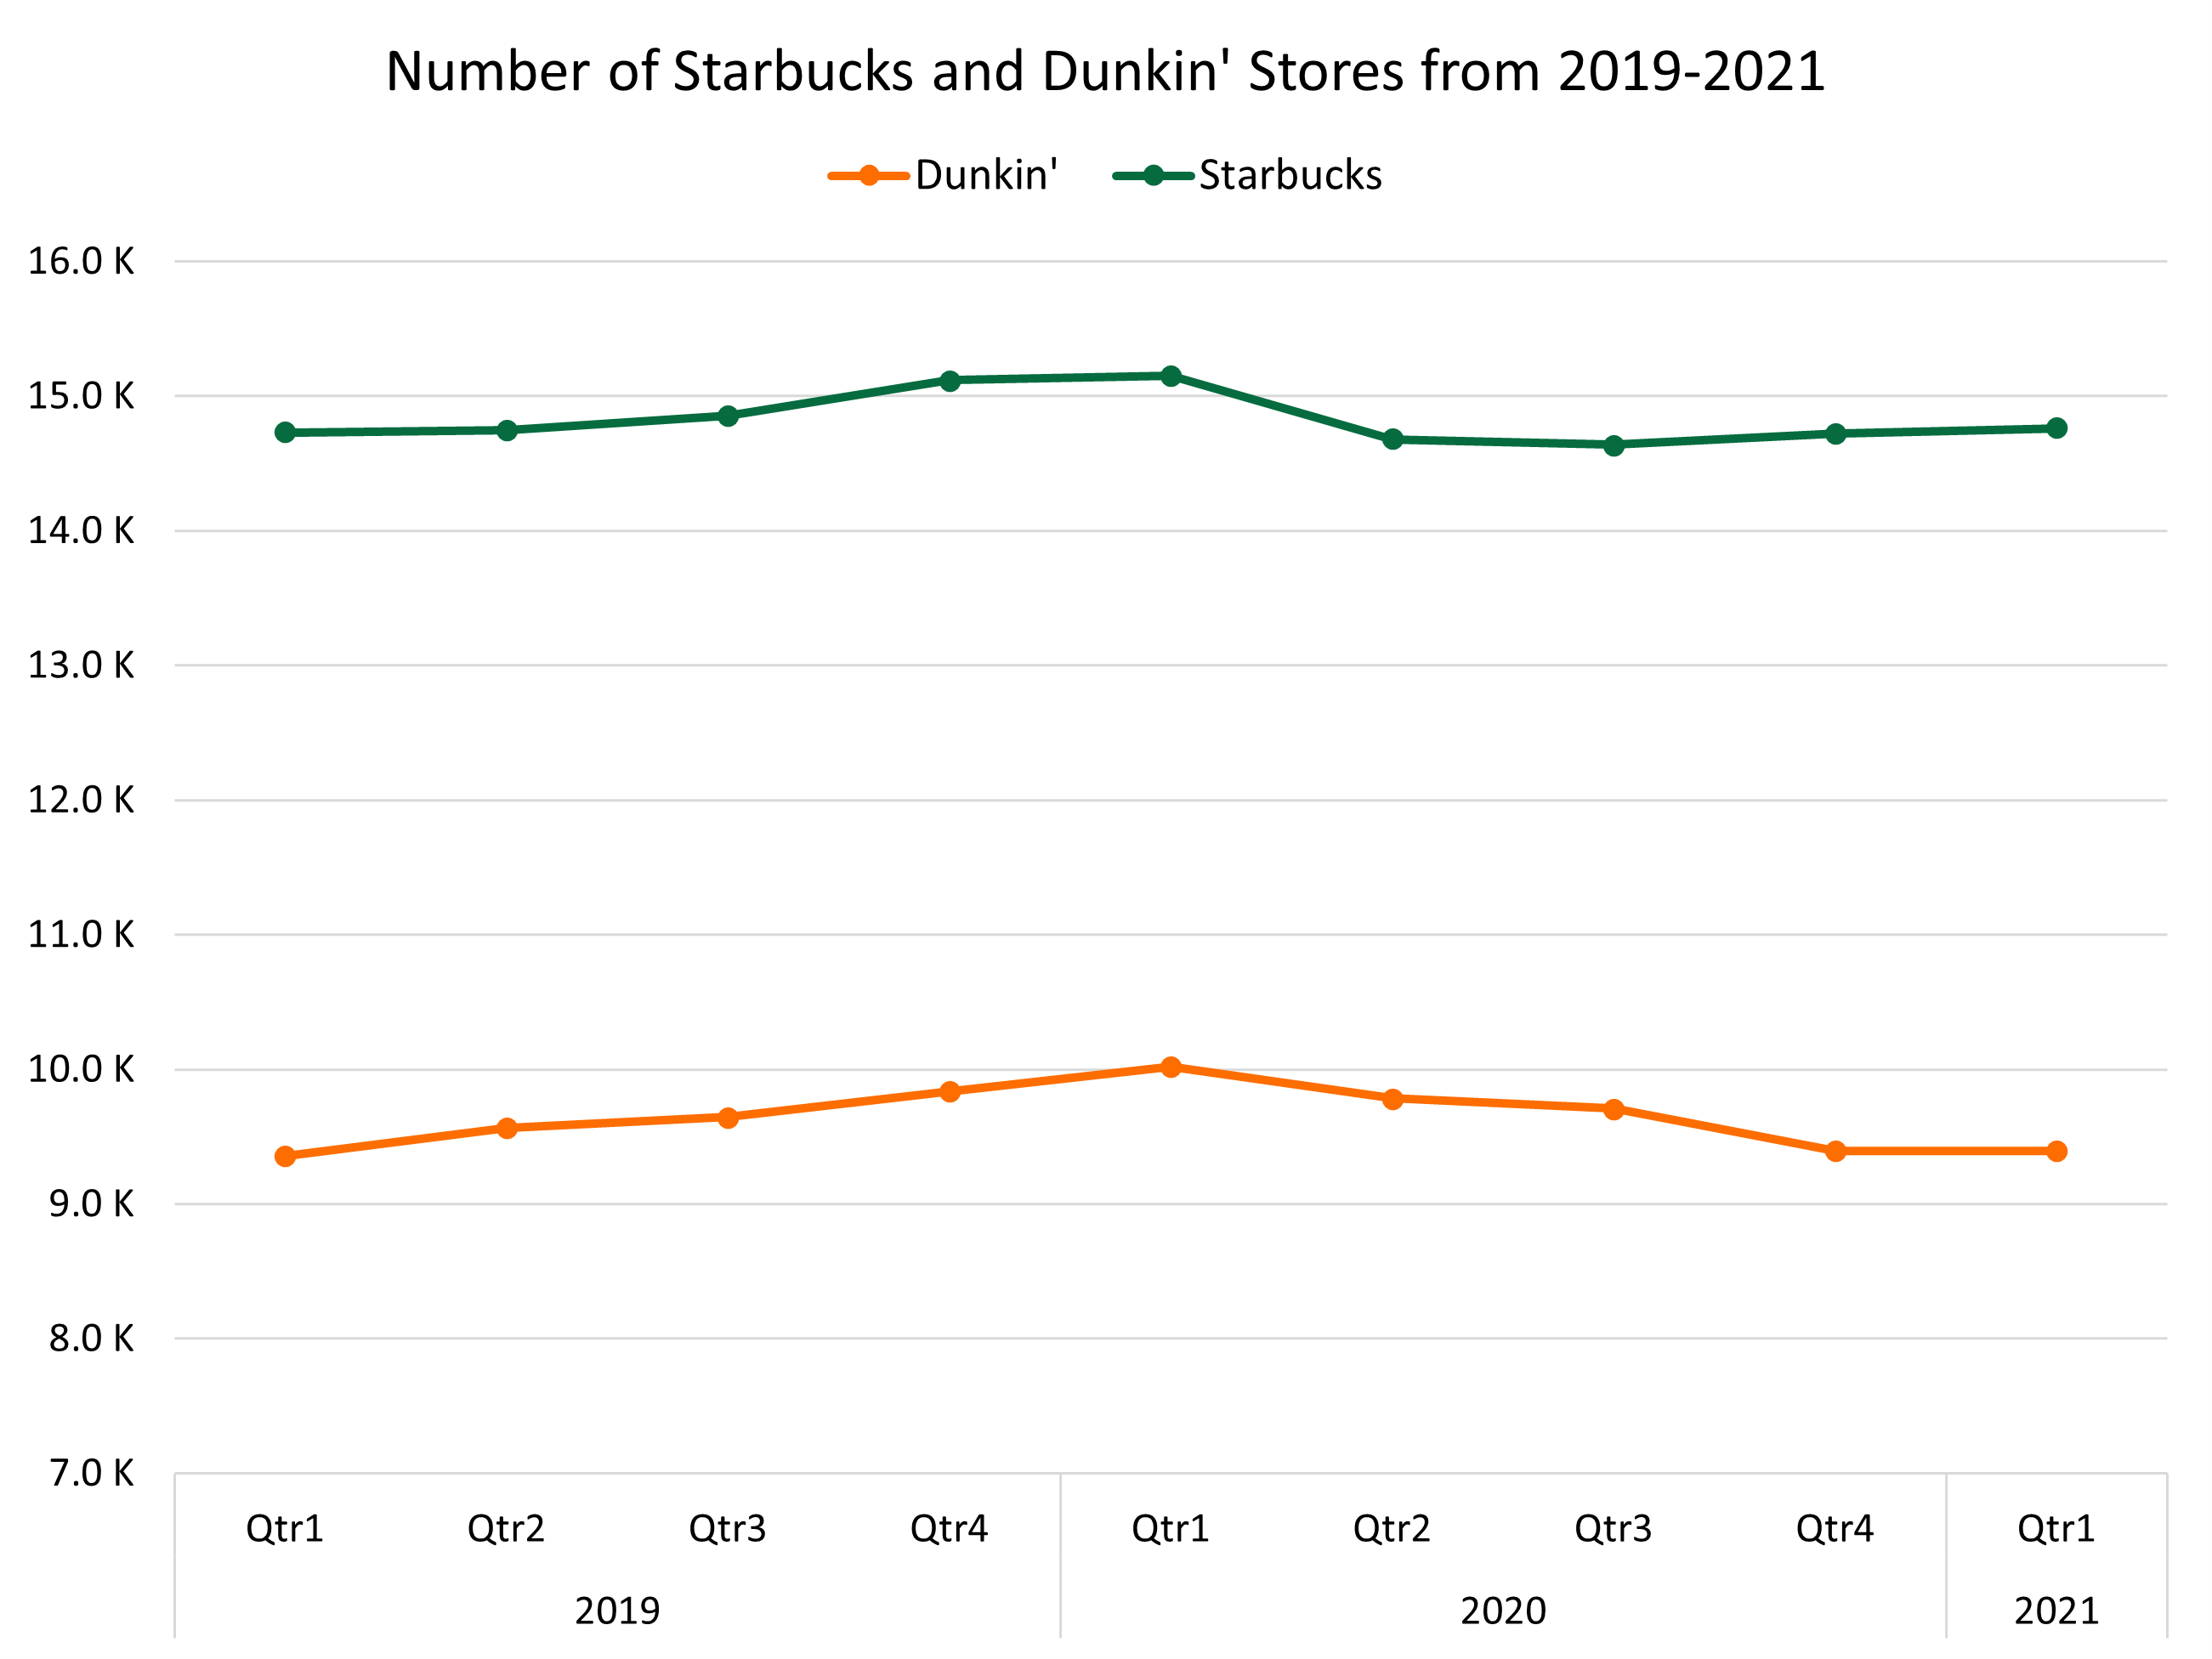
The line chart above shows the number of stores from Q1 2019 to Q1 2021. Starbucks had the highest percentage increase in-store locations during Q4 2019. Dunkin’ had the most store expansions during the second quarter of 2019.
Starbucks will embark on an aggressive expansion plan through the integration of the physical and digital customer experience. The coffee chain is opening up new Pickup stores in New York, California, and Washington.
Starbucks and Dunkin’: Most Locations per State
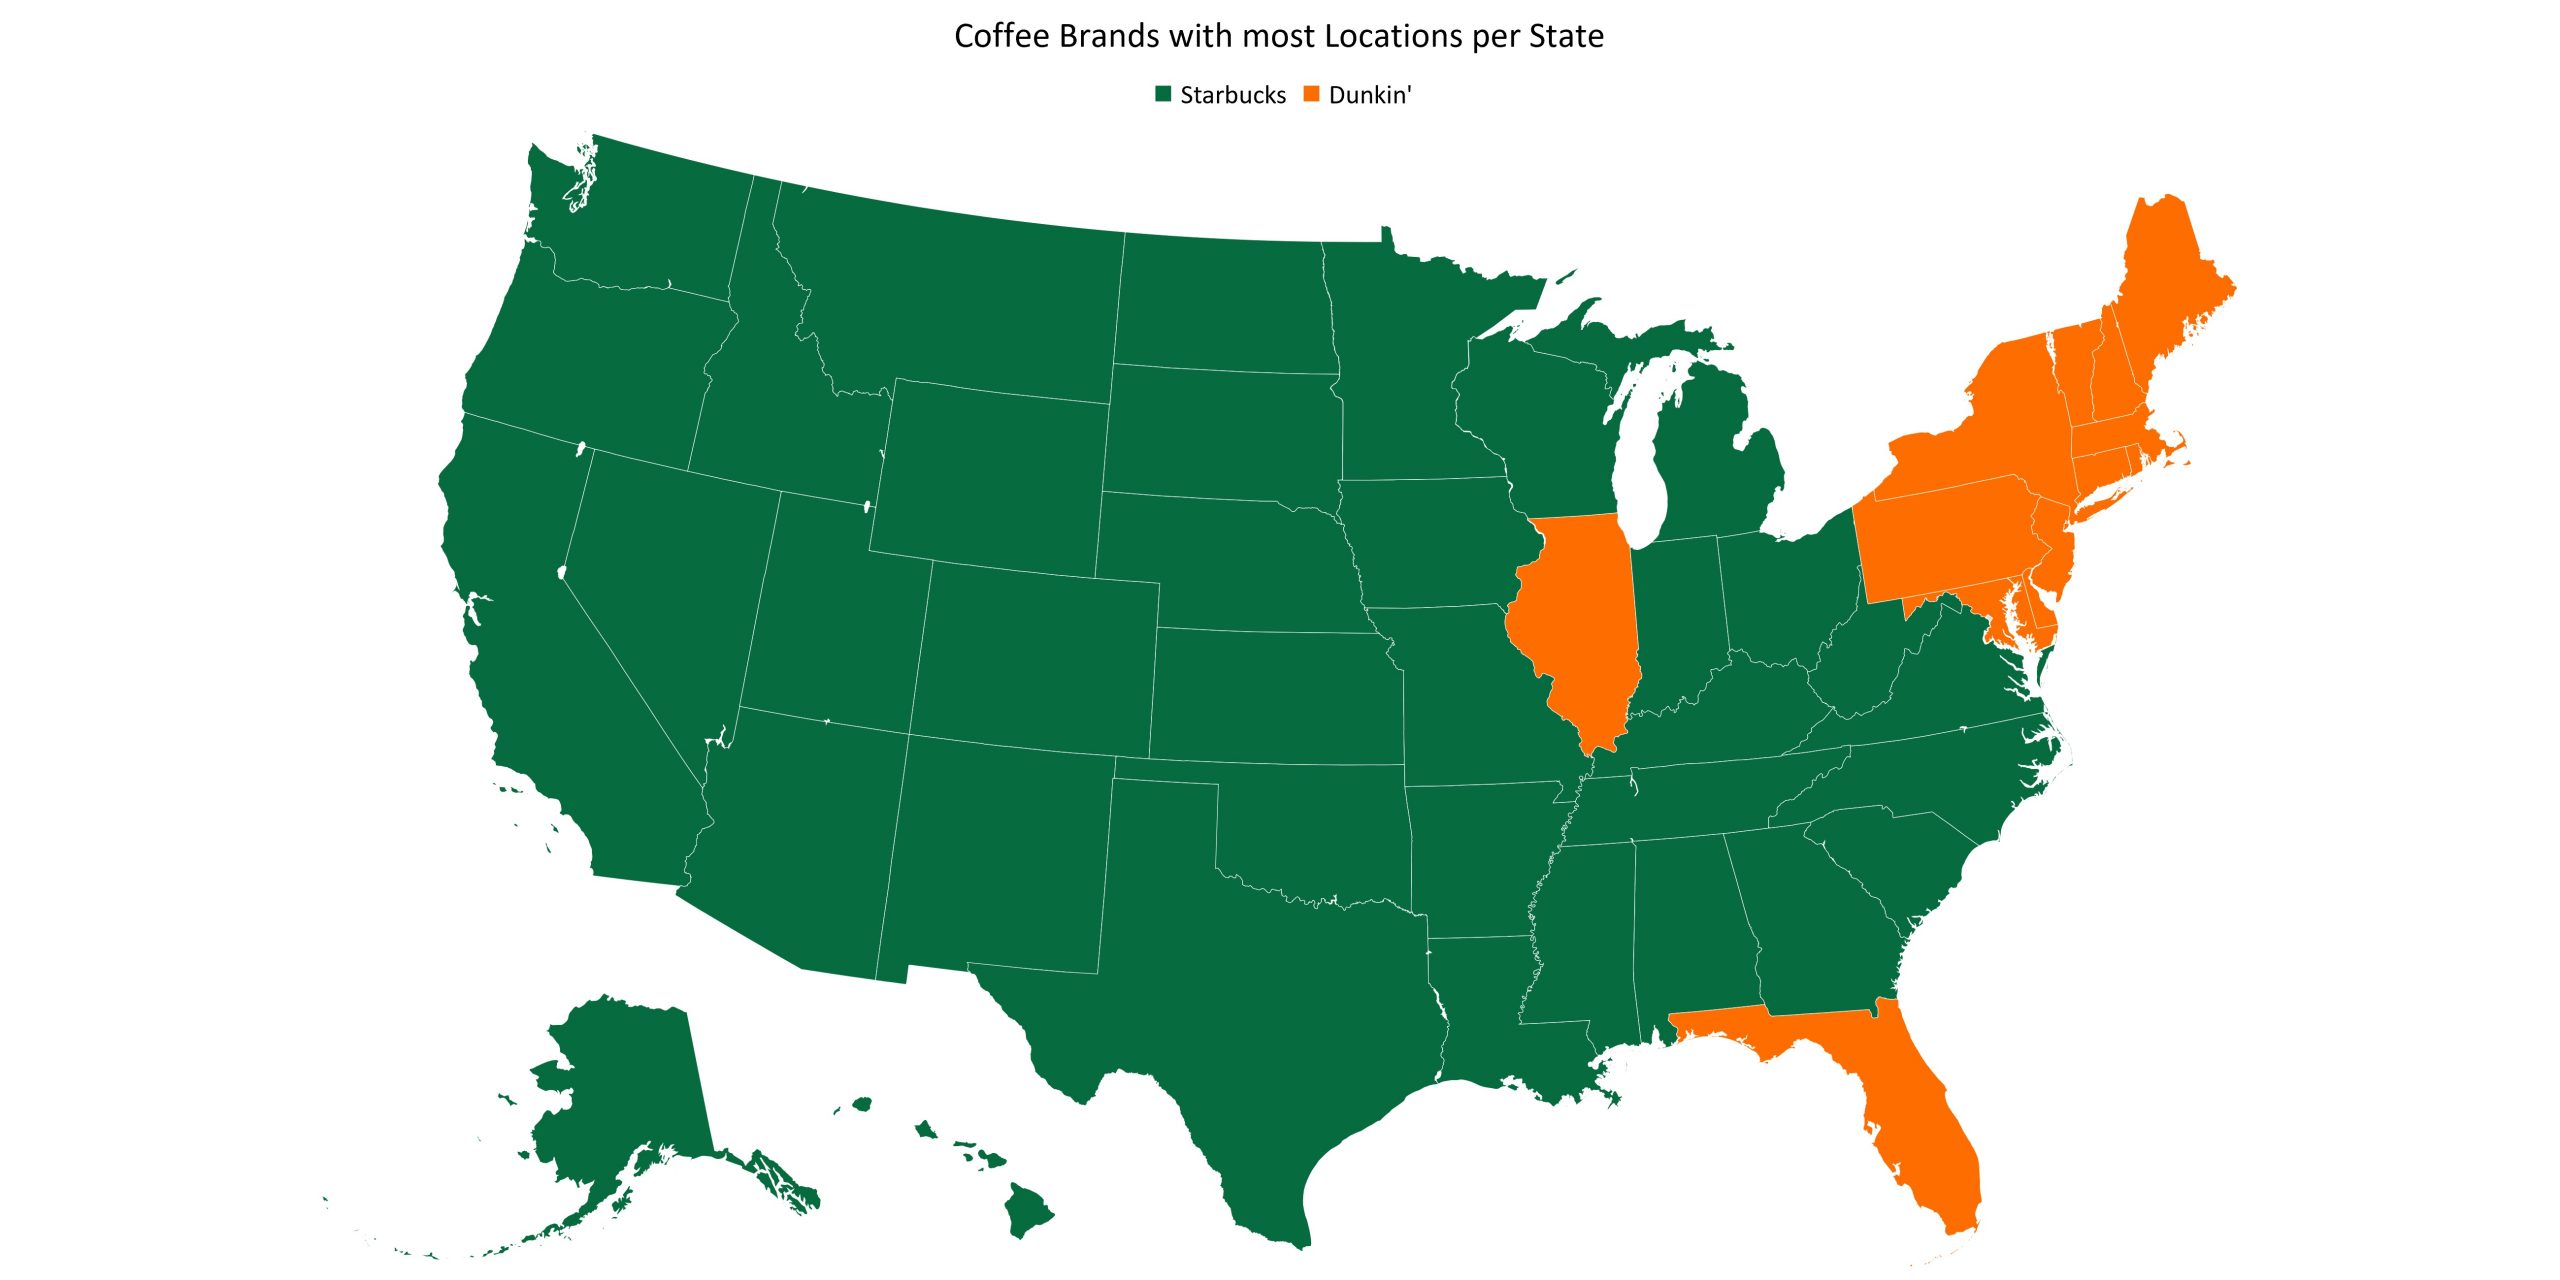
The map above shows the coffee chain with the highest number of stores in each state. Starbucks is the dominating brand in 37 states while Dunkin’ dominates in 13 states.
From the statewide map, it is clear that Dunkin’ overshadows Starbucks in all northeastern states, along with Illinois and Florida.
Starbucks and Dunkin’: Most Locations per County
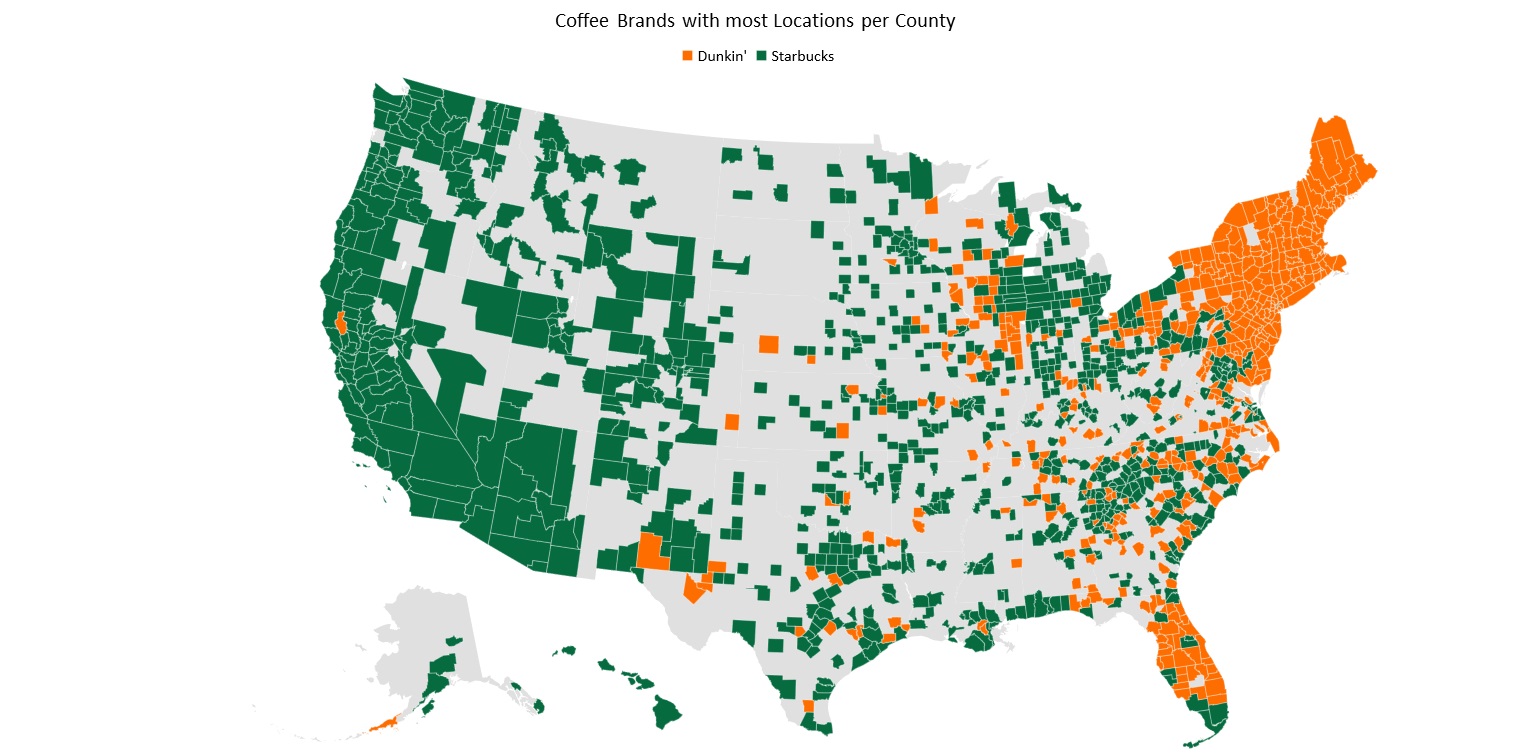
The map above shows the chain with the highest number of stores in each county. Starbucks dominates 916 counties while Dunkin’ is the dominating brand in 493 counties. Out of all the counties in the US, 54% do not have a Starbucks or Dunkin’ store.
There are 8 states where Dunkin’ has the most number of stores in each county whereas, there are 11 states where Starbucks has the most stores in each county.
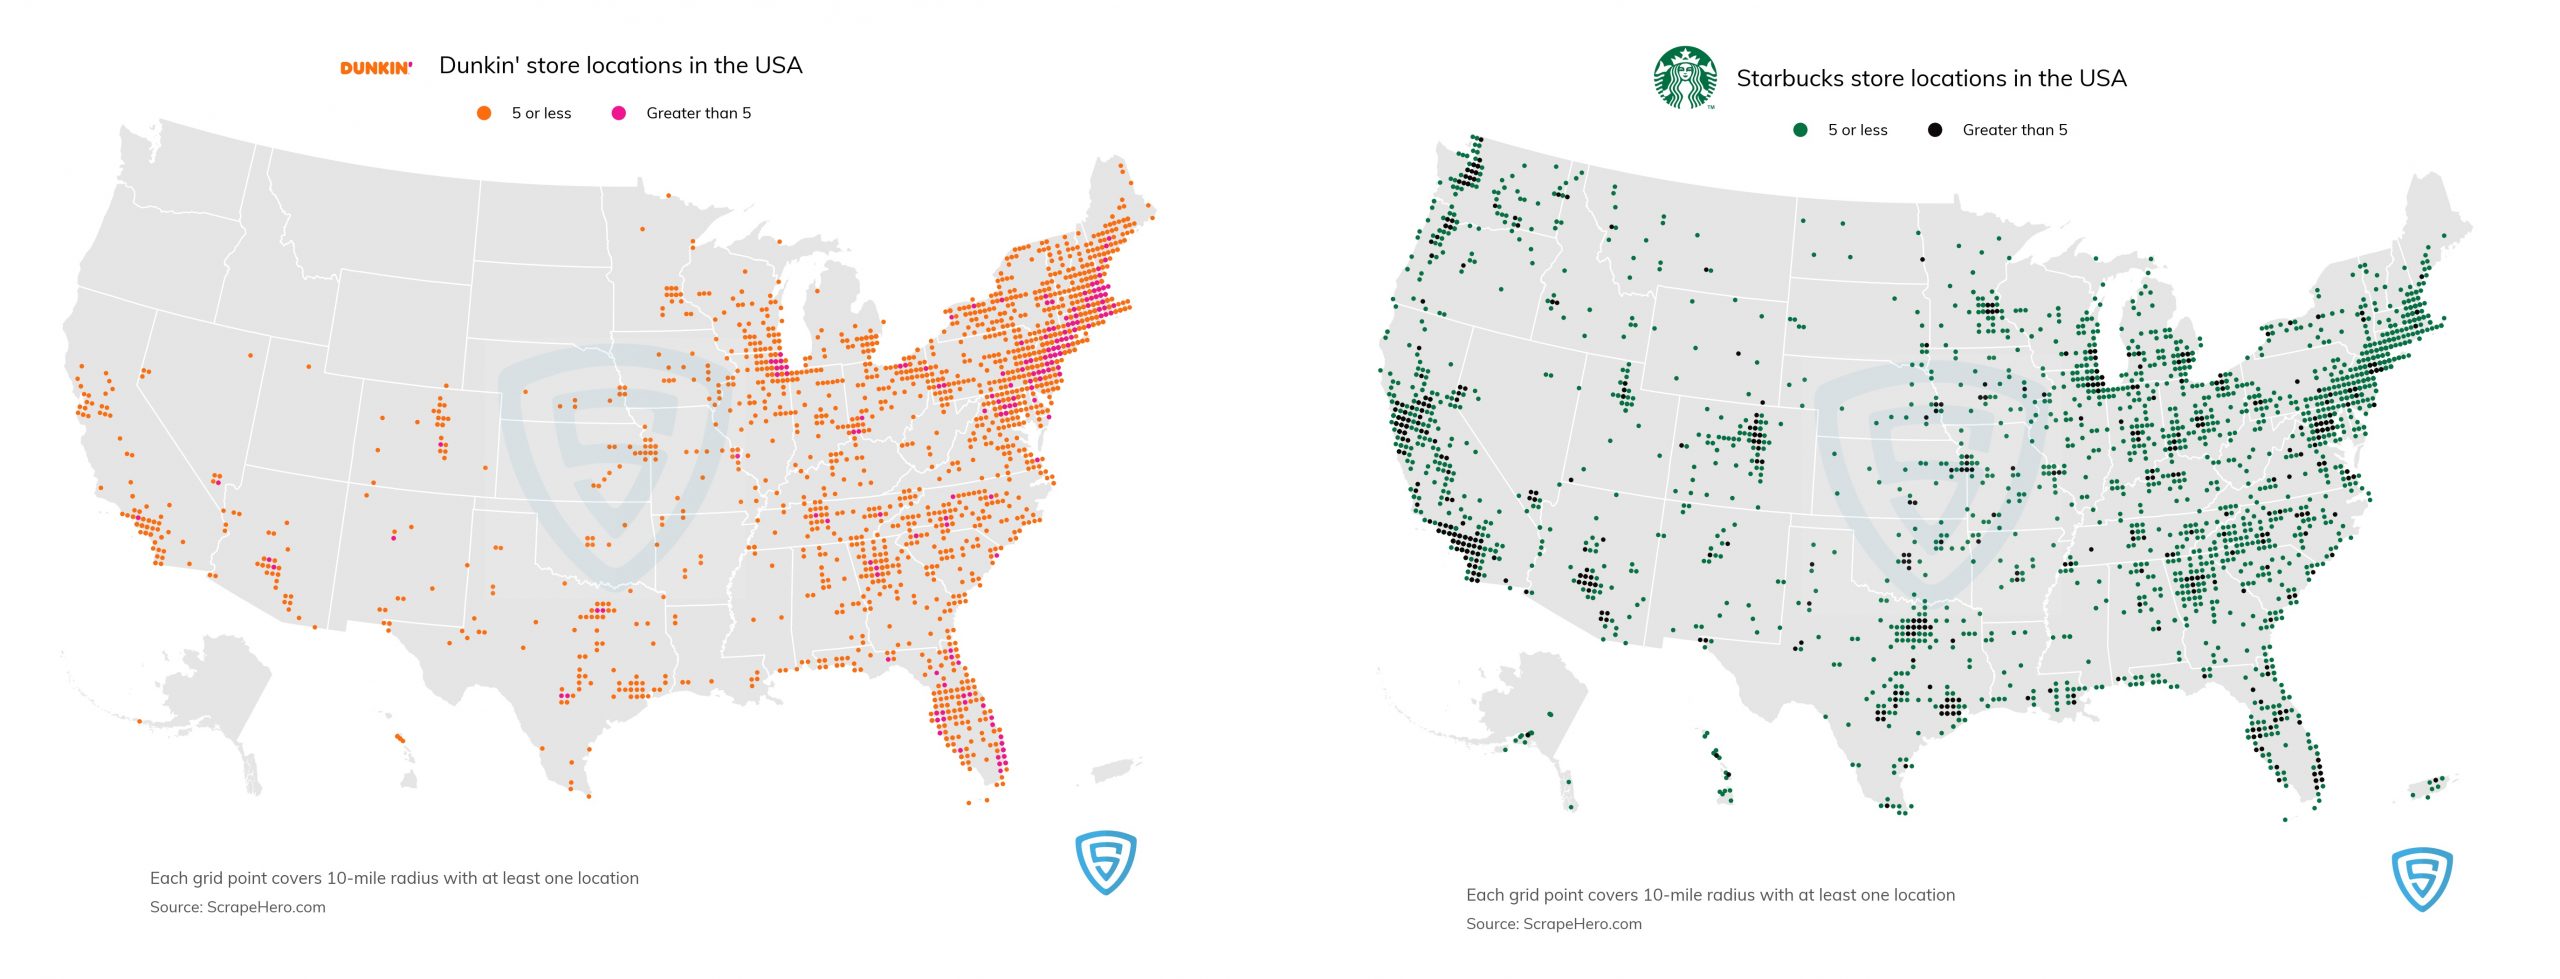
Coffee Chain Locations Map
Dunkin’ store locations are mostly situated on the east coast, and Starbuck cafes are highly concentrated in urban cities. The maps below show the stores for each coffee chain nationwide.
Number of Locations VS Population
Starbucks has noticeably more store locations in highly populated states. The coffee chain tends to saturate the market and cluster in several urban locations.
However, Dunkin’ does not share this same pattern. Dunkin’ has more stores in the highly populated northeastern states like New York, New Jersey, Massachusetts, and Connecticut.
It was found that a Dunkin’ store caters to a larger population as compared to Starbucks. Most Dunkin’ stores are located in places where each restaurant serves less than 200K people. This confirms that Dunkin’ has fewer stores in highly populated areas. However, Starbucks has most of its stores in densely populated cities where a restaurant serves 20K – 30K individuals.
There is a clear linear relationship between the count of locations of Starbucks’ and population, but we cannot say the same for Dunkin’. Instead, there are a few outliers where there are a few highly populated states with a large number of stores.
Annual Revenue
Dunkin’ and Starbucks have been an iconic brand rivalry for quite some time. Starbucks has built a more premium brand than Dunkin’, with an extensive menu and more product customization. Dunkin’ has more competitive pricing, focusing on the middle class.
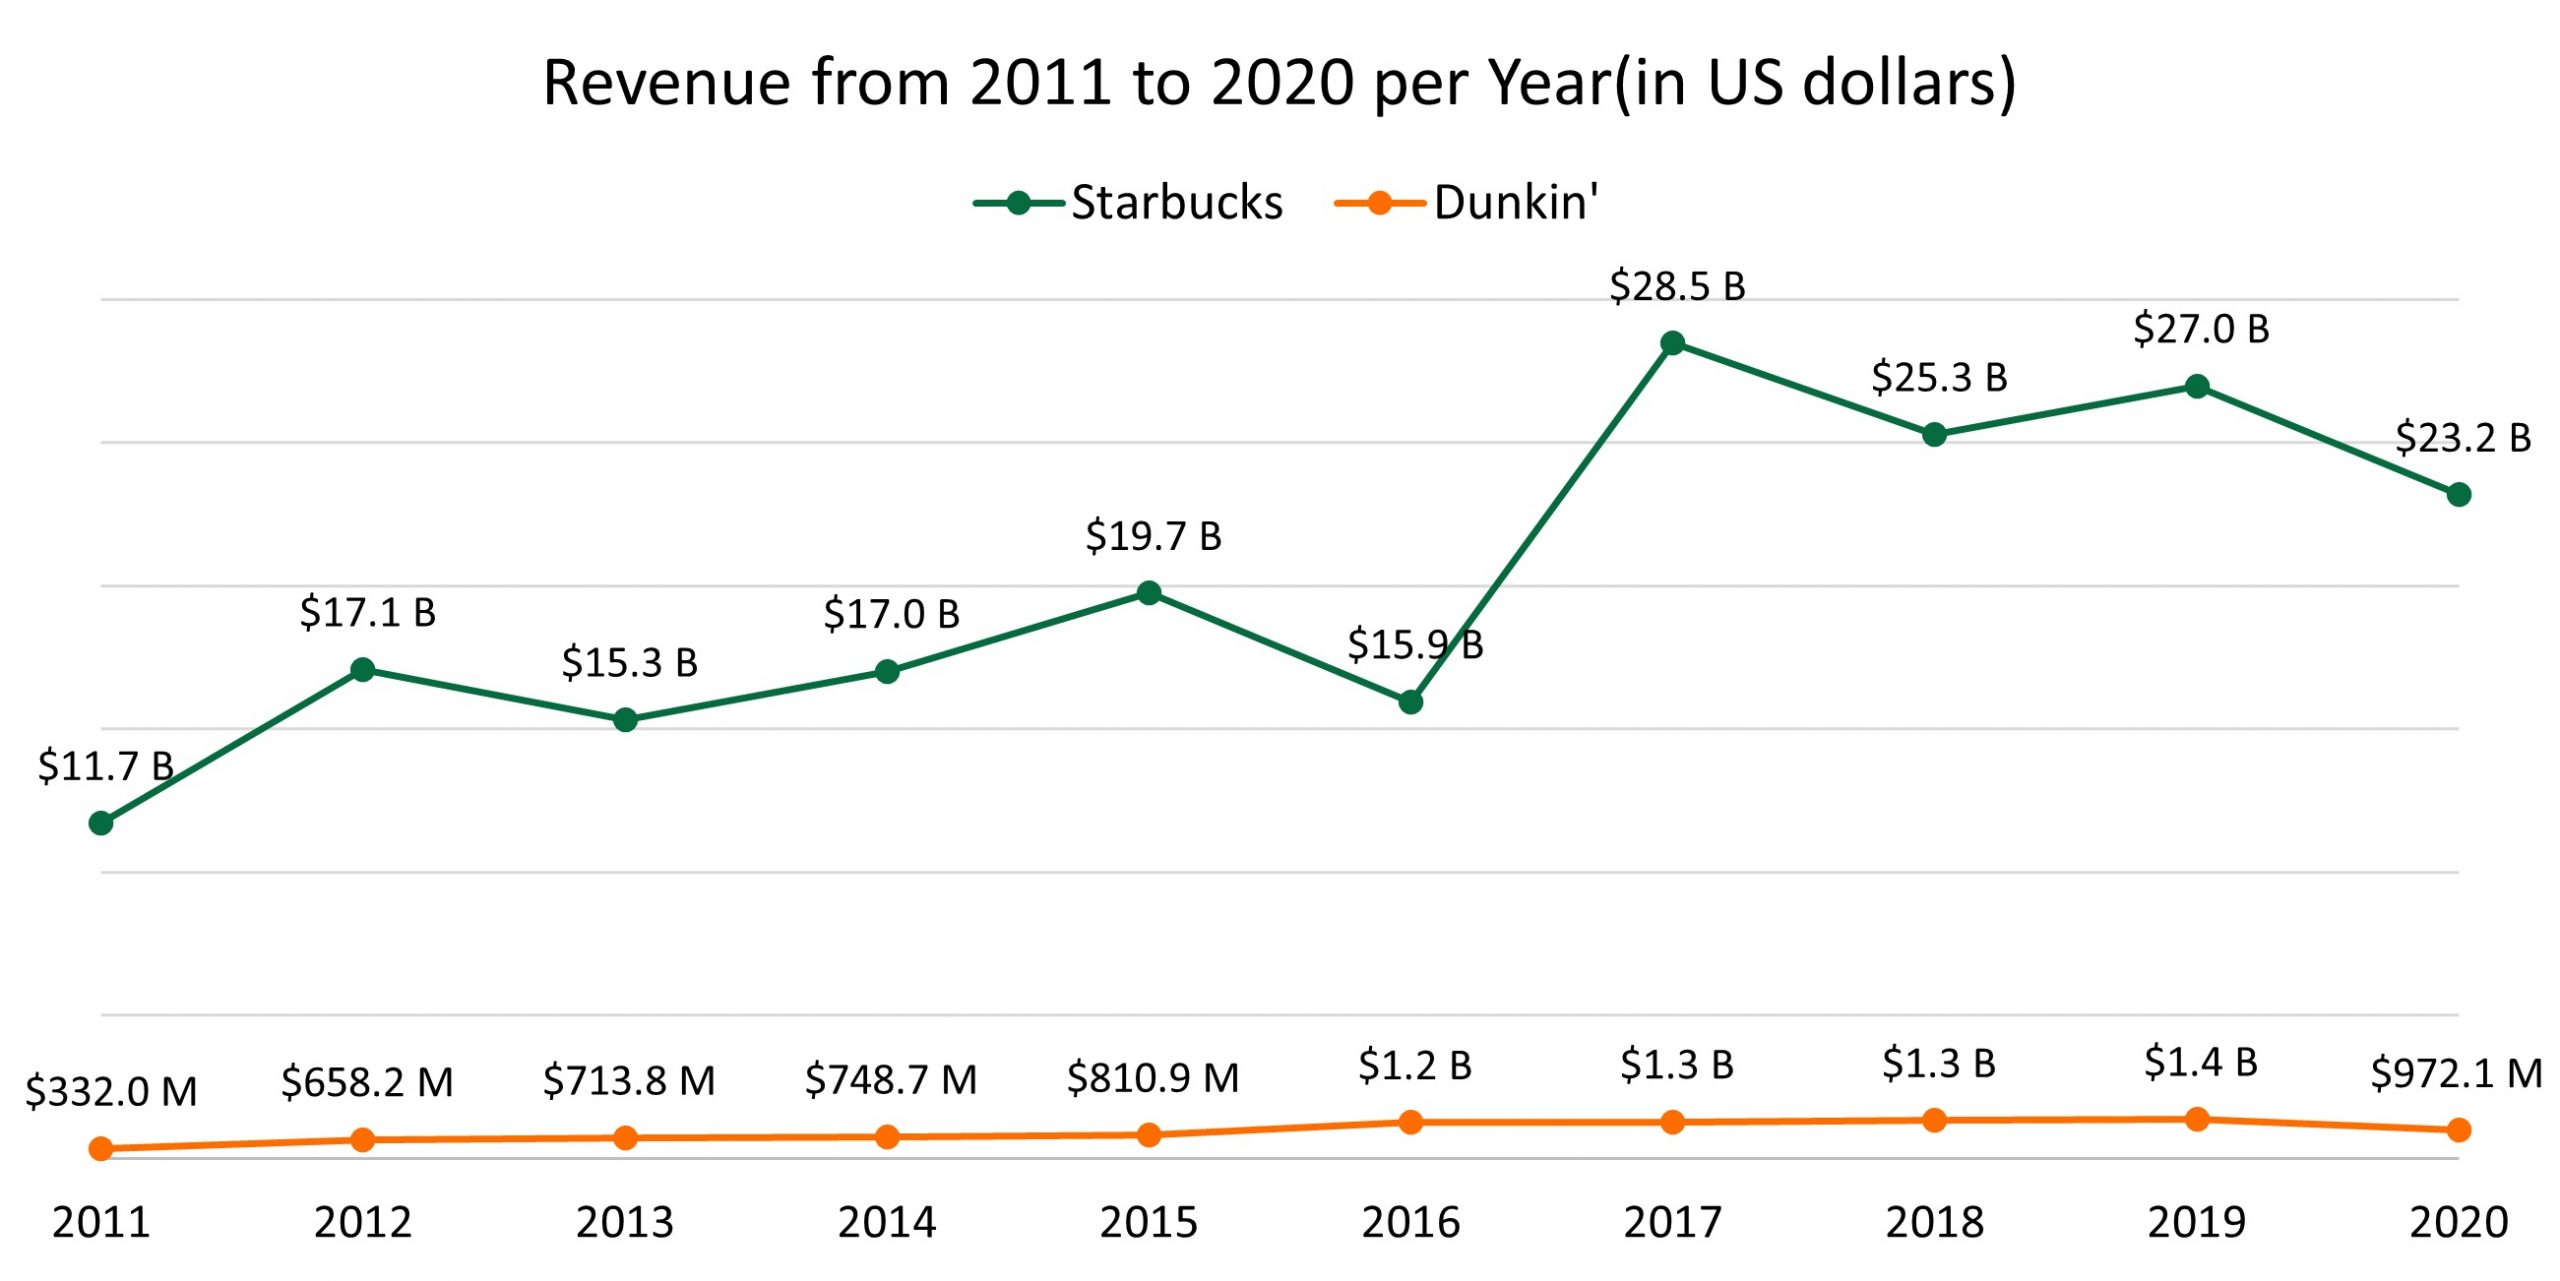
A considerable rise in Starbucks’ revenue in 2017 is due to the new store openings and comparable store sales growth. Dunkin’ has been showing steady growth throughout the years. Its most significant increase was between 2015 to 2016, when it rose from $811 million to $1.25 billion. Dunkin’ represents a 26% market share and nearly all Dunkin’ Brands’ locations are franchises.
How are these coffee chains trending on Google Search?
Google Trends is a powerful tool to measure public interest for a topic in a particular region over a period of time. It usually scales the values across a topic from 0 to 100 (maximum interest). Here the keywords Starbucks and Dunkin’ were searched within the US over the past year. The line chart below shows the comparison of the two chains.
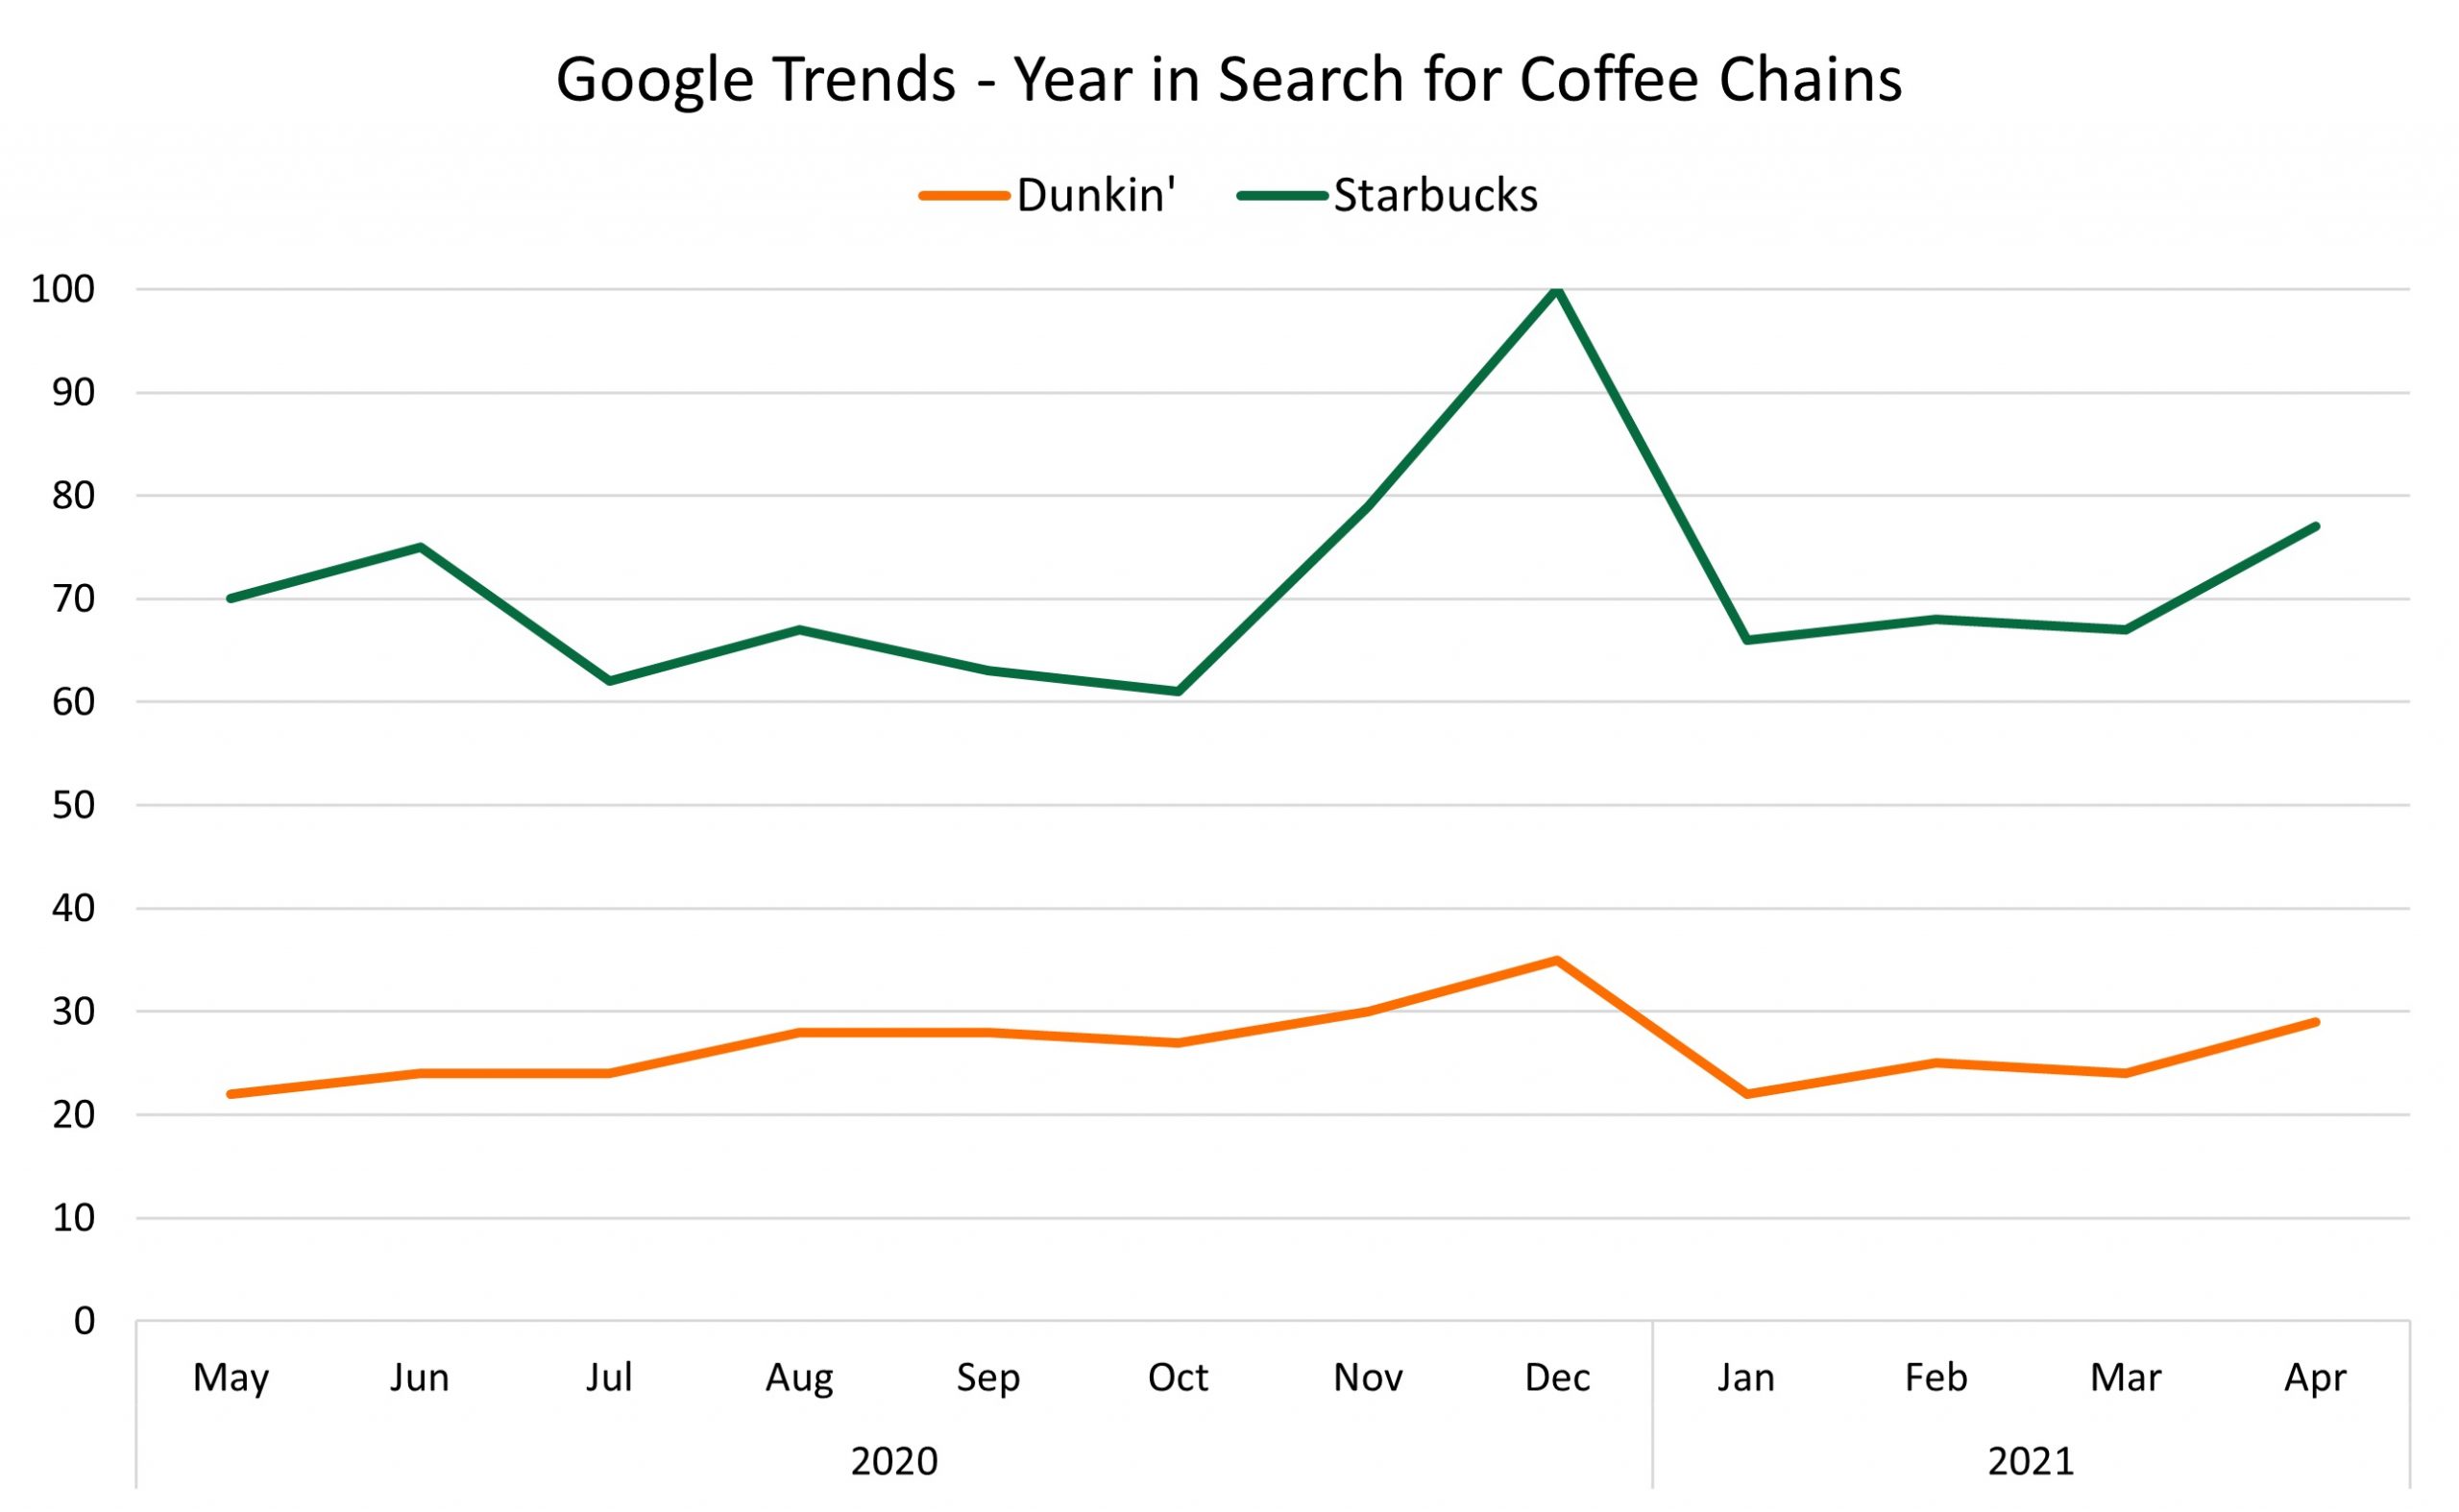
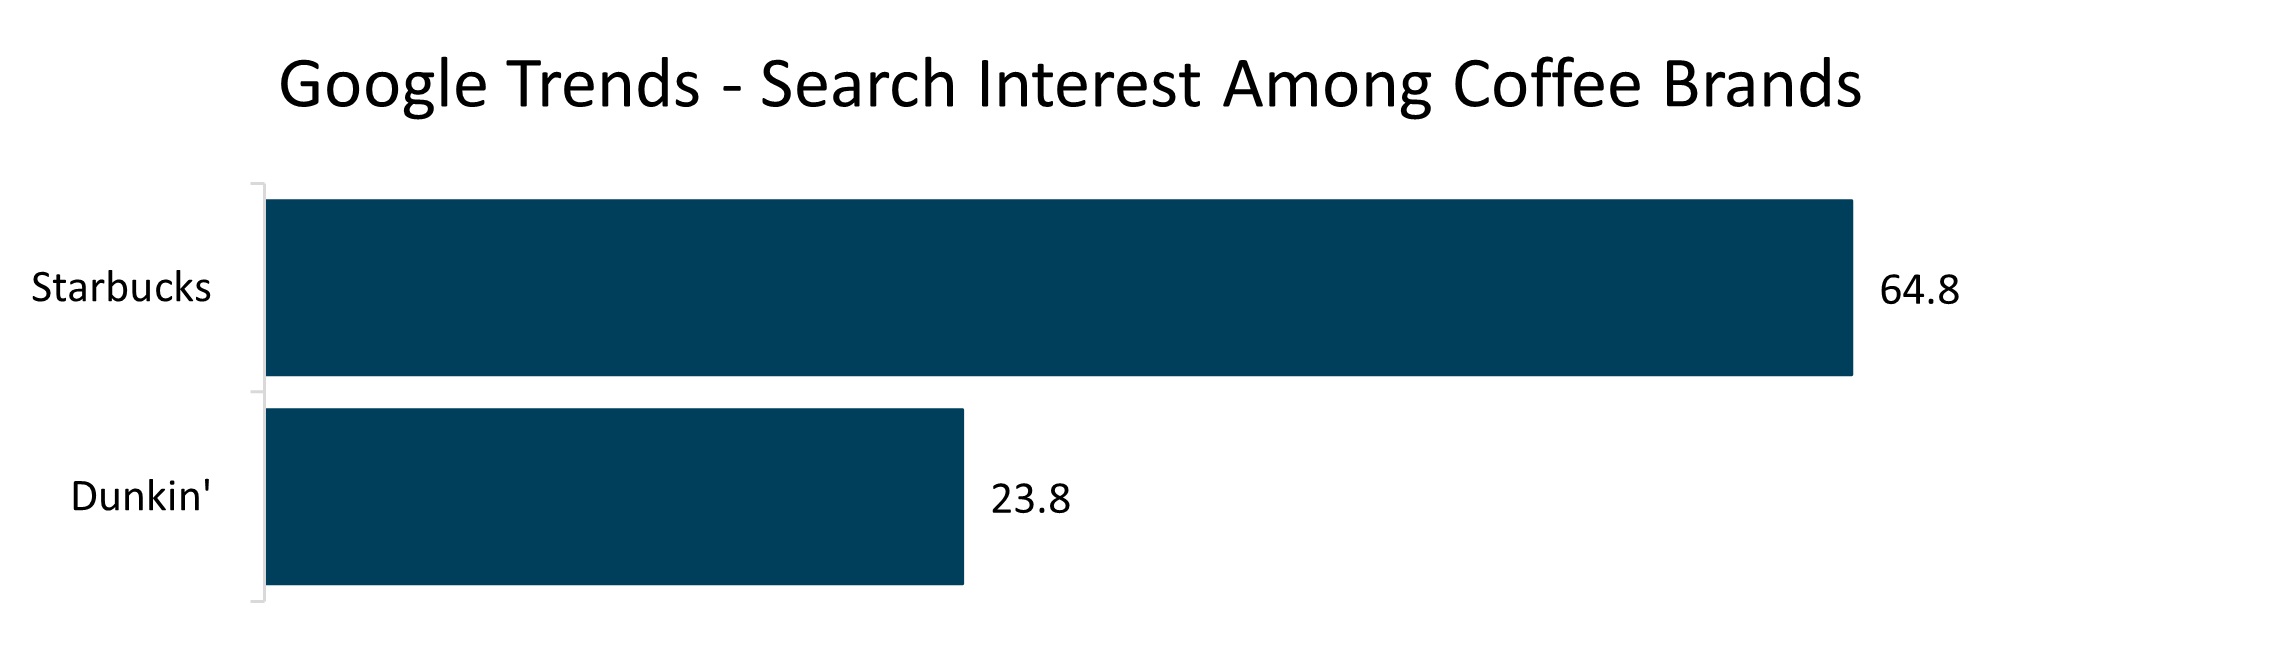
The search interest for the keyword Starbucks was often higher when compared to Dunkin’. The average search interest score of Starbucks is three times that of Dunkin’.
Search Trends by State
The map below shows the trending searches for Starbucks and Dunkin’ in each state.
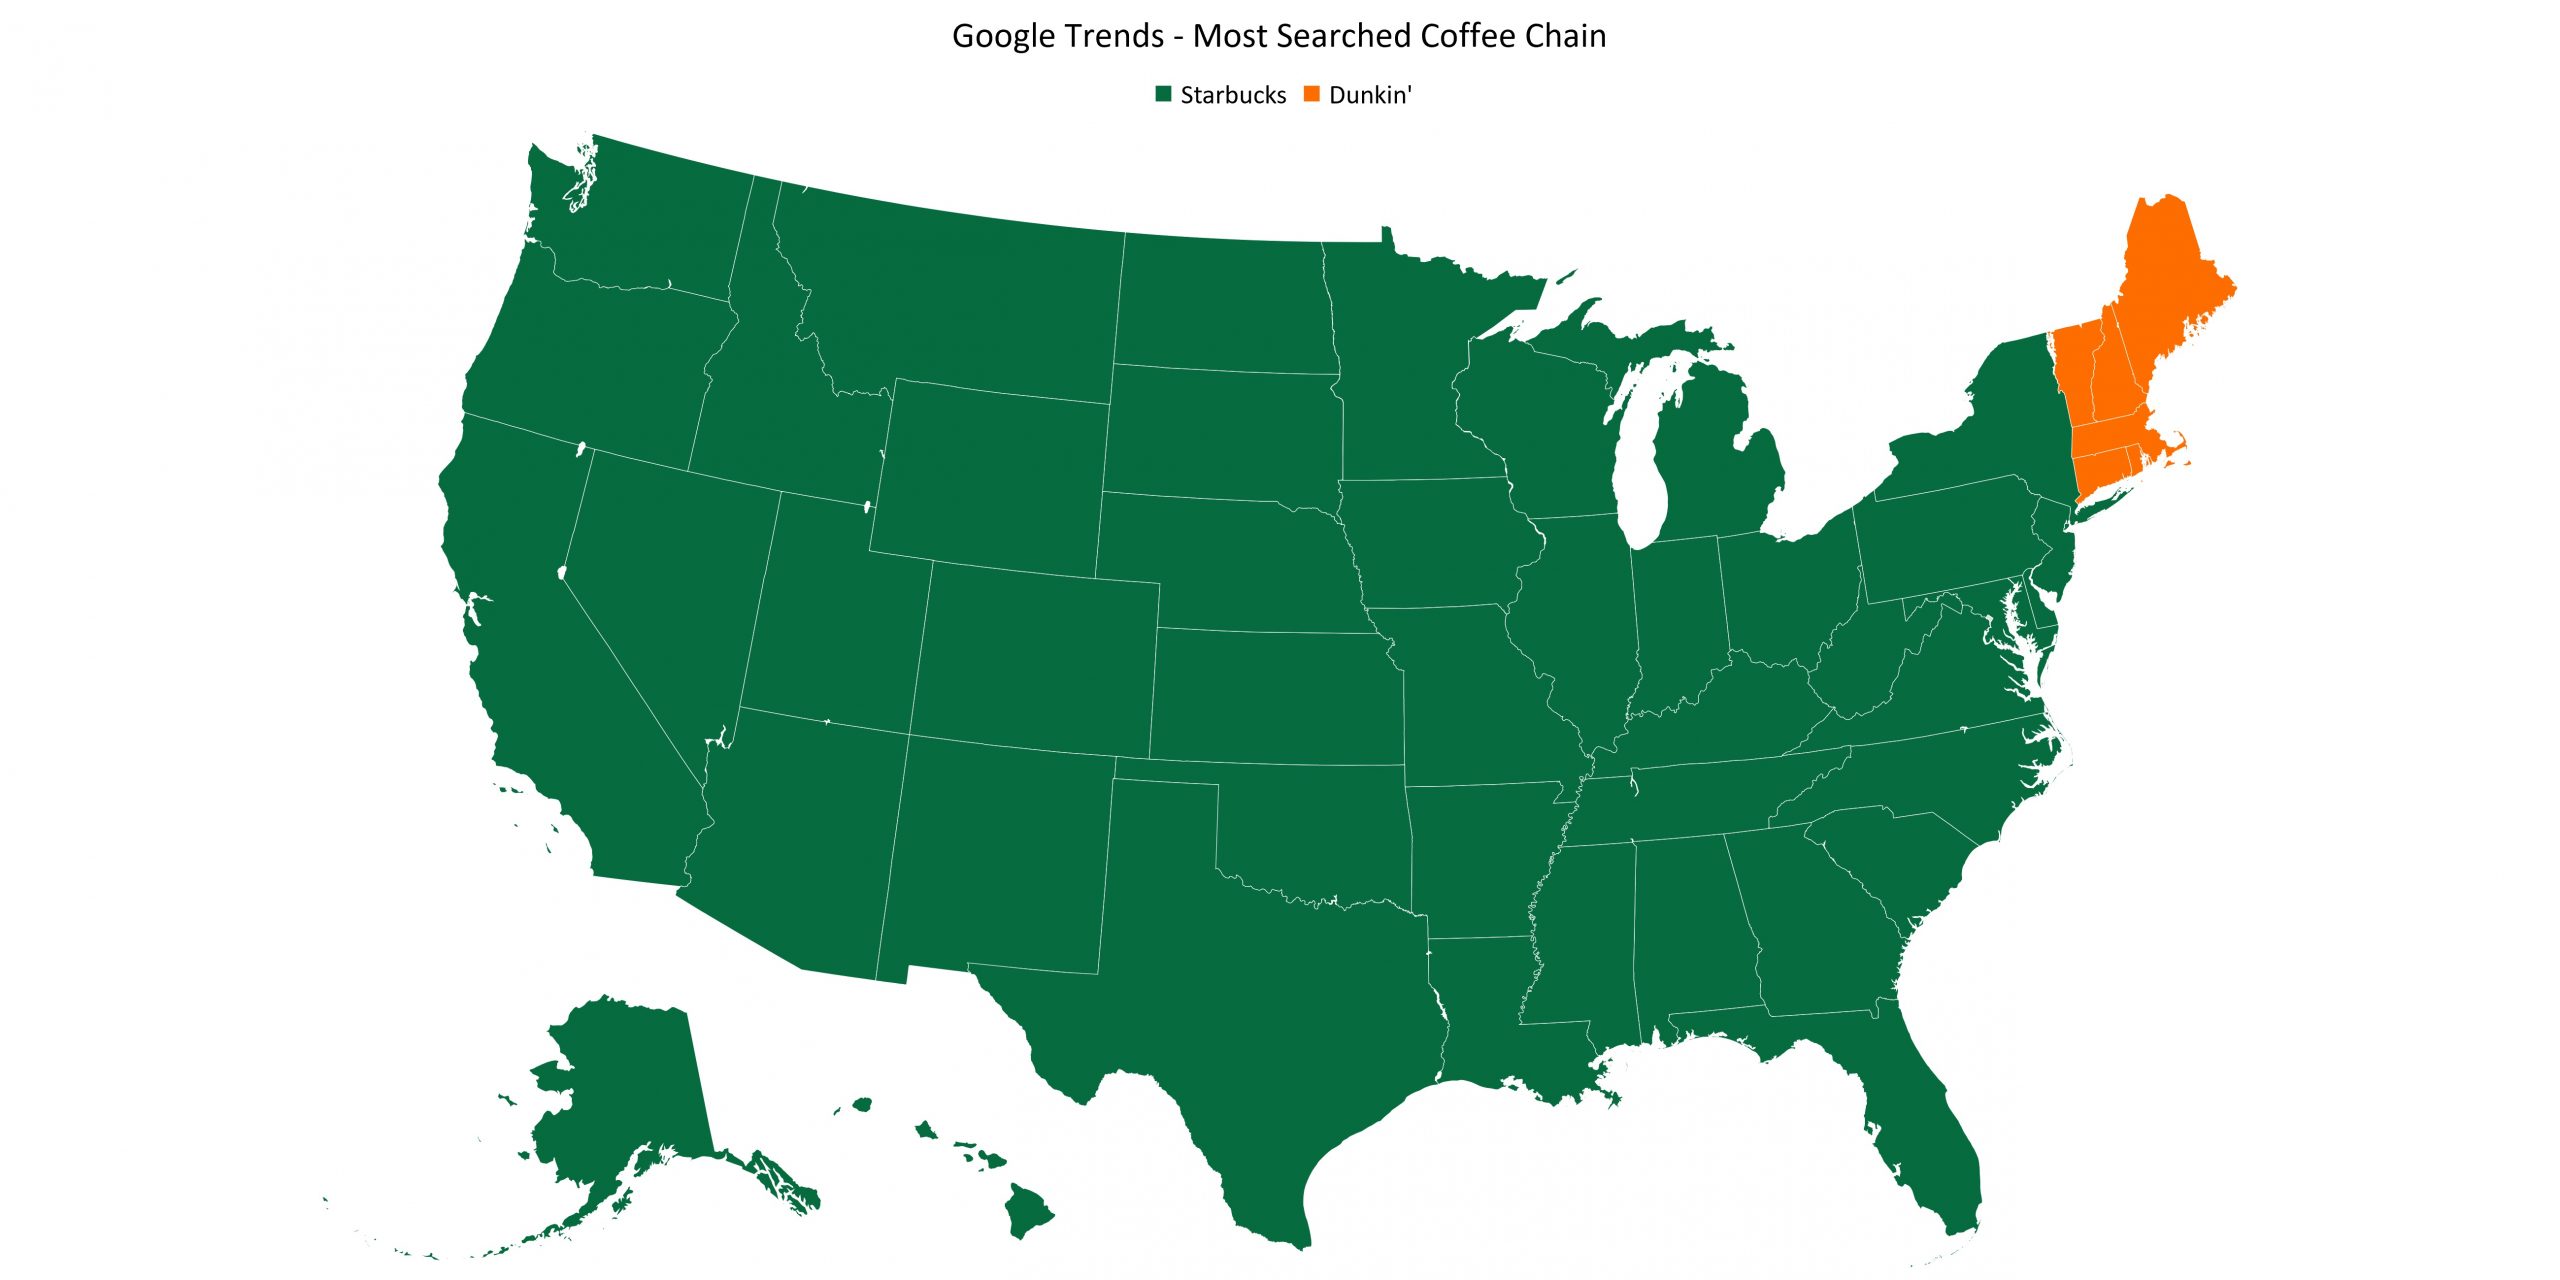
Starbucks claims 44 states with more web searches than Dunkin’ while Dunkin’ is favored in 6 states.
Next, we did a side-by-side map comparison to see if there were similar results with the highest store counts per state and the search results. The map on the left shows the most searched brand per state and the map on the right shows the brands with the most locations per state.
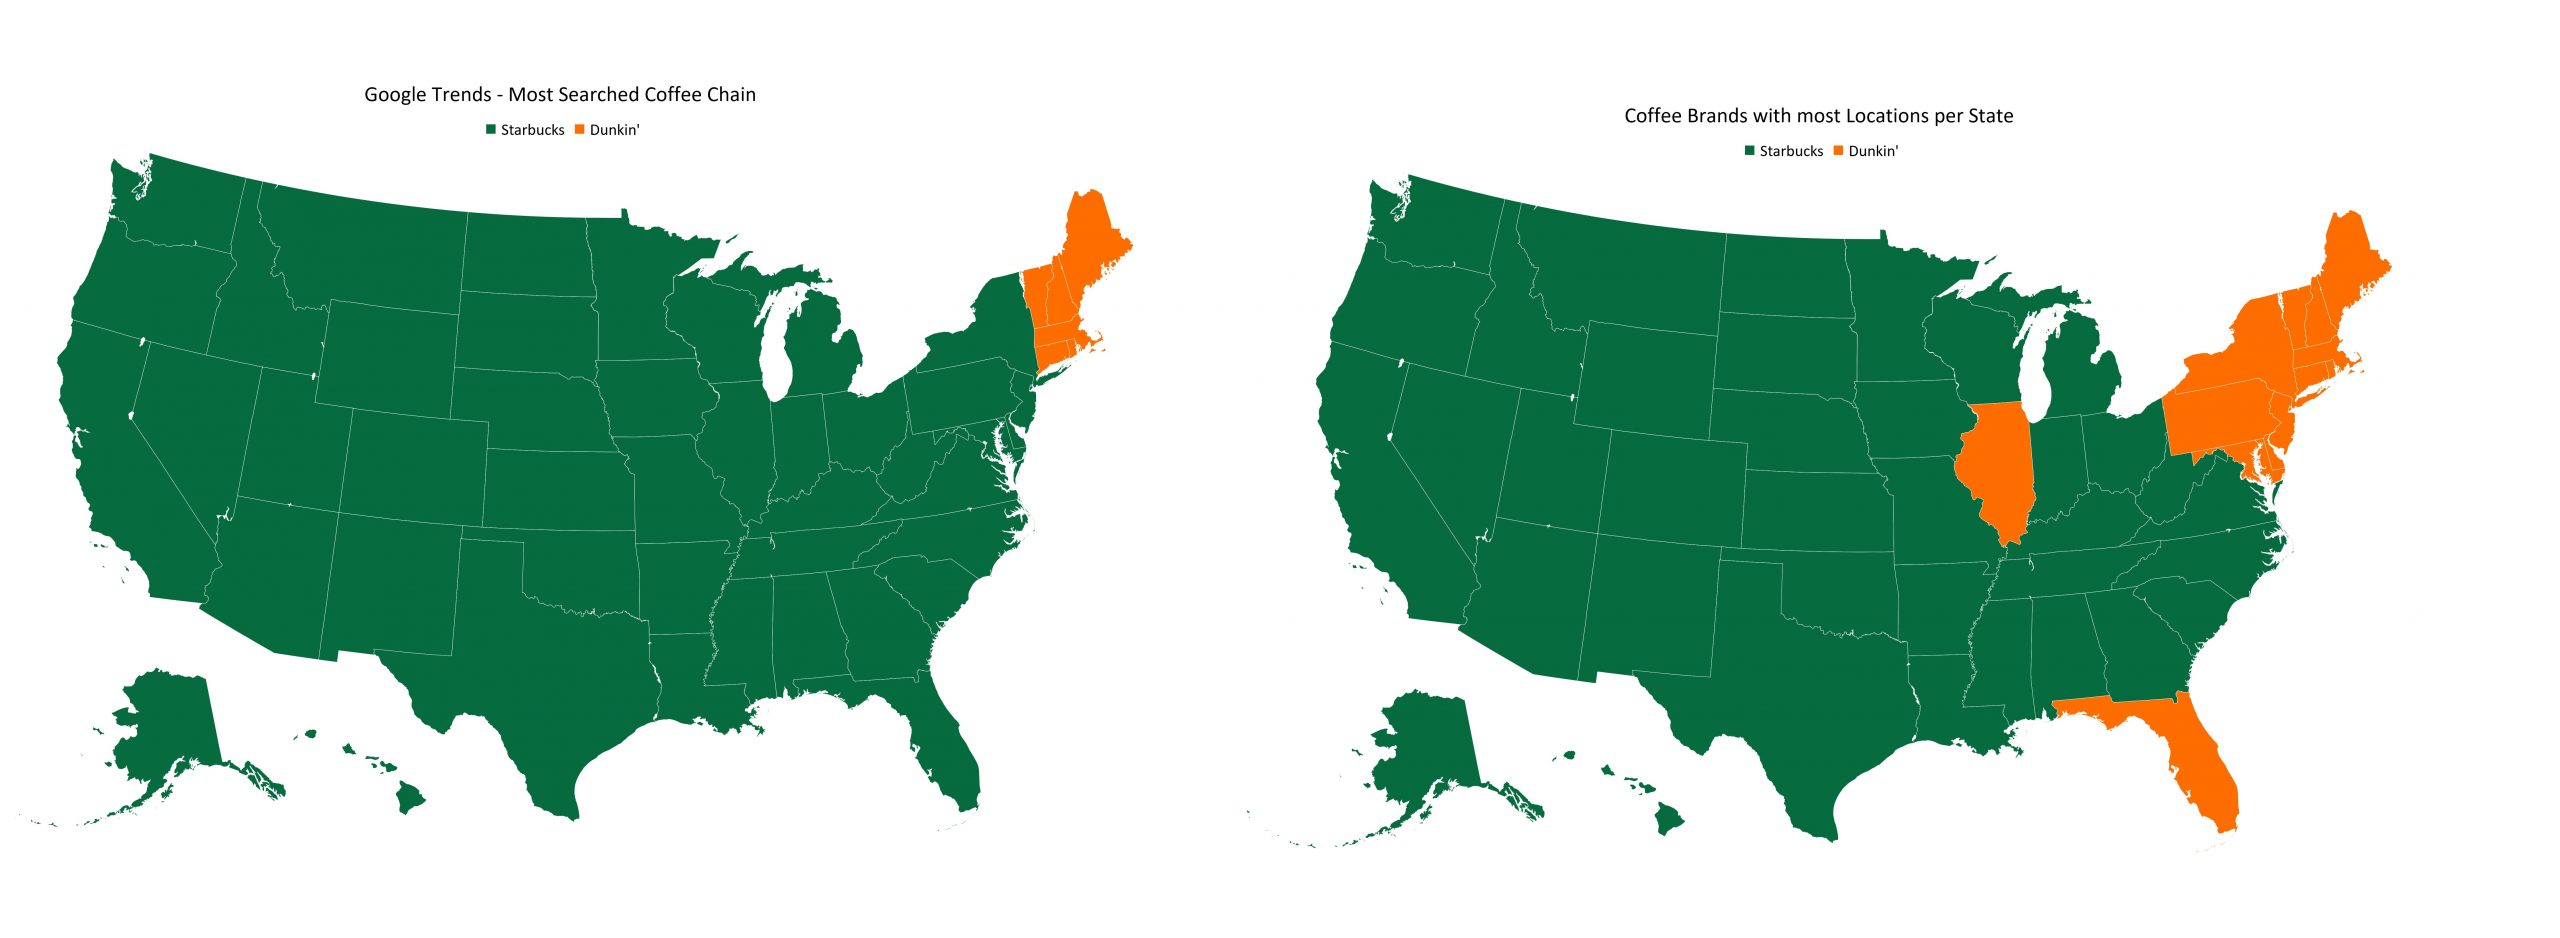
Among all the US states, the major brand and most searched brands are the same in 43 states. In the 7 states where it’s not the same, the popularly searched brand is Dunkin’.
2021 Coffee Trends and Store Expansions
Starbucks plans to accelerate its new format expansion, like pickup and curbside, projecting that it will expand drive-thru to nearly 45 percent of its U.S. portfolio by 2023. Starbucks opened its first Pickup location just over a year ago and will likely speed up this expansion. Dunkin’ has completed a national rollout of its menu simplification. This step will help reduce complexity and help deliver better customer experience, profitability and improve order accuracy. With Dunkin’ it’s all about convenience.
For its part, Dunkin’ rolled out its mobile order-ahead drive-thru back in 2018, and its drive-thrus have been key to boosting off-premises orders during the pandemic. While Starbucks and Dunkin’ and even McDonald’s McCafe will be mainstays in the US, during the Covid-19 pandemic more people likely opted for shopping for their coffee online or in grocery stores instead of waiting in long lines.
If you would like more data insights on store locations, you can download the data used for this analysis and more from our data store.
We can help with your data or automation needs
Turn the Internet into meaningful, structured and usable data