ScrapeHero Research · Trade Area Studies · Preliminary ·
Target Store Locations in the USA: Count, Drive-Time Reach and Trade-Area Demographics (2026)
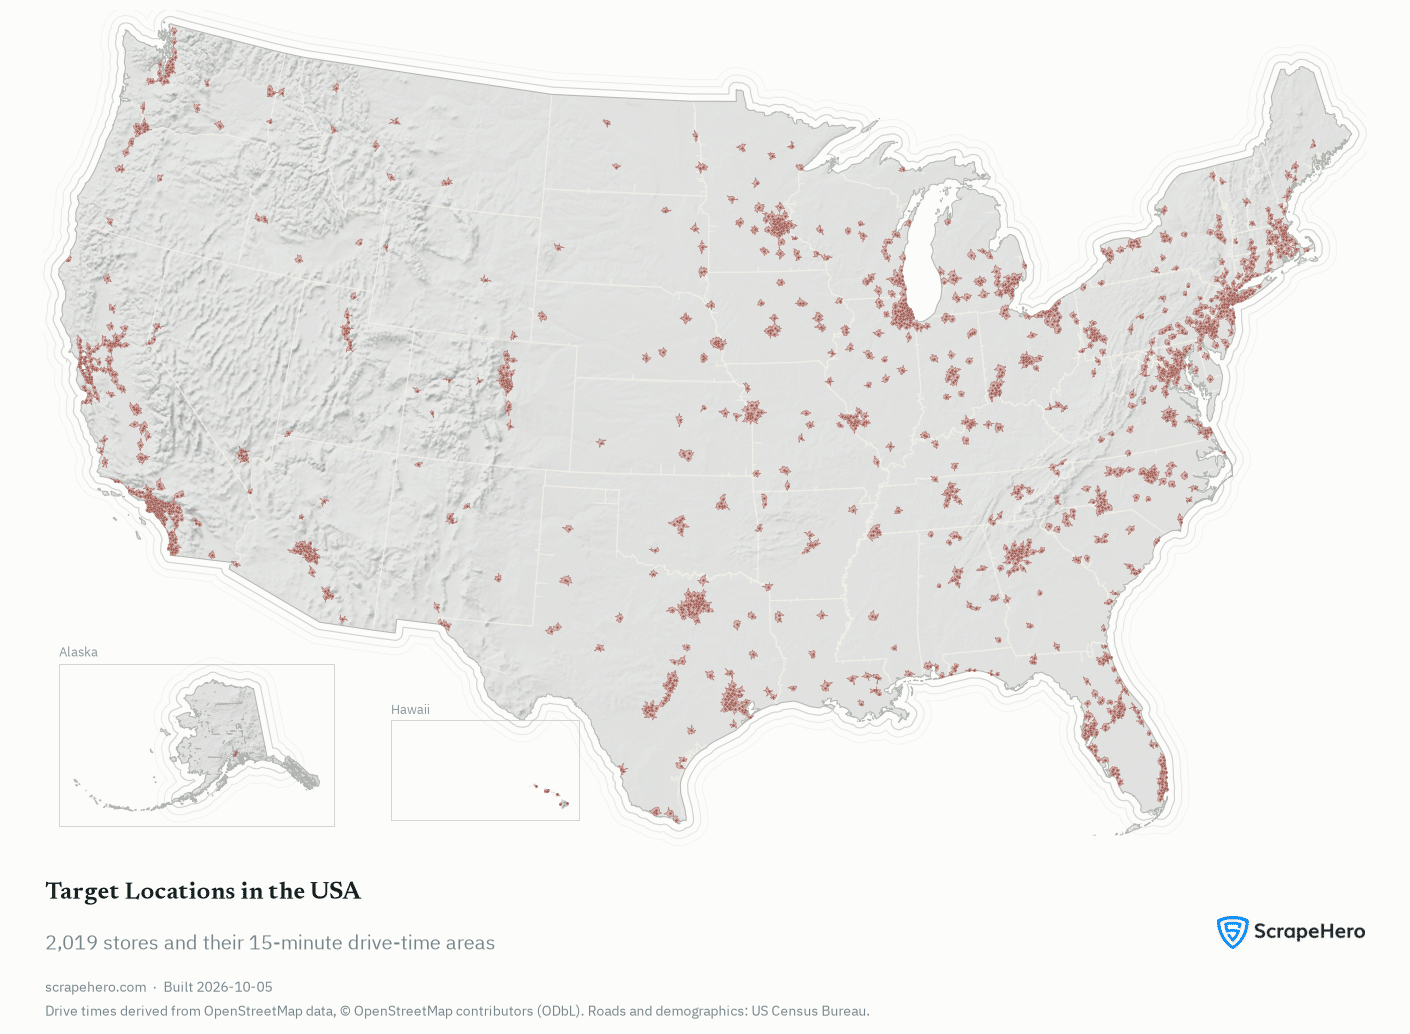
As of 24 September 2026, ScrapeHero tracks 2,019 Target stores in the United States, in all 50 states and Washington, DC. California has the most, 324, and Vermont the fewest, 1. Beyond the count, this report measures how far those stores reach: 64.8% of US households live within a 15-minute drive of one.
The people Target can reach are somewhat better off than the country as a whole: they earn $120,759 a year on average against $113,517 nationally. Most households that can reach a Target have more than one to choose from: 67.3% of the households Target reaches can get to two or more within 15 minutes.
This report asks how far Target's stores actually reach: not how far away they are in miles, but how many households can drive to one and how quickly, what those households earn, how many have a second Target to choose from, and which metropolitan markets the chain trades in and which it has left alone. Every figure is measured along the real road network and apportioned down to census block level, so the reach is what a car can cover rather than a circle drawn on a map. The short answer is 83.8 million households within a 15-minute drive, 64.8% of the country's 129.2 million, earning $10.12tn a year between them.1
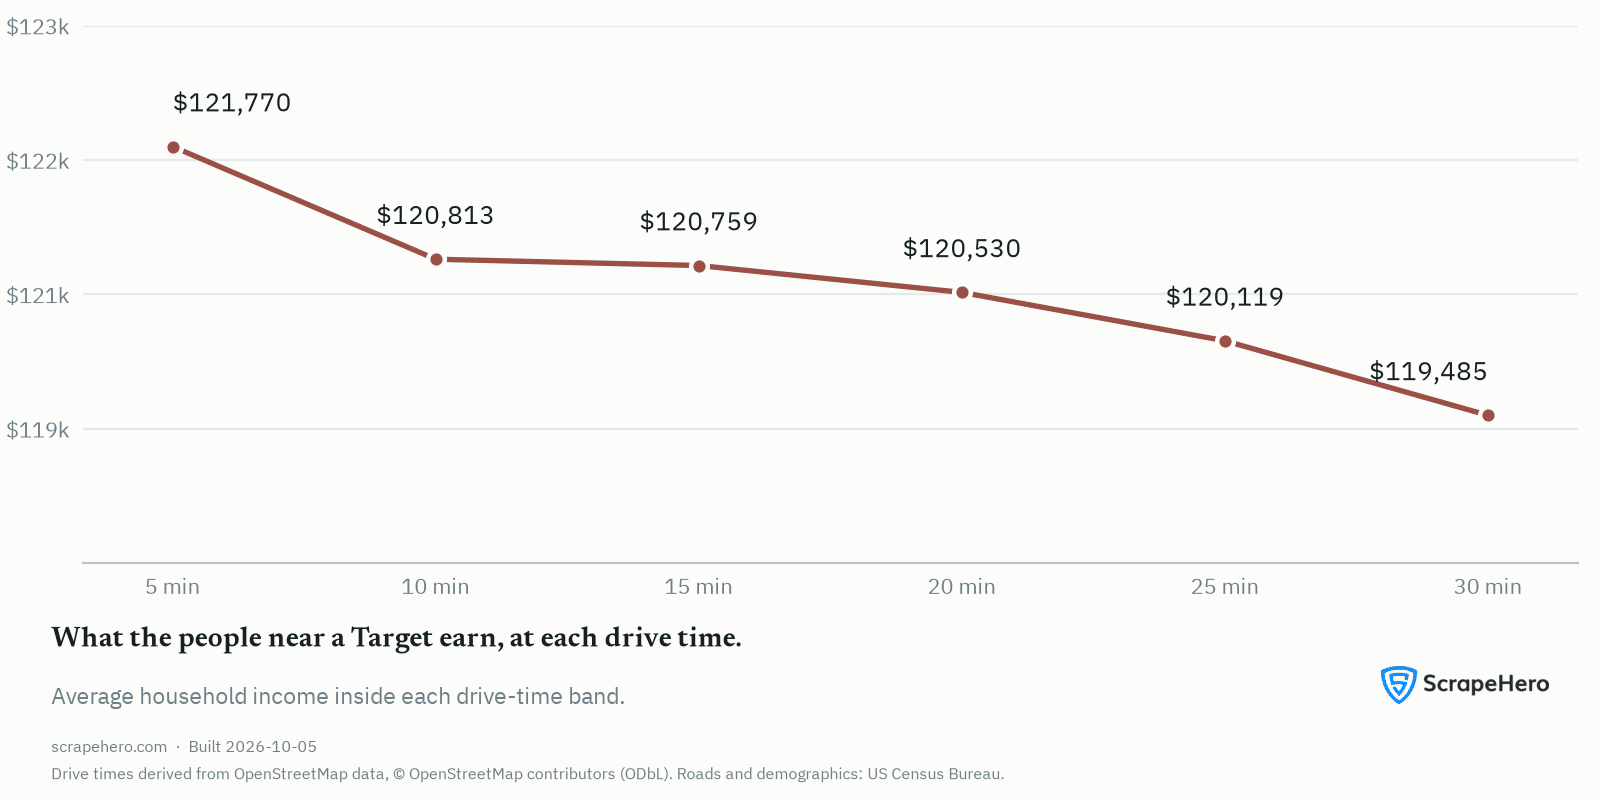
13.5% of households are within five minutes of a Target; 81.9% are within thirty. Five minutes is the Target you pass anyway. Thirty minutes is a trip you plan. Households within five minutes of a Target earn much the same as those within thirty: $121,770 a year on average, against $119,485, a difference of 1.9%.
Key findings
- As of 24 September 2026, ScrapeHero tracks 2,019 Target locations in the United States, across 50 states and 1,462 distinct cities and towns. (More: Where the 2,019 locations are)
- 64.8% of US households, 83.8 million of 129.2 million, are within a 15-minute drive of a Target store, measured along real roads rather than as a straight-line radius. (More: Who can actually get to a Target)
- Coverage rises from 13.5% within a 5-minute drive to 81.9% within 30 minutes. A store on your doorstep and a store you could drive to are different things, which is why every figure on this page names its band. (More: Who can actually get to a Target)
- Households near a Target earn much the same whether they are 5 minutes away or 30: $121,770 against $119,485 a year on average. (More: Who lives near a Target, and what do they earn?)
- Households within a 15-minute drive of a Target earn $120,759 a year on average, against $113,517 for the country as a whole, an Income Capture Ratio of 1.064, where 1 would be exactly average. (More: Who lives near a Target, and what do they earn?)
- 67.3% of the households Target reaches within 15 minutes can reach two or more Target stores, so the footprint is denser than the store count alone implies. (More: Who can actually get to a Target)
- California has both the most Target stores of any state, 324, and the highest household reach, 88.4% within 15 minutes. (More: How many Target stores each state has, and how many households can reach them)
- Target has a store in 356 of the 387 US metropolitan areas. Los Angeles-Long Beach-Anaheim holds the most, 128 stores, reaching 98.6% of its households within 15 minutes. (More: Which markets does Target trade in?)
Where the 2,019 locations are
Target operates 2,019 stores in the United States, spread across 50 states and 1,462 separate cities and towns, and mostly in the towns and cities rather than between them.
The US Census marks every census block urban or rural. By that measure 1,960 of Target's 2,019 stand in an urban area (97.1%) and 46 in a rural one (2.3%)6. Of the people Target reaches within a 15-minute drive, 97.1% live in an urban area, against 80% of the country as a whole.
Some Target stores stand in crowded places and some in thinly populated ones, which makes an enormous difference to how many people are nearby. Sorted by the population density of their own trade areas, in people per square kilometre, the thinnest tenth have 10,659 households within a 15-minute drive8. The densest tenth have 205,008, roughly 19 times more. The people near the crowded ones are also better off, by $37,584 a year.
Who can actually get to a Target
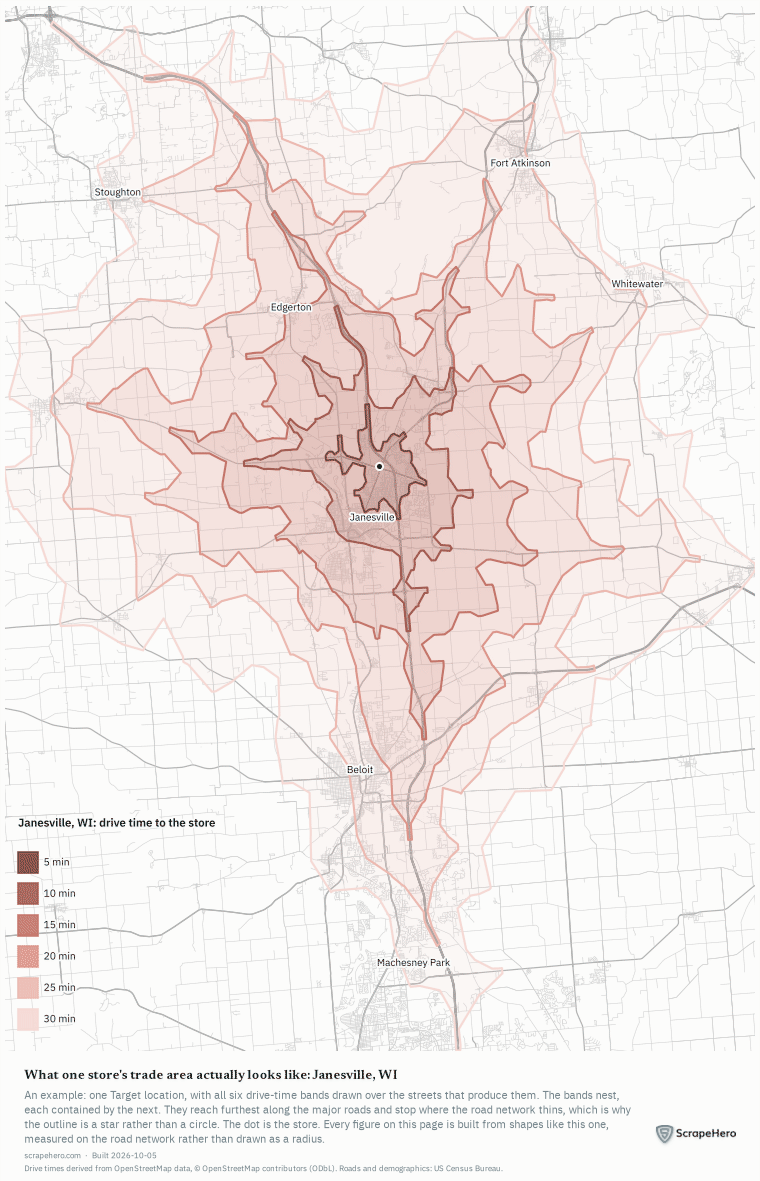
64.8% of US households can reach a Target inside a 15-minute drive. That is 83.8 million households of 129.2 million, or 217 million people. We work it out by taking every home in the country and asking how long it would take to drive to the nearest Target, at 5, 10, 15, 20, 25 and 30 minutes. A home near two Target stores counts once. The shape that comes out is the store's trade area9.
A drive time here does not know two things. It uses posted speed limits with no congestion model, so every figure on this page is an upper bound: a real drive in a dense market at peak hours is slower, and a minute of delay is a fifth of a five-minute budget against a thirtieth of a thirty-minute one. And it assumes a car, so a household with no vehicle is counted as reached while being unable to make the drive.5
9.8% of the households inside a 15-minute Target trade area own no vehicle, against 8.3% of households nationally.
Counting only households that own a vehicle moves Target's reach from 64.8% to 63.8%.
Target household reach at each drive time
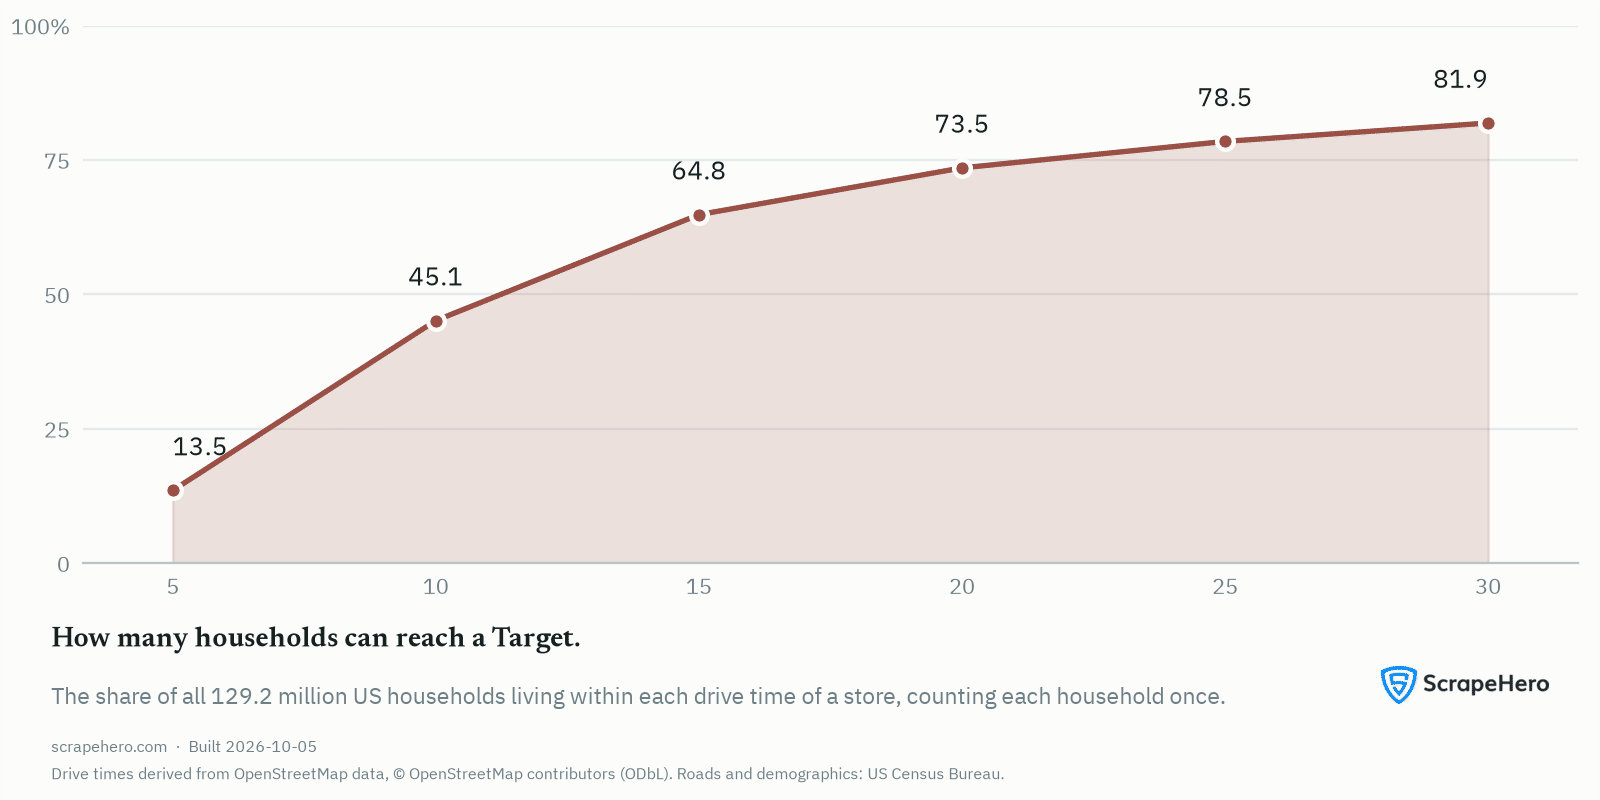
| Drive time | Households that can reach one | Share of all US households % |
|---|---|---|
| 5 min | 17,474,639 | 13.5 |
| 10 min | 58,298,023 | 45.1 |
| 15 min | 83,767,613 | 64.8 |
| 20 min | 95,011,911 | 73.5 |
| 25 min | 101,369,361 | 78.5 |
| 30 min | 105,796,238 | 81.9 |
Double the time from 15 minutes to 30 and the ground a store covers, its trade-area footprint, grows around 6 times bigger, and it picks up another 17.1% of US households.
How many households can reach more than one Target store
Most households that can reach a Target have more than one to choose from. 67.3% of the households that can reach a Target in 15 minutes can reach two or more of them. At five minutes 15.5% of the households that can reach a Target can reach a second one, and at thirty minutes 86.5%.
How much choice, though, varies enormously. 27.4 million households have exactly one Target within reach. Another 11.9 million have six or more.
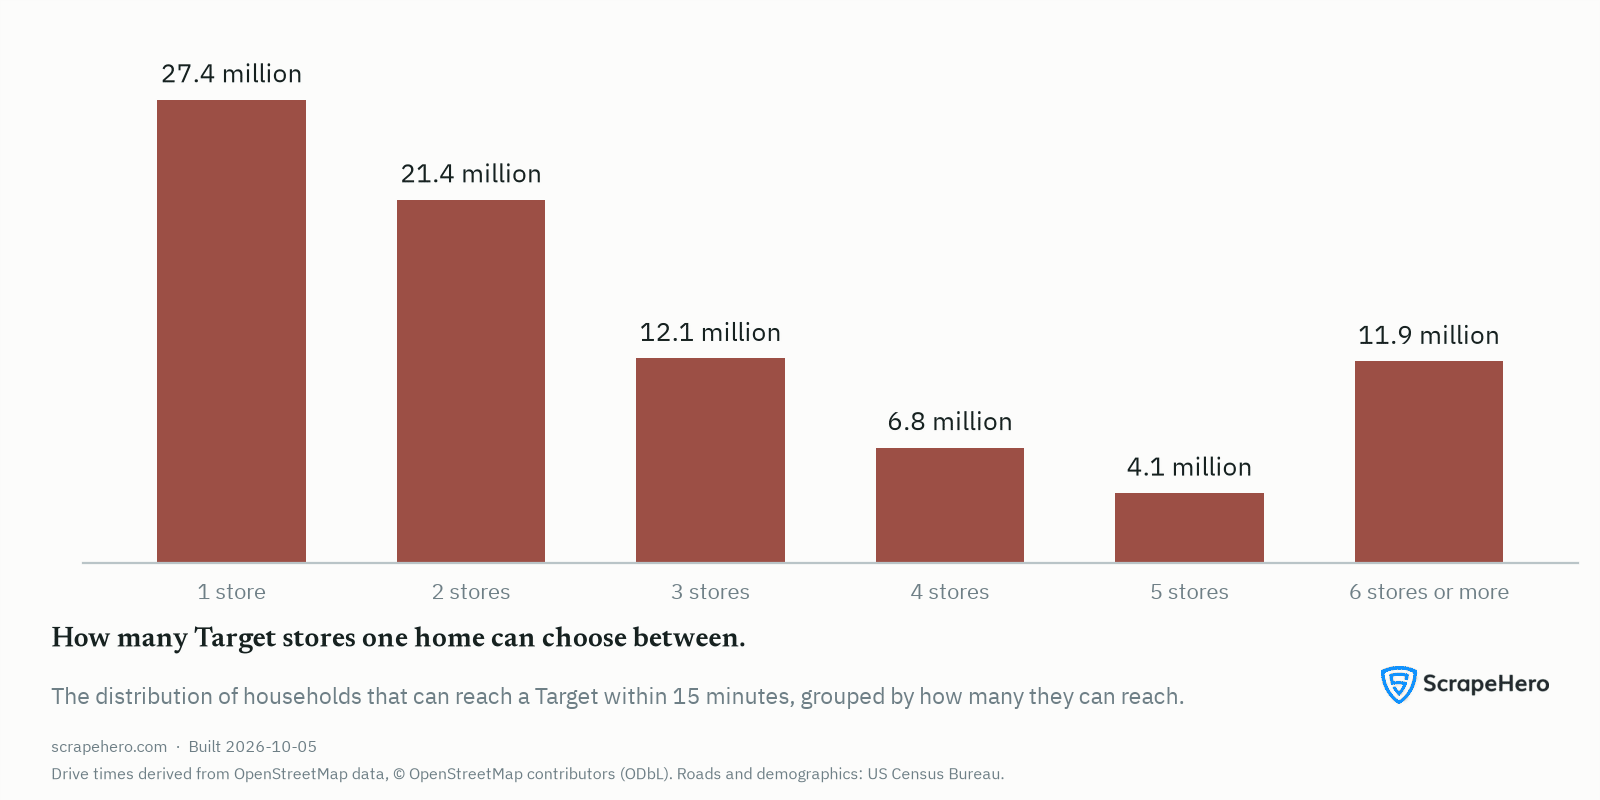
| Stores reachable | Households | Share of reached households % |
|---|---|---|
| 1 store | 27,352,973 | 32.7 |
| 2 stores | 21,449,093 | 25.6 |
| 3 stores | 12,086,581 | 14.4 |
| 4 stores | 6,825,595 | 8.1 |
| 5 stores | 4,140,256 | 4.9 |
| 6 stores or more | 11,913,115 | 14.2 |
Who lives near a Target, and what do they earn?
Households within a 15-minute drive of a Target earn $120,759 a year on average. The figure for the country as a whole is $113,517. So the people Target can reach earn 6% more than the national average. Added together, everyone in that catchment earns $10.12tn a year: the chain's Trade Area Buying Power.
On the Income Capture Ratio, which compares what the households a chain reaches earn against the country as a whole, 1 is exactly average and Target scores 1.064, somewhat above the middle. Above 1 means it reaches wealthier households than the country's average; below means less wealthy.
Households within five minutes of a Target earn $121,770 and those within thirty $119,485. The 1.9% between them is too small to read as a difference. Both sit 5% above the national average.
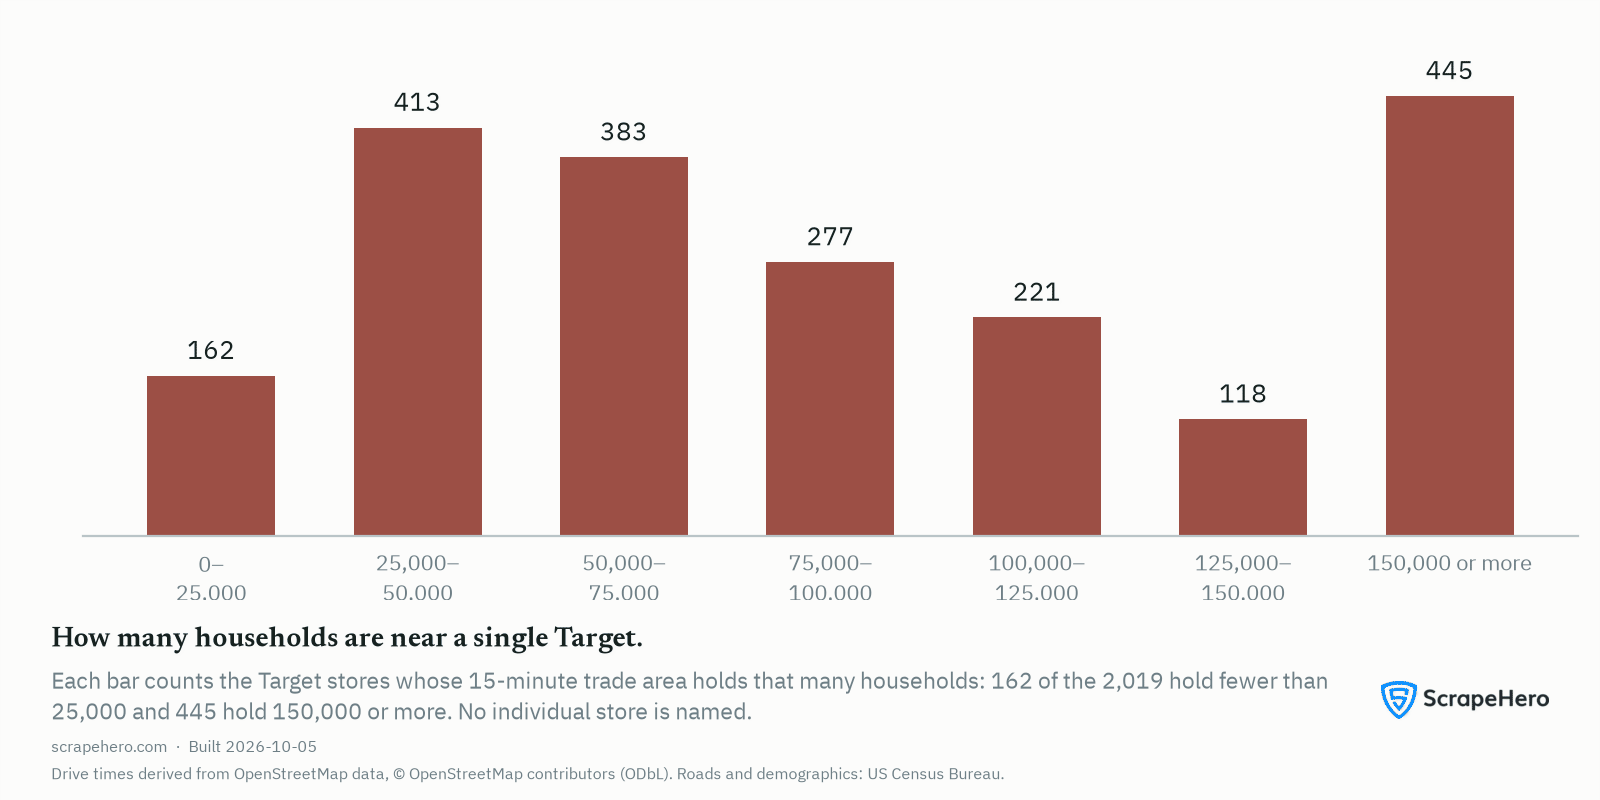
Store by store the numbers differ enormously. The typical Target, meaning the median store with half above it and half below, has 78,459 households within a 15-minute drive. Ranked by how many households are nearby, the bottom tenth of stores, the 10th percentile, have 27,570 nearby; the top tenth, the 90th percentile, have 243,467 or more.
Target trade-area size: how many households a single store has nearby
| Trade-area size (households) | Stores | Share of stores % |
|---|---|---|
| 0–25,000 | 162 | 8.0 |
| 25,000–50,000 | 413 | 20.5 |
| 50,000–75,000 | 383 | 19.0 |
| 75,000–100,000 | 277 | 13.7 |
| 100,000–125,000 | 221 | 10.9 |
| 125,000–150,000 | 118 | 5.8 |
| 150,000 or more | 445 | 22.0 |
What the people around each Target earn
Rank all 2,019 stores again, this time by the median household income of the people living around them, and the middle store sits at $114,413 a year. The bottom tenth are under $84,689 and the top tenth over $163,943. This page reports aggregates; it does not name individual stores.
Two ways to read trade-area income. Count every household Target reaches and the average income is $120,759, 6% above the national figure. Instead look at the typical store and ask what its neighbours earn, and the answer is $114,413, lower by 5%. Both are measured over the same stores: the first weights every household reached, the second takes the middle store.
Is Target trading in expensive places or cheap ones?
Expensive ones, slightly: local prices where Target trades run a little above the US average. On the Bureau of Economic Analysis's Regional Price Parities, which set the United States at 100 and measure every metro and state against it, the places Target trades in come out at 102.1.4 So the $120,759 its households earn on average is worth $118,321 once you allow for local prices, less than the raw figure suggests by $2,438.
How many Target stores each state has, and how many households can reach them
California has more Target stores than any other state, 324. The fewest is 1 in Vermont. There is no state without one.
Household Reach is the share of a state's households living within a 15-minute drive of at least one Target. California is the highest state at 88.4% and Vermont the lowest at 16.7%, a 5.3× range7. The figure for the country as a whole is 64.8%.
At the top the two measures agree: California leads on both. Further down the ranking they part company. Of the 26 states with 20 or more locations, these two sit furthest apart on the two measures. North Carolina is 10th by store count (57 locations) and 20th by household reach (49.6%). Connecticut is 23rd by store count (24 locations) and 10th by reach (73.2%).
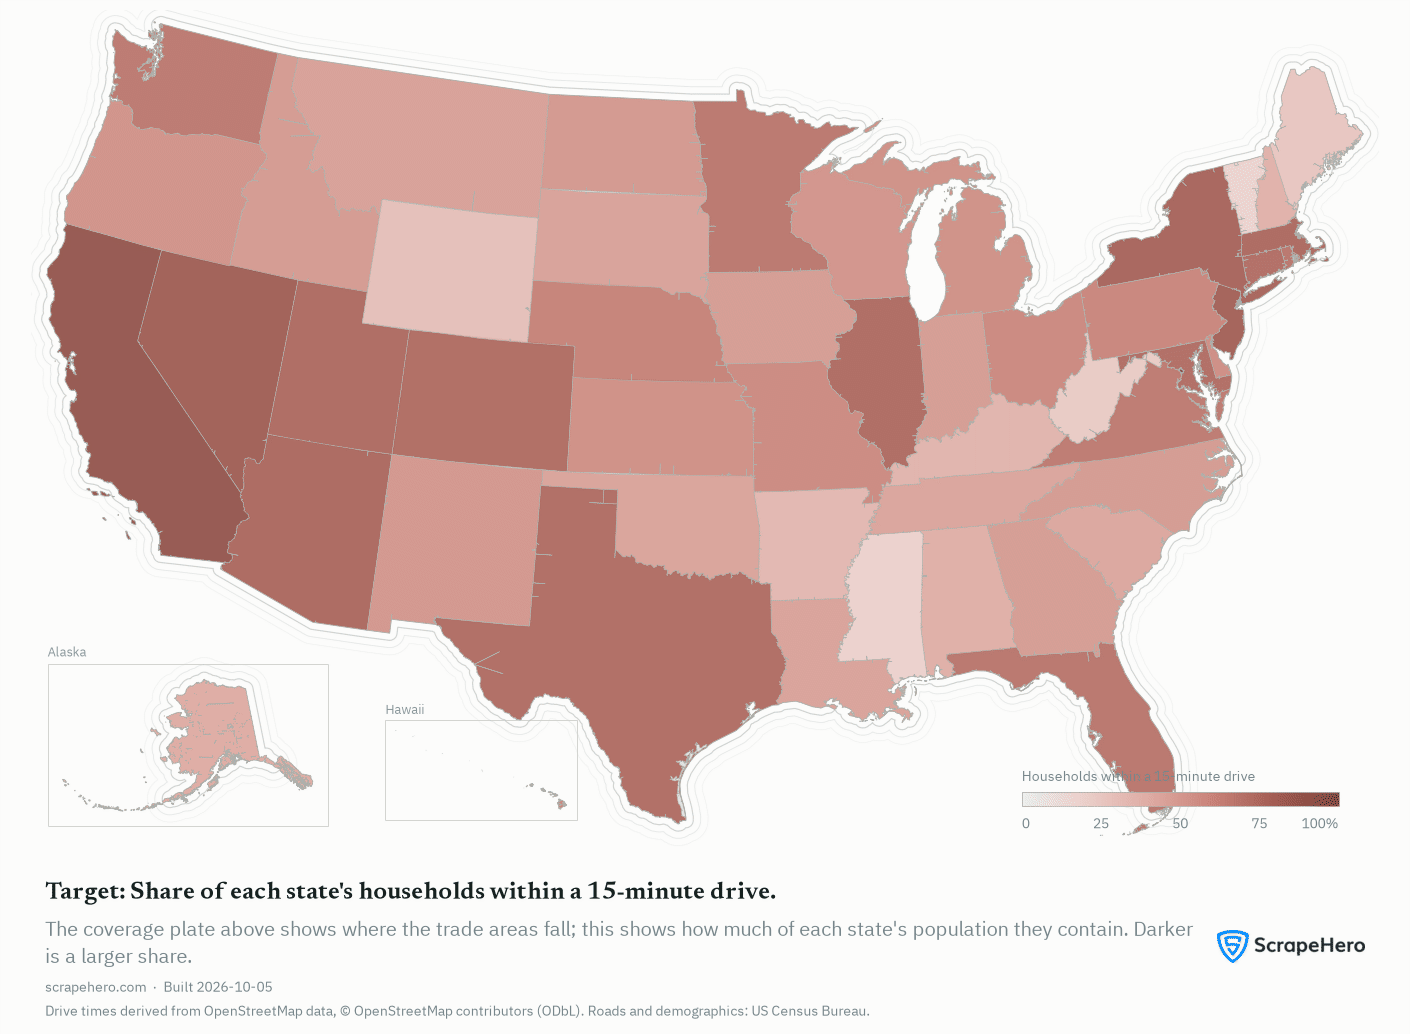
Figures cover the 50 states and the District of Columbia. Alaska and Hawaii are included, on the maps as well as in the tables. Puerto Rico, Guam and the other US territories are not covered.
Household Reach can be thin at 15 minutes and near-complete at thirty in the same state. New Hampshire gains 33.1 percentage points between the two, which says the stores there are positioned for a drive rather than for a neighbourhood.
Coverage is uneven enough to sort the states into four groups10: the ones Target nearly blankets, the broad ones, the partial ones and the thin ones. Of the states Target trades in, 8 are at or above 75% within 15 minutes and 3 are below 25%.
| State | Stores | Households within 5 min % | Households within 15 min % | Households within 30 min % | Households reached within 15 min per store | Coverage tier |
|---|---|---|---|---|---|---|
| District of Columbia[^7] | 4 | 40.3 | 99.6 | 100.0 | 80,832 | Saturated |
| California | 324 | 27.8 | 88.4 | 95.2 | 36,949 | Saturated |
| Nevada | 18 | 17.7 | 82.7 | 90.1 | 55,233 | Broad |
| New Jersey | 56 | 12.9 | 81.0 | 97.6 | 50,713 | Broad |
| New York | 108 | 32.0 | 78.3 | 90.4 | 55,872 | Broad |
| Arizona | 51 | 13.9 | 76.3 | 87.0 | 42,720 | Broad |
| Massachusetts | 51 | 16.1 | 75.6 | 94.6 | 41,302 | Broad |
| Utah | 18 | 13.6 | 75.4 | 85.6 | 47,100 | Broad |
| Illinois | 102 | 22.4 | 74.8 | 87.2 | 36,920 | Broad |
| Colorado | 46 | 16.9 | 74.5 | 86.0 | 38,472 | Broad |
| United States | 2,019 | 13.5 | 64.8 | 81.9 | 41,490 | Partial |
Target stores and household reach by US Census region
| Region | States with a store | Stores | Households within 15 min % | Households reached within 15 min | Region households, all | Households reached within 15 min per store |
|---|---|---|---|---|---|---|
| Northeast | 9 | 339 | 70.7 | 15,953,774 | 22,574,056 | 47,061 |
| Midwest | 12 | 465 | 59.9 | 16,755,243 | 27,971,901 | 36,033 |
| South | 17 | 661 | 57.9 | 28,816,156 | 49,758,750 | 43,595 |
| West | 13 | 554 | 77.0 | 22,242,441 | 28,904,629 | 40,149 |
Grouped into the four Census Bureau regions, Target reaches most of the West, where 77% of households are within a 15-minute drive, and least of the South at 57.9%. The South holds more stores, 661 against 554, and still reaches less of its own households.
Which markets does Target trade in?
Most: Target has a store in 356 of the 387 metropolitan areas in the United States. Below: which cities and metro areas it trades in, and how the network splits between big cities, small ones and the countryside.
Target stores by US city name, and by metropolitan area
A city name here is the postal city on a store's address. City limits are set by annexation, so they vary widely in how much of a market they contain. The table gives the store count for each city name alongside the metropolitan area it belongs to, and the share of that metro's stores the city holds11.
| City | State | Target in this city | Metropolitan area it belongs to | Target in that metro | City names in that metro | This city's share of its metro % |
|---|---|---|---|---|---|---|
| Chicago | Illinois | 24 | Chicago-Naperville-Elgin, IL-IN | 87 | 61 | 27.6 |
| Los Angeles | California | 17 | Los Angeles-Long Beach-Anaheim, CA | 128 | 81 | 13.3 |
| Houston | Texas | 16 | Houston-Pasadena-The Woodlands, TX | 41 | 23 | 39.0 |
| New York | New York | 14 | New York-Newark-Jersey City, NY-NJ | 107 | 76 | 13.1 |
| Las Vegas | Nevada | 11 | Las Vegas-Henderson-North Las Vegas, NV | 15 | 3 | 73.3 |
| San Antonio | Texas | 11 | San Antonio-New Braunfels, TX | 14 | 4 | 78.6 |
| San Jose | California | 11 | San Jose-Sunnyvale-Santa Clara, CA | 18 | 8 | 61.1 |
| Austin | Texas | 10 | Austin-Round Rock-San Marcos, TX | 18 | 8 | 55.6 |
Los Angeles-Long Beach-Anaheim spreads its Target stores across 81 separate city names.
San Antonio contains 78.6% of its metropolitan area's Target stores. Brooklyn contains 9.3% of its own; the remaining 90.7% of that market carries other city names.
Target stores and household reach across US metropolitan areas
City limits are a poor guide to a market, so the rest of this section uses metro areas instead: a city plus the surrounding counties whose residents commute into it. The formal name is a metropolitan statistical area, or a Core Based Statistical Area, and its boundary is drawn from commuting patterns rather than from city limits.3 And because a metro is a whole number of counties, rolling reach up to metro level is exact arithmetic rather than an approximation. Target stores sit in 674 US counties.
| Metropolitan area | Households in the metro, all | Stores | Households within 5 min % | Households within 15 min % | Households within 30 min % | Households reached within 15 min per store |
|---|---|---|---|---|---|---|
| New York-Newark-Jersey City, NY-NJ | 7,391,787 | 107 | 35.9 | 90.8 | 98.8 | 62,733 |
| Los Angeles-Long Beach-Anaheim, CA | 4,499,409 | 128 | 40.4 | 98.6 | 99.8 | 34,653 |
| Chicago-Naperville-Elgin, IL-IN | 3,643,783 | 87 | 28.3 | 89.0 | 99.0 | 37,291 |
| Dallas-Fort Worth-Arlington, TX | 2,891,725 | 53 | 14.2 | 88.5 | 97.6 | 48,275 |
| Houston-Pasadena-The Woodlands, TX | 2,661,739 | 41 | 14.7 | 84.4 | 97.9 | 54,811 |
| Philadelphia-Camden-Wilmington, PA-NJ-DE-MD | 2,467,761 | 47 | 19.2 | 85.6 | 98.3 | 44,930 |
| Washington-Arlington-Alexandria, DC-VA-MD-WV | 2,373,022 | 48 | 20.8 | 88.9 | 98.8 | 43,974 |
| Miami-Fort Lauderdale-West Palm Beach, FL | 2,334,797 | 37 | 19.3 | 91.6 | 99.5 | 57,833 |
Los Angeles-Long Beach-Anaheim is the strongest of the 25 largest metros Target trades in, at 98.6% of households within 15 minutes, and Pittsburgh the weakest at 65%.
In Pittsburgh even a thirty-minute drive reaches 90.9% of households, the lowest of the metros listed here. Adding stores would not necessarily change that: the figure is set by how far the road network reaches in half an hour, which is what we measure.
How thinly the stores are spread varies too. Measured as households per store, Minneapolis-St. Paul-Bloomington has one Target for every 23,540 households; New York-Newark-Jersey City has one for every 62,733, a 2.7× difference between two large American metros that no national figure can show.
31 metropolitan areas have no Target at all. The largest is Macon-Bibb County, 88,590 households.
Where Target stores sit: metropolitan, micropolitan, and everywhere else
Not everywhere is a city. Every county in the United States is one of three kinds: built around a city, built around a town, or neither. The official terms are metropolitan, for an urban core of 50,000 people or more, micropolitan, for 10,000 to 50,000, and outside any metro area for the rest. Where a chain's stores fall across the three says something a store count cannot.
| Settlement class | Stores | Share of stores % |
|---|---|---|
| Metropolitan | 1,949 | 96.5 |
| Micropolitan | 68 | 3.4 |
| Outside any metro or micro area | 2 | 0.1 |
70 of Target's 2,019 locations (3.5%) sit outside any metropolitan area: 3.4% in a county built around a town and 0.1% in one built around neither, against 96.5% in a metropolitan county.
| Settlement class | US households | Reached within 15 minutes % |
|---|---|---|
| Metropolitan | 110,886,900 | 74.6 |
| Micropolitan | 11,131,909 | 9.3 |
| Outside any metro or micro area | 7,190,527 | 0.3 |
Measured separately inside each class, Target reaches 74.6% of the households in metropolitan counties and 0.3% of those outside any metro or micro area.
How these numbers are produced
Each figure is a population-weighted apportionment of American Community Survey block-group estimates onto inbound drive-time catchments, computed per store on a routable OpenStreetMap network graph and deduplicated at census-block level across the chain.1
Three dates govern any drive time. The road network was built 21 August 2026, the store list was refreshed 24 September 2026, and the demographics are the ACS 2024 5-year release covering 2020–2024, with every money figure in 2024 dollars.2 Roads opened since the network was built do not appear, which understates reach slightly in fast-growing areas.
Limitations. Drive times use posted speed limits with no congestion model, so reach is optimistic in dense markets at peak hours. The store list is an independent scrape, deduplicated to one record per coordinate, so two genuinely distinct stores at one coordinate collapse into one and the count is a lower bound. US territories are outside the coverage used here, and the store list has no Target store in any of them. ACS estimates describe a five-year window centred before the store snapshot, so fast-growing markets are slightly understated. And these figures describe access, not patronage: nothing here measures who actually shops where.
This page states what is measured and where it falls short. The detailed statistical treatment is documented: apportionment validation, the sensitivity tests behind each parameter, the routing-engine comparisons, and the error bounds on every band. Buyers and academic researchers can enquire: https://www.scrapehero.com/contact-us/
The data behind this page
Every figure above is an aggregate. The underlying ScrapeHero Target Dataset has one row per location, carrying addresses, coordinates and attributes, refreshed on a schedule.
Get the datasetA report like this, for any chain
We build these to order, for chains in any country, and go further than this page does when a question needs it. Tell us what you are trying to measure.
Talk to usThe tables in full, for reference
The tables from further up, in full or as far as this page takes them. Every state and the District of Columbia appears. The city and metropolitan tables are longer here than above but still ranked and cut: Target trades in more places than a page can hold, so those two stop rather than running on. Sources: ACS 2024 5-year
Target store counts and household reach, state by state
All 50 states and the District of Columbia, each with the number of Target stores, the share of that state's households within 5, 15 and 30 minutes' drive of one, the households reached per store, and the coverage band. These are the 51 rows the shortened table further up is drawn from.
| State | Stores | Households within 5 min % | Households within 15 min % | Households within 30 min % | Households reached within 15 min per store | Coverage tier |
|---|---|---|---|---|---|---|
| District of Columbia[^7] | 4 | 40.3 | 99.6 | 100.0 | 80,832 | Saturated |
| California | 324 | 27.8 | 88.4 | 95.2 | 36,949 | Saturated |
| Nevada | 18 | 17.7 | 82.7 | 90.1 | 55,233 | Broad |
| New Jersey | 56 | 12.9 | 81.0 | 97.6 | 50,713 | Broad |
| New York | 108 | 32.0 | 78.3 | 90.4 | 55,872 | Broad |
| Arizona | 51 | 13.9 | 76.3 | 87.0 | 42,720 | Broad |
| Massachusetts | 51 | 16.1 | 75.6 | 94.6 | 41,302 | Broad |
| Utah | 18 | 13.6 | 75.4 | 85.6 | 47,100 | Broad |
| Illinois | 102 | 22.4 | 74.8 | 87.2 | 36,920 | Broad |
| Colorado | 46 | 16.9 | 74.5 | 86.0 | 38,472 | Broad |
| Texas | 162 | 13.3 | 74.1 | 87.4 | 50,271 | Broad |
| Maryland | 40 | 11.9 | 73.5 | 93.6 | 43,393 | Broad |
| Connecticut | 24 | 9.8 | 73.2 | 96.7 | 43,717 | Broad |
| Florida | 136 | 10.7 | 69.0 | 92.1 | 44,399 | Partial |
| Rhode Island | 4 | 2.0 | 68.9 | 88.0 | 76,054 | Partial |
| Minnesota | 72 | 20.0 | 68.6 | 82.0 | 21,985 | Partial |
| Washington | 38 | 11.2 | 67.5 | 84.3 | 54,464 | Partial |
| Virginia | 61 | 10.3 | 66.7 | 83.4 | 36,799 | Partial |
| Nebraska | 15 | 17.5 | 62.6 | 72.5 | 33,304 | Partial |
| Pennsylvania | 79 | 10.8 | 60.9 | 82.4 | 40,641 | Partial |
| Hawaii | 10 | 16.1 | 60.7 | 84.4 | 29,878 | Partial |
| Ohio | 65 | 6.9 | 59.3 | 78.0 | 44,372 | Partial |
| Missouri | 38 | 8.7 | 58.5 | 73.3 | 38,601 | Partial |
| Delaware | 5 | 6.0 | 56.4 | 77.9 | 45,382 | Partial |
| Kansas | 17 | 10.6 | 55.5 | 68.7 | 38,332 | Partial |
| Michigan | 54 | 7.3 | 55.4 | 80.9 | 41,839 | Partial |
| Oregon | 19 | 6.8 | 53.6 | 73.3 | 48,457 | Thin |
| Wisconsin | 38 | 8.7 | 52.9 | 75.0 | 34,510 | Thin |
| New Mexico | 10 | 14.1 | 51.8 | 64.3 | 43,387 | Thin |
| North Dakota | 4 | 11.7 | 51.3 | 57.9 | 42,475 | Thin |
| Idaho | 7 | 7.1 | 50.4 | 65.5 | 51,290 | Thin |
| North Carolina | 57 | 6.5 | 49.6 | 73.5 | 37,275 | Thin |
| Iowa | 22 | 10.0 | 49.6 | 62.8 | 29,652 | Thin |
| Indiana | 32 | 7.2 | 49.4 | 70.8 | 41,919 | Thin |
| Georgia | 51 | 5.7 | 49.2 | 73.7 | 39,342 | Thin |
| Montana | 7 | 12.6 | 47.0 | 59.0 | 30,786 | Thin |
| South Dakota | 6 | 7.7 | 46.5 | 58.0 | 28,316 | Thin |
| Louisiana | 16 | 5.6 | 45.7 | 73.7 | 51,596 | Thin |
| Oklahoma | 15 | 4.9 | 45.7 | 60.4 | 47,559 | Thin |
| Tennessee | 31 | 4.0 | 44.7 | 69.8 | 40,704 | Thin |
| South Carolina | 23 | 4.0 | 43.9 | 73.1 | 40,395 | Thin |
| Alaska | 3 | 2.3 | 41.3 | 51.4 | 37,240 | Thin |
| Alabama | 23 | 3.5 | 39.8 | 65.1 | 34,585 | Thin |
| New Hampshire | 10 | 2.4 | 37.9 | 71.0 | 21,069 | Thin |
| Kentucky | 15 | 5.7 | 36.0 | 56.3 | 43,495 | Thin |
| Arkansas | 9 | 4.2 | 34.4 | 52.8 | 46,056 | Thin |
| Wyoming | 3 | 6.0 | 29.3 | 33.8 | 23,798 | Thin |
| Maine | 6 | 2.4 | 25.6 | 57.5 | 25,469 | Thin |
| West Virginia | 7 | 1.1 | 23.1 | 46.1 | 24,089 | Thin |
| Mississippi | 6 | 1.7 | 18.4 | 36.1 | 35,216 | Thin |
| Vermont | 1 | 1.7 | 16.7 | 30.4 | 45,725 | Thin |
| United States | 2,019 | 13.5 | 64.8 | 81.9 | 41,490 | Partial |
Target store counts by city, and the metropolitan area each city sits in
US cities ranked by how many Target stores they hold, most first. Each row carries the city's own store count, the metropolitan area it belongs to, how many Target stores that whole metro holds, how many separate city names the metro spans, and the share of the metro's stores this one city accounts for. A city here is the postal city on a store's address, not a municipal boundary.
| City | State | Target in this city | Metropolitan area it belongs to | Target in that metro | City names in that metro | This city's share of its metro % |
|---|---|---|---|---|---|---|
| Chicago | Illinois | 24 | Chicago-Naperville-Elgin, IL-IN | 87 | 61 | 27.6 |
| Los Angeles | California | 17 | Los Angeles-Long Beach-Anaheim, CA | 128 | 81 | 13.3 |
| Houston | Texas | 16 | Houston-Pasadena-The Woodlands, TX | 41 | 23 | 39.0 |
| New York | New York | 14 | New York-Newark-Jersey City, NY-NJ | 107 | 76 | 13.1 |
| Las Vegas | Nevada | 11 | Las Vegas-Henderson-North Las Vegas, NV | 15 | 3 | 73.3 |
| San Antonio | Texas | 11 | San Antonio-New Braunfels, TX | 14 | 4 | 78.6 |
| San Jose | California | 11 | San Jose-Sunnyvale-Santa Clara, CA | 18 | 8 | 61.1 |
| Austin | Texas | 10 | Austin-Round Rock-San Marcos, TX | 18 | 8 | 55.6 |
| Brooklyn | New York | 10 | New York-Newark-Jersey City, NY-NJ | 107 | 76 | 9.3 |
| Miami | Florida | 10 | Miami-Fort Lauderdale-West Palm Beach, FL | 37 | 24 | 27.0 |
| Philadelphia | Pennsylvania | 10 | Philadelphia-Camden-Wilmington, PA-NJ-DE-MD | 47 | 35 | 21.3 |
| Phoenix | Arizona | 10 | Phoenix-Mesa-Chandler, AZ | 39 | 15 | 25.6 |
| San Diego | California | 10 | San Diego-Chula Vista-Carlsbad, CA | 27 | 13 | 37.0 |
| Dallas | Texas | 9 | Dallas-Fort Worth-Arlington, TX | 53 | 33 | 17.0 |
| Charlotte | North Carolina | 8 | Charlotte-Concord-Gastonia, NC-SC | 17 | 10 | 47.1 |
| Orlando | Florida | 8 | Orlando-Kissimmee-Sanford, FL | 21 | 12 | 38.1 |
| Pittsburgh | Pennsylvania | 8 | Pittsburgh, PA | 19 | 12 | 42.1 |
| Jacksonville | Florida | 7 | Jacksonville, FL | 11 | 5 | 63.6 |
| Sacramento | California | 7 | Sacramento-Roseville-Folsom, CA | 22 | 15 | 31.8 |
| Atlanta | Georgia | 6 | Atlanta-Sandy Springs-Roswell, GA | 38 | 31 | 15.8 |
Target store counts and household reach by US metropolitan area
US metropolitan areas ranked by how many households they contain, biggest first. Each row carries the number of Target stores in that metro and the share of the metro's households within 5, 15 and 30 minutes' drive of one, plus the households reached per store. A metropolitan area, formally a Core Based Statistical Area, is a city plus the surrounding counties that commute into it.
| Metropolitan area | Households in the metro, all | Stores | Households within 5 min % | Households within 15 min % | Households within 30 min % | Households reached within 15 min per store |
|---|---|---|---|---|---|---|
| New York-Newark-Jersey City, NY-NJ | 7,391,787 | 107 | 35.9 | 90.8 | 98.8 | 62,733 |
| Los Angeles-Long Beach-Anaheim, CA | 4,499,409 | 128 | 40.4 | 98.6 | 99.8 | 34,653 |
| Chicago-Naperville-Elgin, IL-IN | 3,643,783 | 87 | 28.3 | 89.0 | 99.0 | 37,291 |
| Dallas-Fort Worth-Arlington, TX | 2,891,725 | 53 | 14.2 | 88.5 | 97.6 | 48,275 |
| Houston-Pasadena-The Woodlands, TX | 2,661,739 | 41 | 14.7 | 84.4 | 97.9 | 54,811 |
| Philadelphia-Camden-Wilmington, PA-NJ-DE-MD | 2,467,761 | 47 | 19.2 | 85.6 | 98.3 | 44,930 |
| Washington-Arlington-Alexandria, DC-VA-MD-WV | 2,373,022 | 48 | 20.8 | 88.9 | 98.8 | 43,974 |
| Miami-Fort Lauderdale-West Palm Beach, FL | 2,334,797 | 37 | 19.3 | 91.6 | 99.5 | 57,833 |
| Atlanta-Sandy Springs-Roswell, GA | 2,313,055 | 38 | 7.1 | 67.3 | 94.9 | 40,955 |
| Boston-Cambridge-Newton, MA-NH | 1,940,688 | 38 | 21.7 | 80.2 | 98.4 | 40,939 |
| Phoenix-Mesa-Chandler, AZ | 1,892,613 | 39 | 15.7 | 89.1 | 97.1 | 43,234 |
| Detroit-Warren-Dearborn, MI | 1,768,816 | 29 | 8.9 | 72.0 | 97.2 | 43,910 |
| San Francisco-Oakland-Fremont, CA | 1,744,070 | 31 | 21.5 | 93.0 | 99.3 | 52,342 |
| Seattle-Tacoma-Bellevue, WA | 1,608,596 | 22 | 13.6 | 83.6 | 98.1 | 61,117 |
| Minneapolis-St. Paul-Bloomington, MN-WI | 1,477,259 | 55 | 26.3 | 87.6 | 98.0 | 23,540 |
| Riverside-San Bernardino-Ontario, CA | 1,450,250 | 32 | 14.3 | 82.2 | 93.2 | 37,243 |
| Tampa-St. Petersburg-Clearwater, FL | 1,330,303 | 20 | 10.4 | 73.4 | 99.0 | 48,802 |
| Denver-Aurora-Centennial, CO | 1,221,636 | 28 | 22.7 | 91.7 | 97.0 | 40,026 |
| San Diego-Chula Vista-Carlsbad, CA | 1,171,278 | 27 | 24.2 | 92.9 | 97.7 | 40,296 |
| St. Louis, MO-IL | 1,160,386 | 24 | 12.8 | 75.5 | 93.4 | 36,504 |
| Baltimore-Columbia-Towson, MD | 1,120,269 | 19 | 11.0 | 75.7 | 98.9 | 44,643 |
| Charlotte-Concord-Gastonia, NC-SC | 1,076,260 | 17 | 6.2 | 67.0 | 91.9 | 42,403 |
| Pittsburgh, PA | 1,061,705 | 19 | 8.3 | 65.0 | 90.9 | 36,337 |
| Orlando-Kissimmee-Sanford, FL | 1,022,315 | 21 | 10.6 | 75.9 | 98.2 | 36,953 |
| Portland-Vancouver-Hillsboro, OR-WA | 1,010,265 | 15 | 9.3 | 74.0 | 92.7 | 49,872 |
Target household reach, buying power and income by drive time, 5 to 30 minutes
The full table, with every measure the 15-minute headline is drawn from: household counts and their margin of error, population, Trade Area Buying Power, average household income, the Income Capture Ratio, self-overlap and the share of reached households with no vehicle. The MOE column is the American Community Survey's own 90% margin of error, propagated through the apportionment.
| Drive time | US households % | Households | MOE ± | Population | Household income $tn | Avg income $ | Income Capture Ratio | Self-overlap % | Carless % |
|---|---|---|---|---|---|---|---|---|---|
| 5 min | 13.5 | 17,474,639 | 29,458 | 43,385,469 | 2.13 | 121,770 | 1.073 | 15.5 | 16.8 |
| 10 min | 45.1 | 58,298,023 | 54,786 | 149,848,897 | 7.04 | 120,813 | 1.064 | 42.6 | 11.0 |
| 15 min | 64.8 | 83,767,613 | 66,293 | 217,009,346 | 10.12 | 120,759 | 1.064 | 67.3 | 9.8 |
| 20 min | 73.5 | 95,011,911 | 70,560 | 246,867,383 | 11.45 | 120,530 | 1.062 | 78.9 | 9.3 |
| 25 min | 78.5 | 101,369,361 | 72,687 | 263,771,796 | 12.18 | 120,119 | 1.058 | 83.7 | 9.0 |
| 30 min | 81.9 | 105,796,238 | 74,037 | 275,402,149 | 12.64 | 119,485 | 1.053 | 86.5 | 8.9 |
How to cite this report
These figures may be quoted with attribution. A named metric such as Household Reach or Income Capture Ratio should carry its definition and drive-time band, because the number is not meaningful without them.
ScrapeHero. "Target Store Locations in the USA: Count, Drive-Time Reach and Trade-Area Demographics (2026)." ScrapeHero Target Dataset, 24 September 2026; American Community Survey 2024 5-year estimates. https://www.scrapehero.com/research/trade-area-studies/target-usa/
This page is the summary. The data is the product. Every figure above is an aggregate. The underlying dataset has one row per location, carrying addresses, coordinates and attributes, for Target and other US chains, refreshed on a schedule: https://www.scrapehero.com/store/
What the words on this page mean
Plain definitions for the vocabulary of retail location analysis and site selection. Each term is used somewhere above.
- Trade area
- The area from which a store can be reached within a given drive, measured along real roads. It describes access, not observed customer origin.
- Trade-area footprint
- The total ground a chain covers once every store's trade area is combined. Overlaps are counted once, so the footprint is smaller than the sum of the parts.
- Urban area
- The US Census Bureau's 2020 urban/rural classification, applied to every census block. A block is urban if it falls inside a densely settled territory the Bureau delineates after each decennial census; everything else is rural. Nationally 80% of people live in an urban area. It is a published classification, not one of ours, and it is not the same thing as a metropolitan area, which is drawn from commuting patterns.
- Metropolitan area
- A city plus the surrounding counties whose residents commute into it, as delineated by the US Office of Management and Budget. Formally a Core Based Statistical Area, or CBSA. The boundary follows commuting patterns rather than city limits, and a metro is always a whole number of counties, which is why reach can be rolled up to metro level exactly. It is not the same thing as an urban area, which is the Census Bureau's density classification applied block by block.
- Trade-area size
- How many people or households one store has within its own trade area, also called trade-area population and trade-area households. It describes the area around a store, not the store: nothing here measures floor area, product range or takings.
- Drive-time isochrone
- The technical name for the shape we measure: everywhere reachable within a set number of minutes' driving. A drive-time isochrone follows the road network, so it stretches along highways and stops where the roads do.
- Drive-time band
- One of the six distances measured here: 5, 10, 15, 20, 25 and 30 minutes. Every figure on this page names the band it belongs to.
- Household Reach
- The share of all US households living within a given drive of at least one store. Households near two stores are counted once. For Target at 15 minutes it is 64.8%.
- Trade Area Buying Power
- The total household income earned by everyone inside the trade area, $10.12tn for Target at 15 minutes. It is a measure of the money in the area, not of what anyone spends in the store.
- Income Capture Ratio
- Whether a chain reaches wealthier or poorer households than the country average. It is the trade area's share of national household income divided by its share of households; 1 is the national average. Target scores 1.064.
- Self-overlap
- The share of reached households that can get to two or more of the same chain's stores. It is 67.3% for Target at 15 minutes.
- Census block group
- The small area the census reports its figures for, roughly 600 to 3,000 people, about a neighbourhood. It is the finest grain at which the American Community Survey publishes income.
- American Community Survey (ACS)
- The US Census Bureau survey behind every demographic figure here. The 5-year release averages responses over five years to make small areas reliable; this page uses ACS 2024 5-year covering 2020–2024.
Frequently asked questions
- How many Target stores are there in the USA?
- ScrapeHero tracks 2,019 Target locations in the United States as of 24 September 2026, across 50 states. This is an independently scraped count, deduplicated to one record per coordinate.
- What percentage of Americans live near a Target?
- 64.8% of US households, 83.8 million of 129.2 million, are within a 15-minute drive of a Target. At 30 minutes it is 81.9%, and at 5 minutes 13.5%.
- Which state has the most Target stores?
- California has the most locations (324), and it is also the state where Target reaches the largest share of households, 88.4%. Store count and household reach are different questions, and here one state answers both.
- How is Target's trade area calculated?
- Each store's trade area is a drive-time isochrone computed on the OpenStreetMap road network: the set of places genuinely reachable in N minutes of driving. Census block groups are apportioned into it by population, so a block group that is half inside contributes the half that is actually inside.
- Are Target trade areas wealthier or poorer than the US average?
- The average household inside a Target 15-minute trade area earns $120,759, against $113,517 for the US. That is an Income Capture Ratio of 1.064, wealthier.
- How often is this Target location data updated?
- The store list behind this page was last refreshed on 24 September 2026. Demographic inputs are the ACS 2024 5-year release. Drive-time polygons are recomputed when the road network is rebuilt, most recently 21 August 2026.
- Can I download the Target store list?
- Yes. This page publishes aggregates; the underlying dataset has one row per location with addresses, coordinates and attributes, for Target and other US chains: https://www.scrapehero.com/store/
- What is a trade area?
- A trade area is the area from which a store can be reached within a given drive, also called a market area, a catchment area, a store catchment or a trading area. It describes access, not observed visits.
- What is Household Reach?
- Household Reach is the share of all US households living within a given drive of at least one store, with households near two stores counted once. For Target at 15 minutes it is 64.8%.
- What is Trade Area Buying Power?
- Trade Area Buying Power is the total household income earned by everyone inside a chain's trade area. It is $10.12tn for Target at 15 minutes, in 2024 dollars. It measures the money in the area, not what anyone spends in the store.
Sources and definitions
- Drive-time catchments computed on an OpenStreetMap street network with OpenRouteService 9.10.0; demographics from the US Census Bureau, American Community Survey 2020–2024 five-year estimates, at block-group level. ↩
- Street network data © OpenStreetMap contributors, available under the Open Database License (ODbL), https://opendatacommons.org/licenses/odbl/. Census Bureau data are in the public domain. ↩
- Metropolitan and micropolitan area definitions: US Office of Management and Budget, Core Based Statistical Area delineations, as published. ↩
- Price levels: US Bureau of Economic Analysis, Regional Price Parities; inflation adjustment where used: US Bureau of Labor Statistics, Consumer Price Index. ↩
- Vehicle availability: US Census Bureau, American Community Survey table B25044, Tenure by Vehicles Available, at block-group level. Its universe is 127.46 million occupied housing units at the 2023 five-year estimates, against the 129.2 million households the reach figures are measured against at the 2024 estimates. The vehicle shares on this page are computed within B25044's own universe, so the one-year difference does not enter them. ↩
- The two figures do not sum to 2,019 because 13 stores sit just offshore of every mapped census block group. They are left unclassified rather than assigned to a side. ↩
- The District of Columbia is in this table because the coverage it reports is real, but it is not a state, so it is left out of the highest-state and lowest-state figures. On some chains its reach is higher than any state's. ↩
- Density groups are ours, not a published classification: each store is grouped by the population of its own 15-minute trade area divided by that area, cut at 100, 500 and 1,500 people per square kilometre. They describe how crowded a store's catchment is and say nothing about whether the store is in a town, which is the separate Census urban and rural question answered above; the two do not agree, because the Census urban line sits near 386 people per square kilometre while the densest group here starts at 1,500. ↩
- A trade area, as this page uses the term, is the set of places a driver could set off from and still reach the store inside the time. It is our definition and our choice of 15 minutes as the headline, not a property of the store. It measures who can get there: any reach figure holds only for its own drive time, and none of them says anything about who actually goes. ↩
- Saturated, broad, partial and thin are our own labels, not a published classification: they are the 15-minute household reach in each state, cut at 85%, 70% and 55%. They describe how much of a state's population sits within a 15-minute drive and nothing about how a state performs commercially. ↩
- A city's share is the stores carrying that postal city name divided by all stores anywhere in the metropolitan area it belongs to. A city is assigned to the metro where most of its stores fall, so a city name straddling two metros is attributed to one of them. Shares for cities in the same metro therefore do not add up to 100%: each is measured against the whole metro, and the remaining city names in it carry the rest. New York and Brooklyn, for instance, are separate city names inside New York-Newark-Jersey City, NY-NJ, which holds 107 stores in total, so each is measured against that same denominator. ↩