About the Report: This report analyses the location footprint of the largest fast food chains in the UK. It examines store distribution across regions, states, and cities and connects those patterns to consumer behaviour and market size data.
Data sources:
- Location data: ScrapeHero Data Store
- Market size & consumer behaviour: Mordor Intelligence and Market Research Future
Want to easily download accurate, updated, affordable, and ready to use the POI data of a retail brand?
What this report covers:
- Total location counts across 10 major fast food chains in the UK
- Regional and city-level store distribution across England, Scotland, Wales, and Northern Ireland
- Store density in cities with high Gen Z populations
- Store presence in cities connected to the UK’s top 10 airports by passenger traffic
- UK quick service restaurant market share by service type and outlet type
- UK fast food market size for 2024 and 2025
Introduction to Fast Food Chains in the UK
According to Market Research Future, the UK fast food market grew from $22.23 billion in 2024 to $24.39 billion in 2025; a 9.7% jump in a single year.
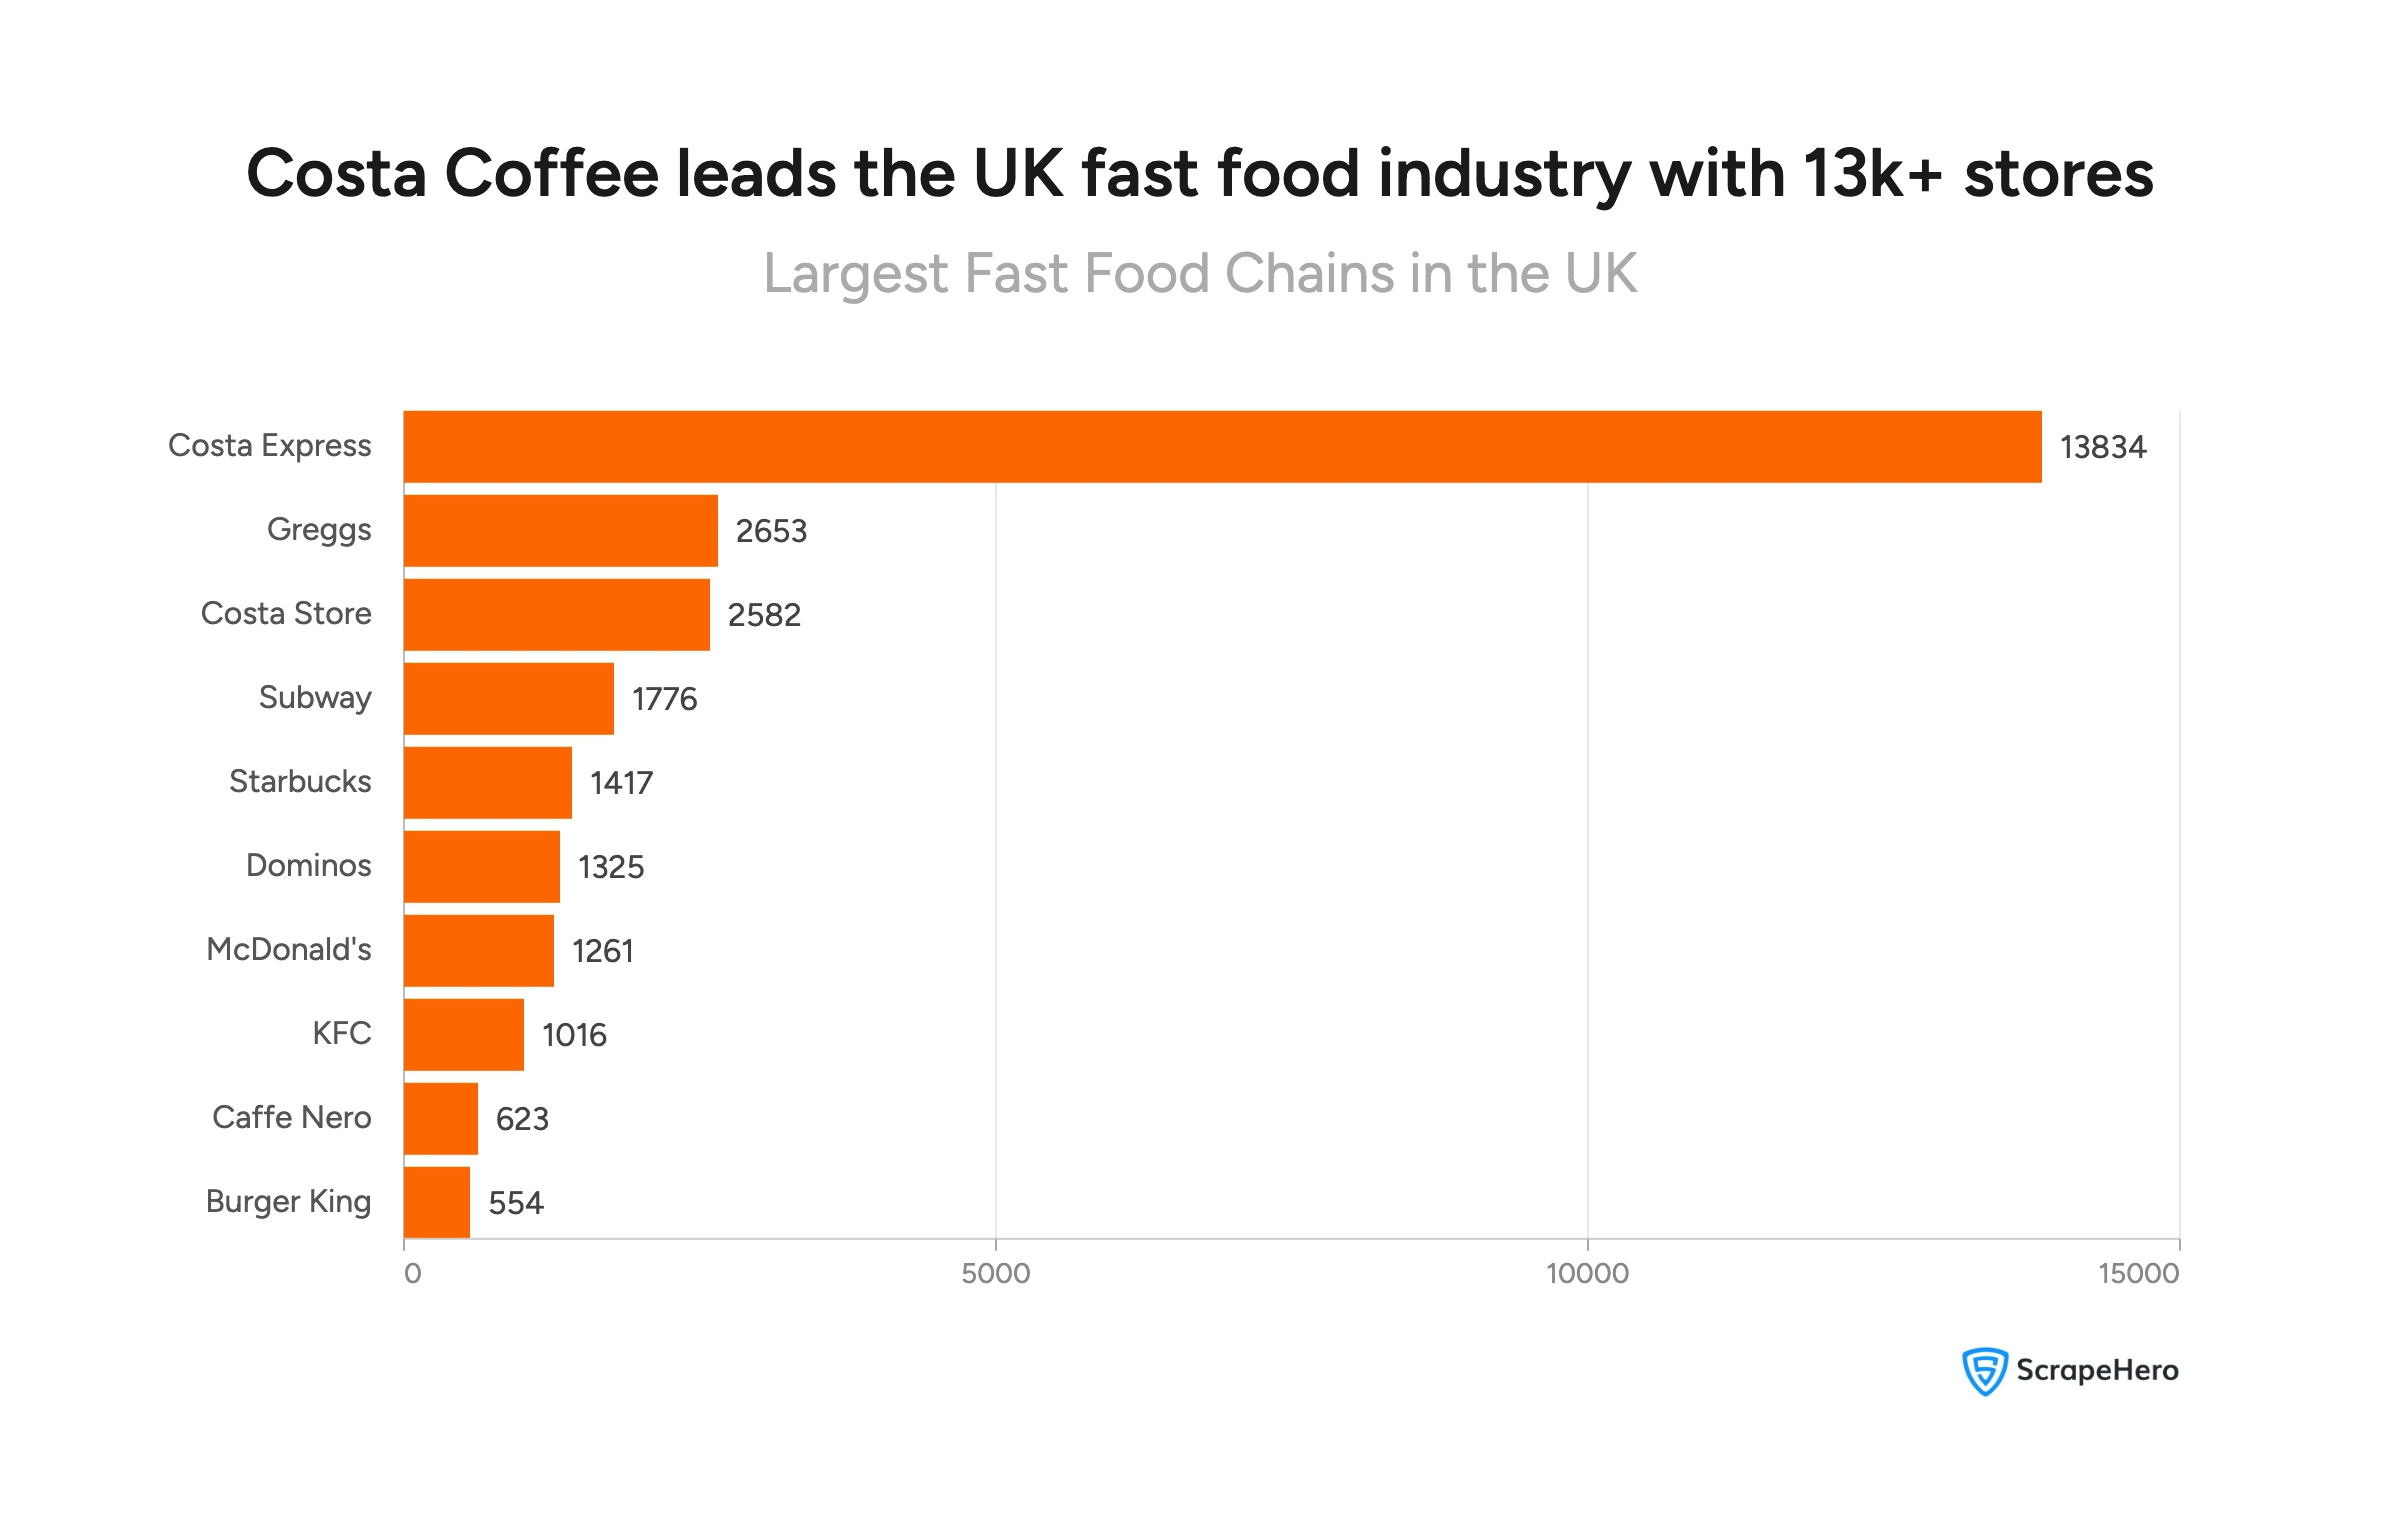
The most dominant fast food chains in the UK are Costa Express, Greggs, and Costa Store, with over 2,500 locations each. Costa Express alone operates 13,834 stores, making it the undisputed market leader by a significant margin.
But dominance isn’t evenly distributed. Store counts, regional penetration, and consumer behaviour tell a more complex story, one that matters if you’re analysing where this market is headed.
What are the Major Fast Food Chains in the UK?
The UK’s fast food landscape is led by 10 major chains spanning coffee, burgers, pizza, and sandwiches:
Take a look at the Costa Express locations in the UK here!
How Are Fast Food Chains Distributed Across the UK?
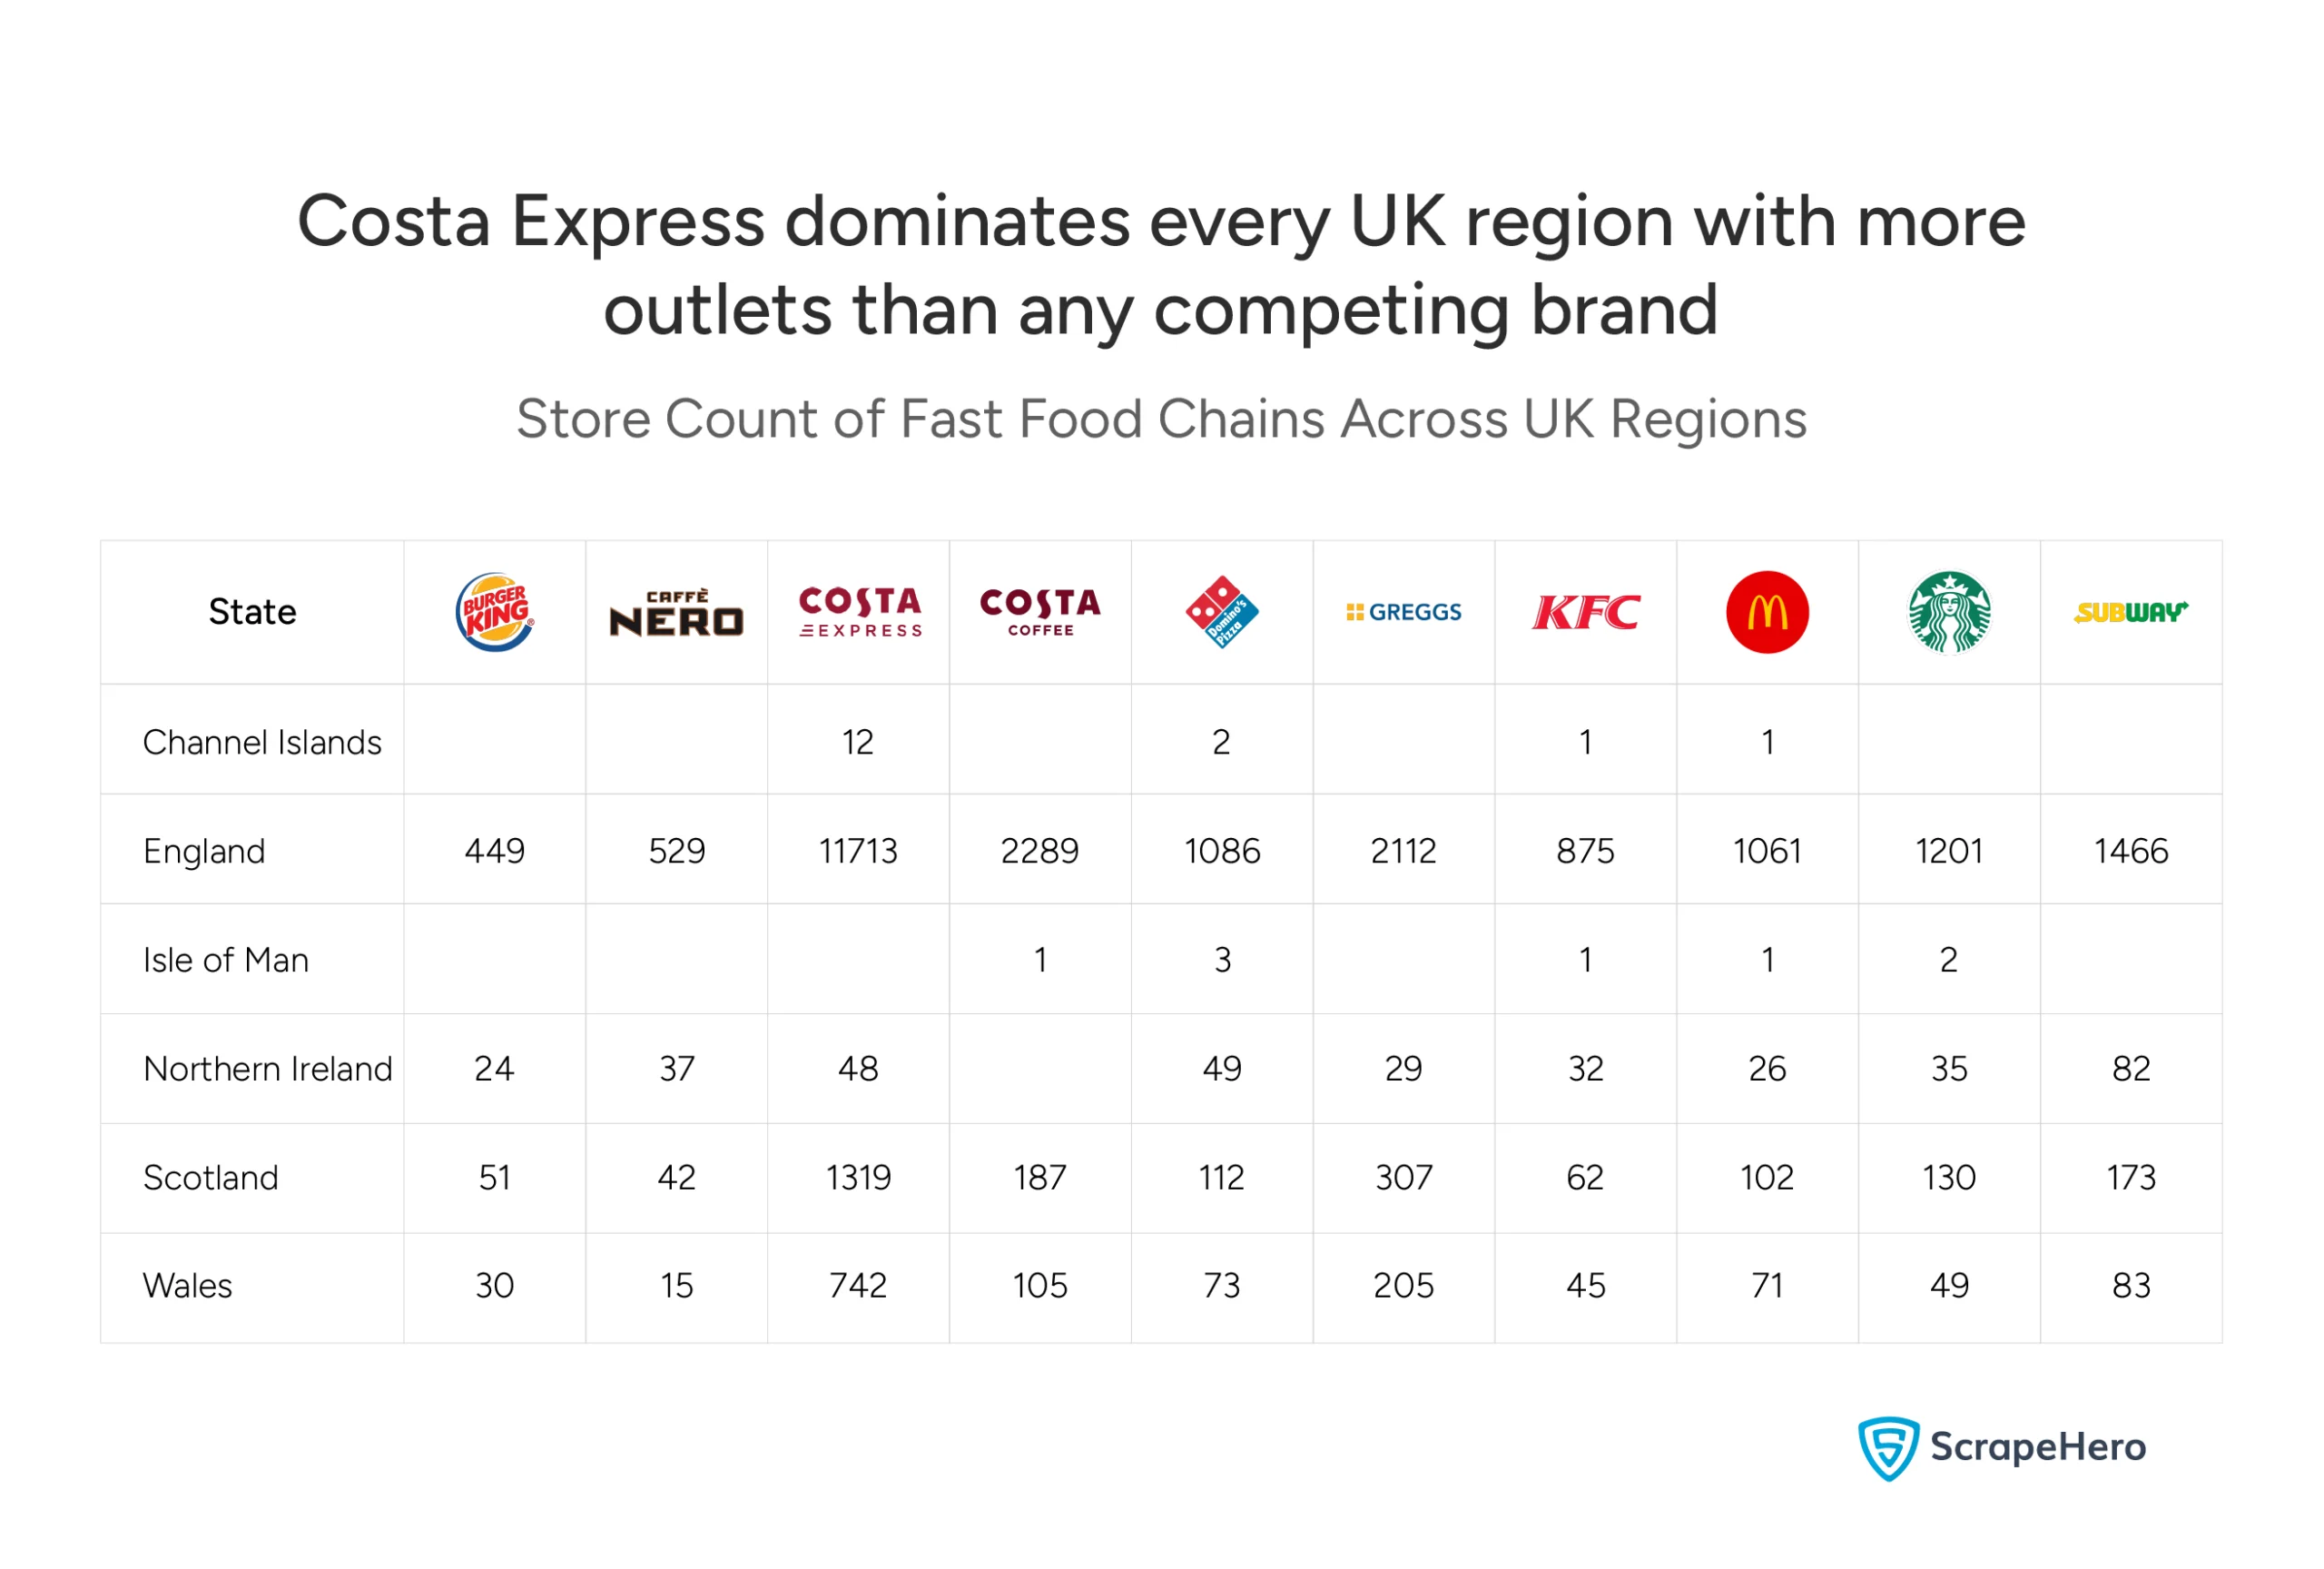
The UK fast food market is heavily concentrated in England. For most brands, England accounts for the vast majority of total store count, consistent with its ~84% share of the UK population (56 million people).
But population size alone doesn’t explain everything.
Scotland and Wales show stronger fast food penetration per person than England.
From our analysis, we have gathered that in England, Costa Express operates 209 stores per million people. In Scotland, with a population of 5.5 million, that number rises to 240 stores per million. For most, though not all brands, store density outside England is higher than within it.
Northern Ireland, though, differs. Store counts remain low across all brands, making it the most underserved region in the UK.
Key regional takeaways:
- England leads in absolute store count across all 10 brands
- Scotland and Wales have higher store density per person than England for most brands
- Northern Ireland has the lowest store counts across every brand
- Channel Islands and Isle of Man have minimal presence
How Do Fast Food Chains in the UK Compete at the City Level?
London leads every other UK city in total store count across all 10 brands. But the more telling story is what happens beyond London.
Costa Express has 3 to 5 times more stores than the next largest brand in every major city. No other chain comes close in any city analysed. This gap is consistent whether you’re looking at Glasgow, Birmingham, or Cardiff.
Among the remaining brands, patterns diverge sharply:
- Subway and Starbucks show a strong urban-centre focus
- McDonald’s and KFC are more consistently distributed but less dense in city centres compared to commuter-led brands
- Greggs performs stronger in northern and working-city markets than in tourist-heavy centres
Scottish cities and tourism-heavy locations show higher-than-expected store density relative to their size.
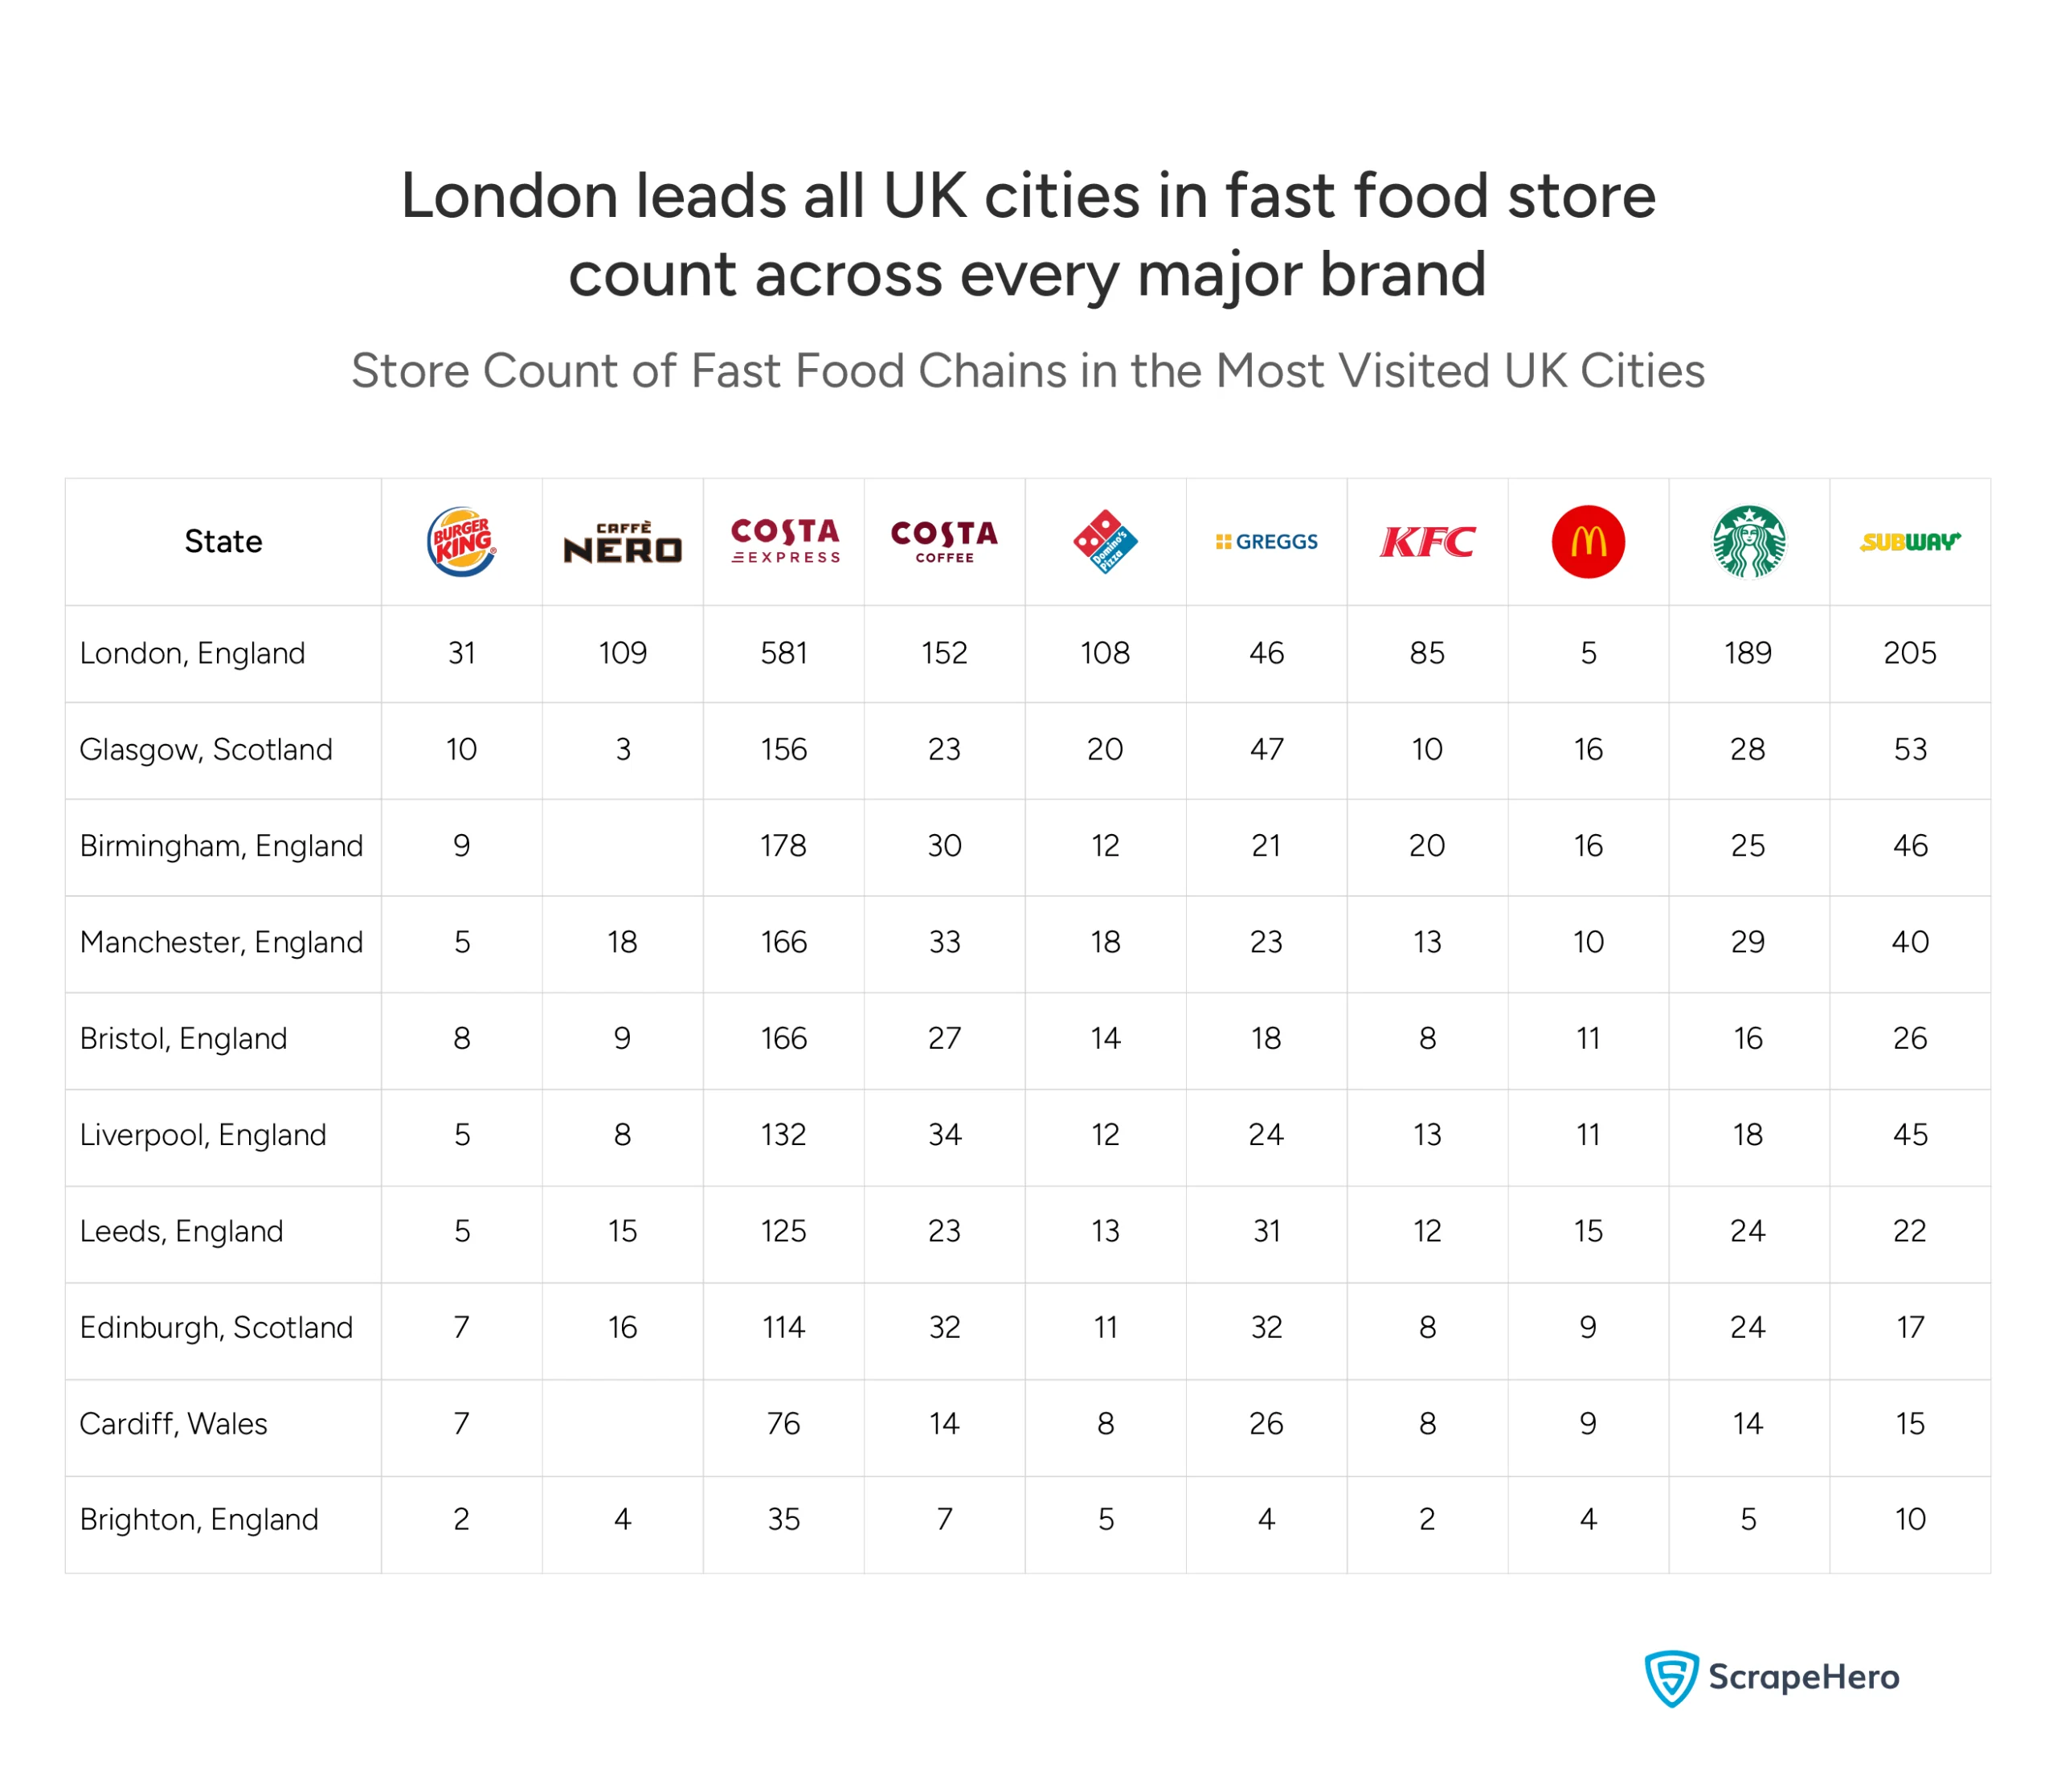
City-level takeaways:
- London, England, has the highest store count across all brands
- Glasgow, Scotland, has the second highest store count among all cities analysed
- Brighton, England, has the lowest store counts among all cities analysed
Where Gen Z Lives and Where Fast Food Isn’t Following
Gen Z in the UK is disproportionately concentrated in large cities and university hubs. This concentration directly aligns with high fast food store density in most cities — but not all.
Birmingham and Manchester lead Gen Z cities in total store count, with 178 and 166 stores respectively across all brands. Costa Express is the dominant brand in every Gen Z-concentrated city, consistent with its overall market leadership.
Subway shows a notable presence in Gen Z cities specifically.
The most significant gap in the data is Barking, England. Barking is a fast-growing, ethnically diverse area with a large Gen Z and young millennial population. Yet it has the lowest store counts of all cities in this category — and some chains have no presence there at all.
Key observations from Gen Z cities:
- Birmingham and Manchester have the highest store counts among Gen Z-concentrated cities
- Subway has a notably strong presence in Gen Z cities relative to other non-coffee brands
- Barking, England is the most underserved Gen Z city — with minimal presence from most brands and zero presence from some
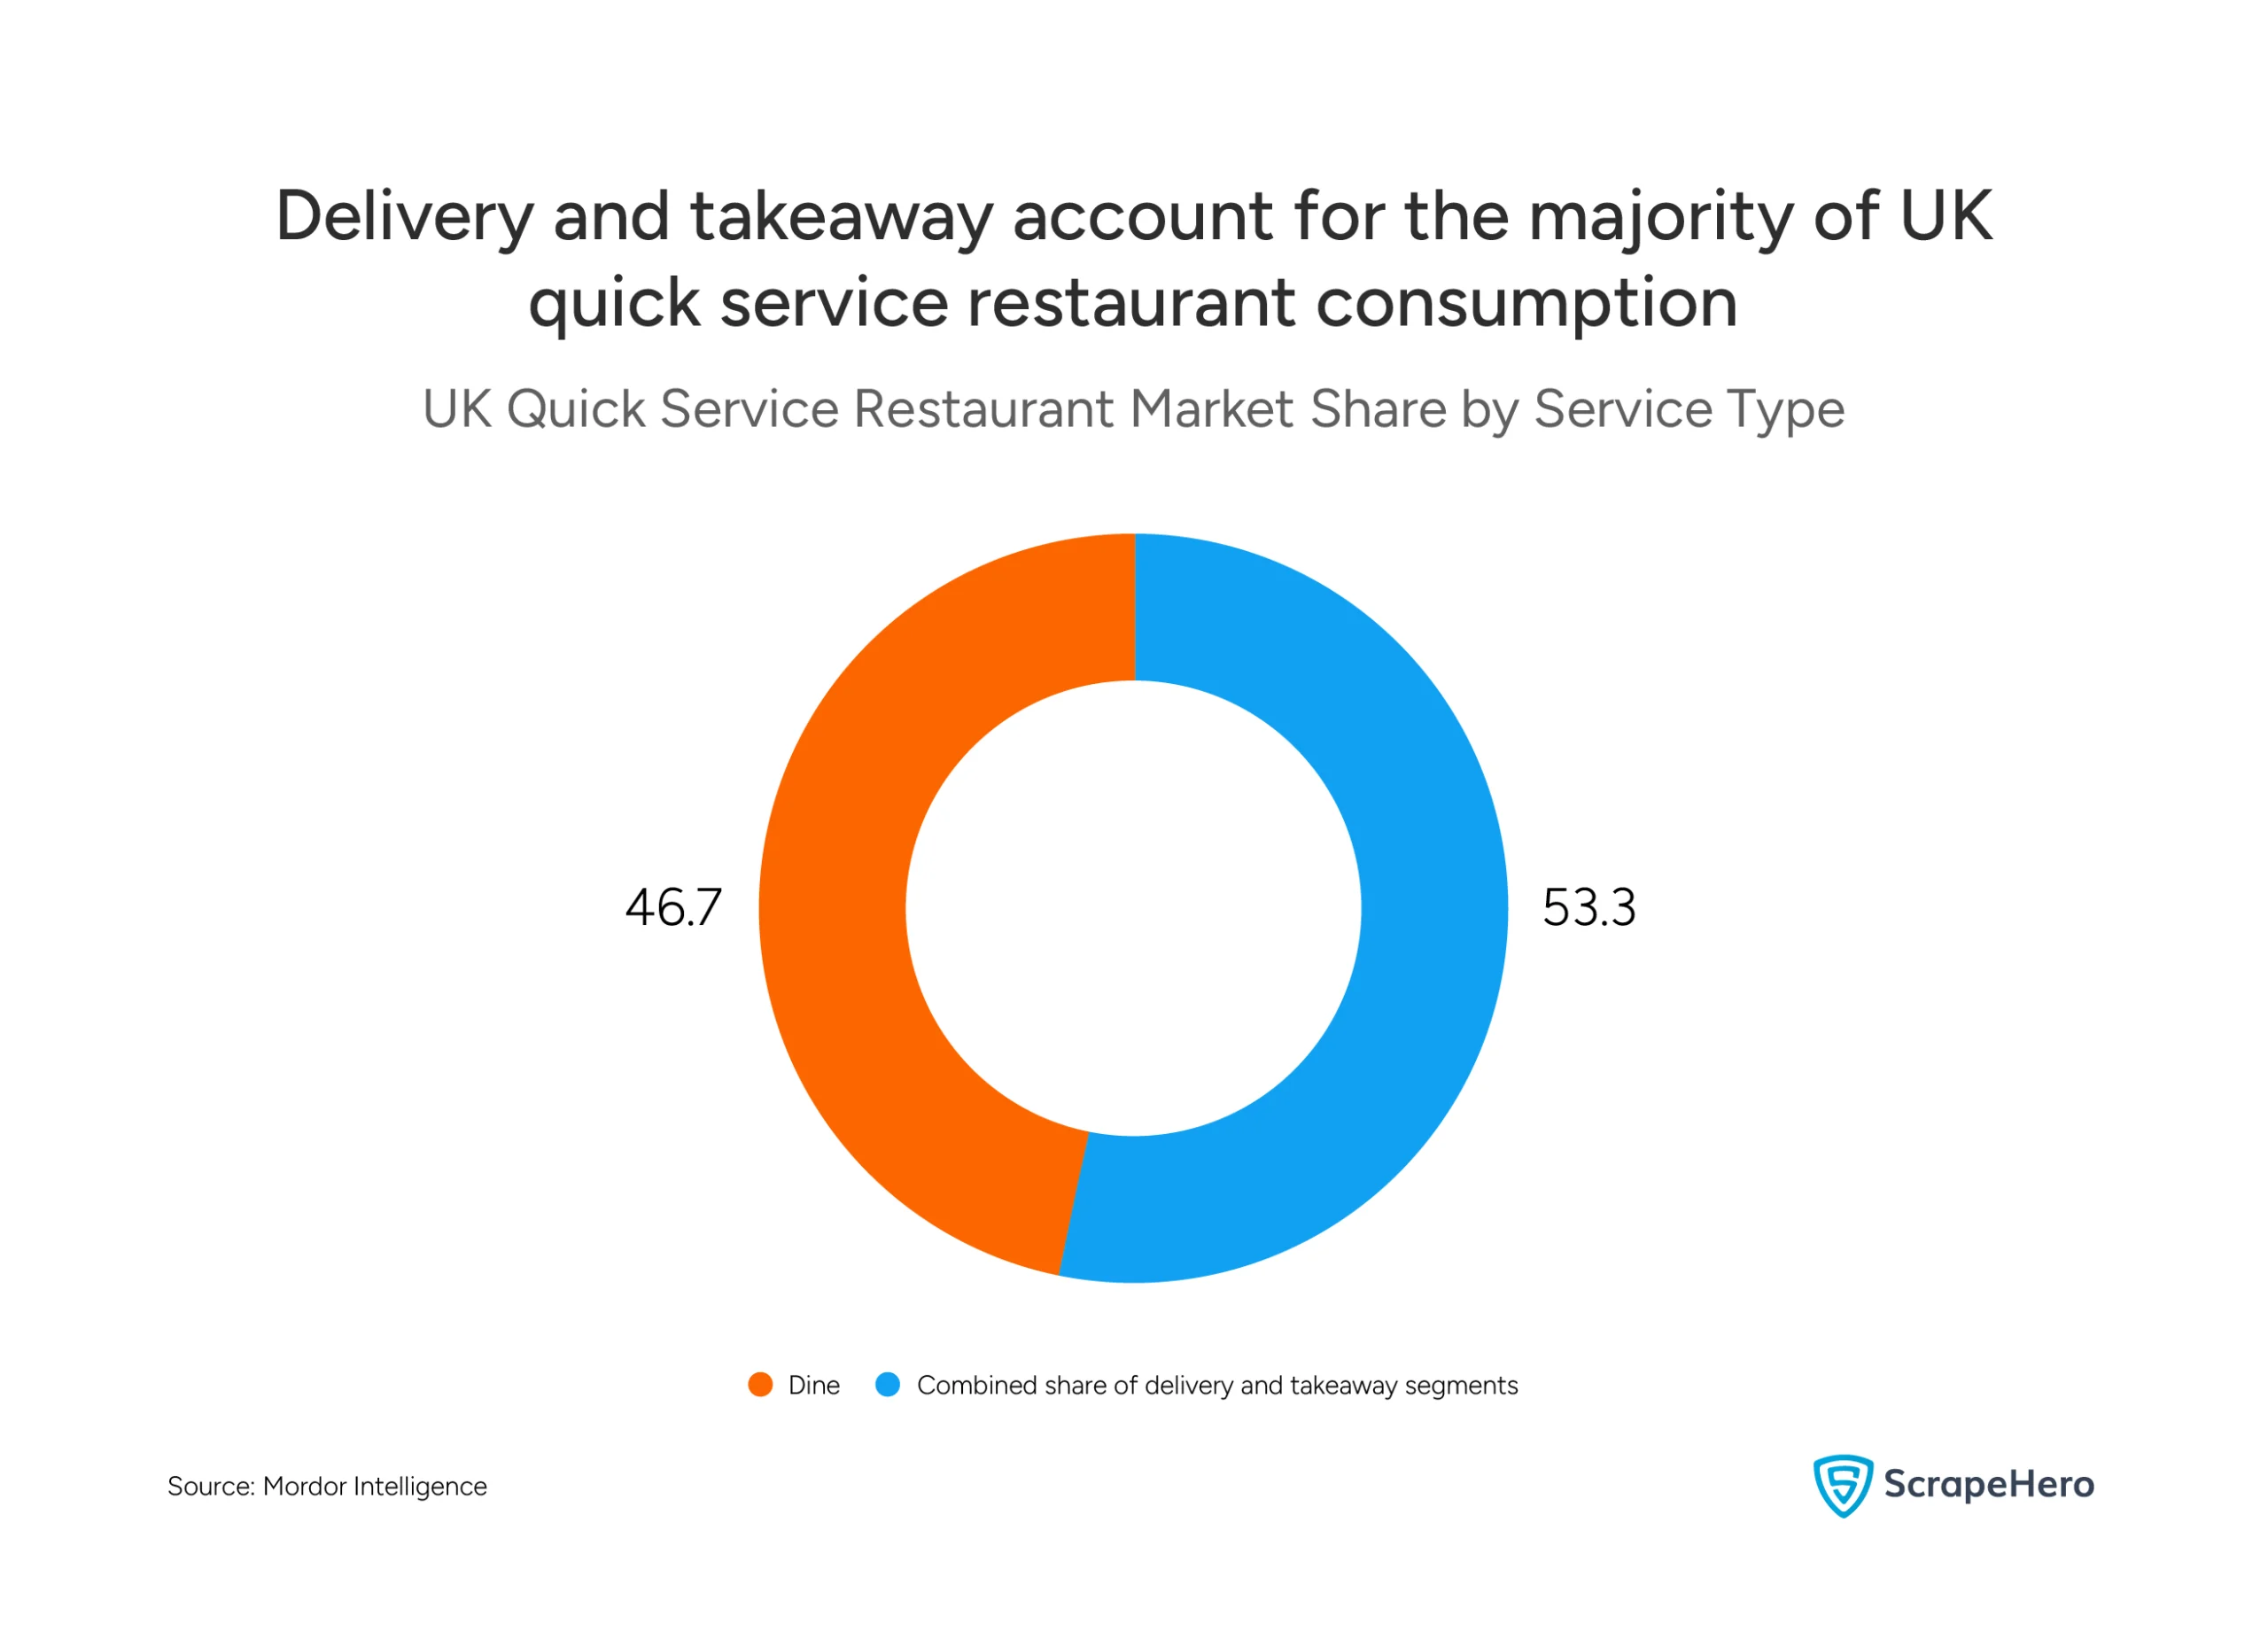
How Do Fast Food Chains in the UK Compete? The Shift to Delivery
The way Britain consumes fast food is changing. In 2025, delivery and takeaway account for 53.3% of the UK quick service restaurant market. Dine-in, at 46.7%, remains significant — but is no longer the majority consumption mode.
This shift has structural implications for how chains compete.
Chained outlets are the primary beneficiaries of this shift.
In 2026, chained outlets hold 58.8% of the UK quick service restaurant market, against 41.2% for independent outlets (Source: Mordor Intelligence). Scale, standardisation, delivery capability, and brand recognition are the drivers behind this dominance.
What this tells investors and analysts:
- The majority of UK fast food consumption now happens off-premise
- Chained outlets are better positioned to capitalise on delivery growth than independents
- Brands with the widest location footprints have a compounding advantage in delivery coverage
What New Fast Food Brands Entering the UK Market Should Know
The UK fast food market is growing. But growth is not evenly distributed, and the data makes that clear.
Here is what the numbers explicitly tell us:
- Costa Express has built an almost unassailable position. With 13,834 locations, it operates at a scale no other brand in this dataset comes close to matching. Any brand entering the coffee and express format space faces a significant incumbency disadvantage.
- Northern Ireland is the most underserved region. Across every brand analysed, Northern Ireland consistently records the lowest store counts. For brands evaluating expansion, this represents a measurable gap in coverage.
- Barking is the most underserved urban market. A large, young, and diverse population with minimal fast food presence across all major chains.
- Delivery is now the majority consumption mode. At 53.3% of the market, off-premise consumption is the new baseline. Brands without a strong delivery infrastructure are competing at a structural disadvantage.
- Scotland and Wales offer stronger per-person density returns. For brands optimising for store productivity rather than raw count, these regions show higher penetration per million people than England for most brands analysed.
- Gen Z cities are not fully captured. Birmingham, Manchester, and Nottingham show strong store counts. But several Gen Z-concentrated cities remain underpenetrated — representing demand that the current supply does not fully serve.
The insights in this report start with one thing: reliable, structured, publicly available data collected at scale.
ScrapeHero is a web scraping service you can partner with to get exactly that, without any of the technical hassle.
No infrastructure to build. No engineering team required. ScrapeHero handles the data collection so your team can focus on the analysis and decisions that matter.
Disclaimer: The data used in this report is sourced from publicly available information. This analysis has been produced independently by ScrapeHero and is not affiliated with, endorsed by, or produced in association with any of the fast food brands mentioned in this report. All brand names are the property of their respective owners.
Ready to Make Smarter Decisions in the UK Market?
FAQ
The UK fast food market was valued at $22.23 billion in 2024 and grew to $24.39 billion in 2025 — a 9.7% increase in a single year. (Source: Market Research Future)
Scotland and Wales show higher per-person fast-food penetration than England for most brands analysed. Costa Express, for example, operates 240 stores per million people in Scotland compared to 209 per million in England. Our analysis reveals that, except for a few brands, most chains show higher store density outside England than within it.
London has the highest total store count across all major brands analysed in this report. However, from a density perspective, Newcastle is known as the fast food capital of the UK, with around 27.5 restaurants per 100,000 people. (Source: Expert Market Research).
Delivery is the fastest-growing channel in the UK quick service restaurant market, with revenue expected to grow at a 6.71% CAGR through 2031. (Source: Mordor Intelligence).
The growth of brands such as Popeyes and Wingstop highlights how new concepts are still finding room to scale in the UK market, especially in the fast-food segment. Premium fast-food brands with a strong digital presence are particularly well positioned to capture younger audiences.