And according to IndexBox and Statista, the broader UK camping equipment market is valued at up to $1.3 billion at the consumer level, with online sales, led by platforms like Amazon, forecast to account for 64% of total revenue by 2029.
All Amazon product data in this report was collected using ScrapeHero Cloud Amazon Search Results Scraper— a no-code Amazon scraping platform that lets you extract product, pricing, review, seller data, etc. at scale, without writing a single line of code.
The UK camping and hiking gear market is competitive, fast-moving, and full of untapped opportunity. The data reveals exactly where the gaps — and the profits — are hiding.
Whether you’re an Amazon seller scouting your next private label product, a brand manager benchmarking competitors, or a market researcher building a category report — this breakdown is for you.
We’ve analysed 1,228 hiking and camping products across 219 subcategories on Amazon UK. Here’s what the numbers actually say.
UK Camping and Hiking Market Analytics: The Big Picture
Before diving into Amazon-level data, it helps to understand the broader market these products sit in.
The UK camping and caravanning sector saw a dip in sales in 2024, hurt by unpredictable weather and cost-of-living pressures. But the bigger trend is positive. Mintel forecasts ~9% value growth ahead, driven by premium products, wellness tourism, and growing interest in outdoor experiences — especially among younger consumers and families. (Mintel, 2025 — paid report)
Here’s how the market stacks up across key sources:
- Globally, the camping and caravanning market was valued at $38.05 billion in 2024, projected to reach $60.30 billion by 2033 (Strategic Revenue Insights).
- In the UK specifically, consumer-level camping equipment spending peaked at $1.3 billion (IndexBox).
- And by 2029, 64% of UK camping market revenue is expected to come through online channels (Statista) — making platforms like Amazon increasingly central to how this market moves.
That’s the macro picture. Now let’s look at what’s actually happening inside Amazon UK’s camping and hiking category.
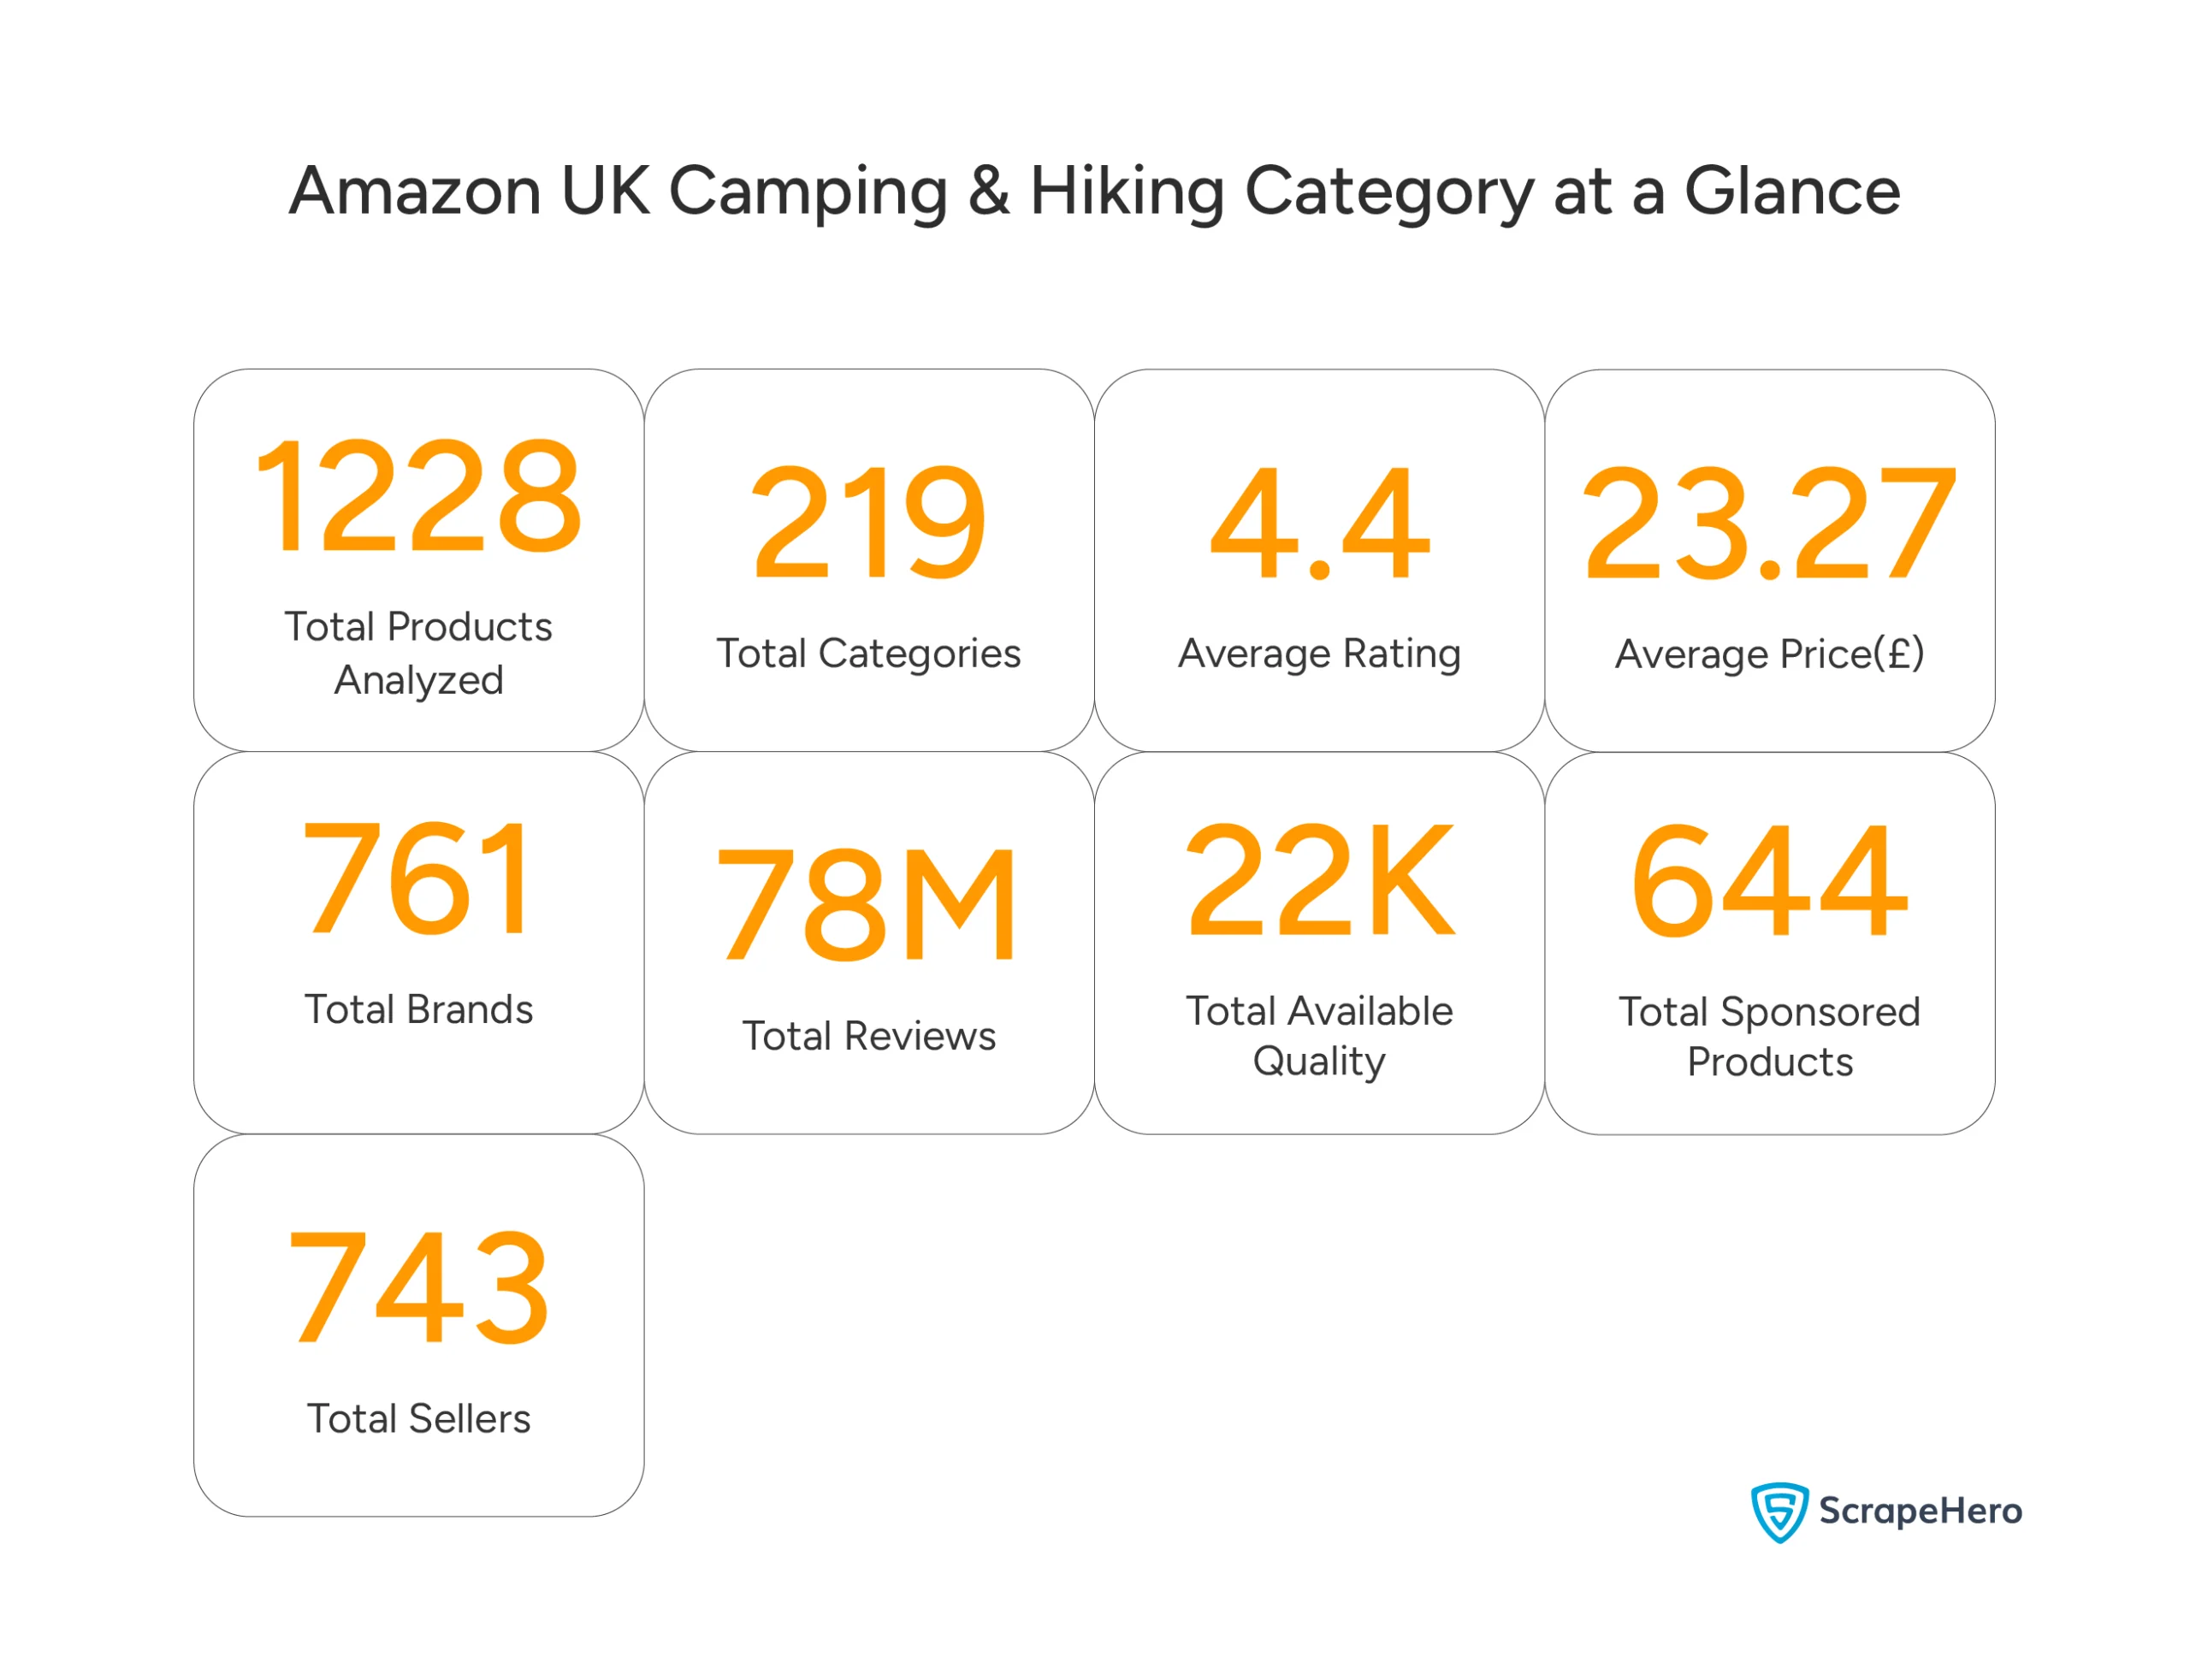
(Amazon UK Camping & Hiking Category at a Glance. 1,228 products analysed across 219 subcategories. Data collected via ScrapeHero Cloud.)
The Hiking and Camping category on Amazon spans 761 brands and 743 sellers, has accumulated 78 million reviews, and maintains an average rating of 4.4 out of 5 — signaling a mature but highly active marketplace.
What Are the Top-Selling Camping Products on Amazon UK in 2026?
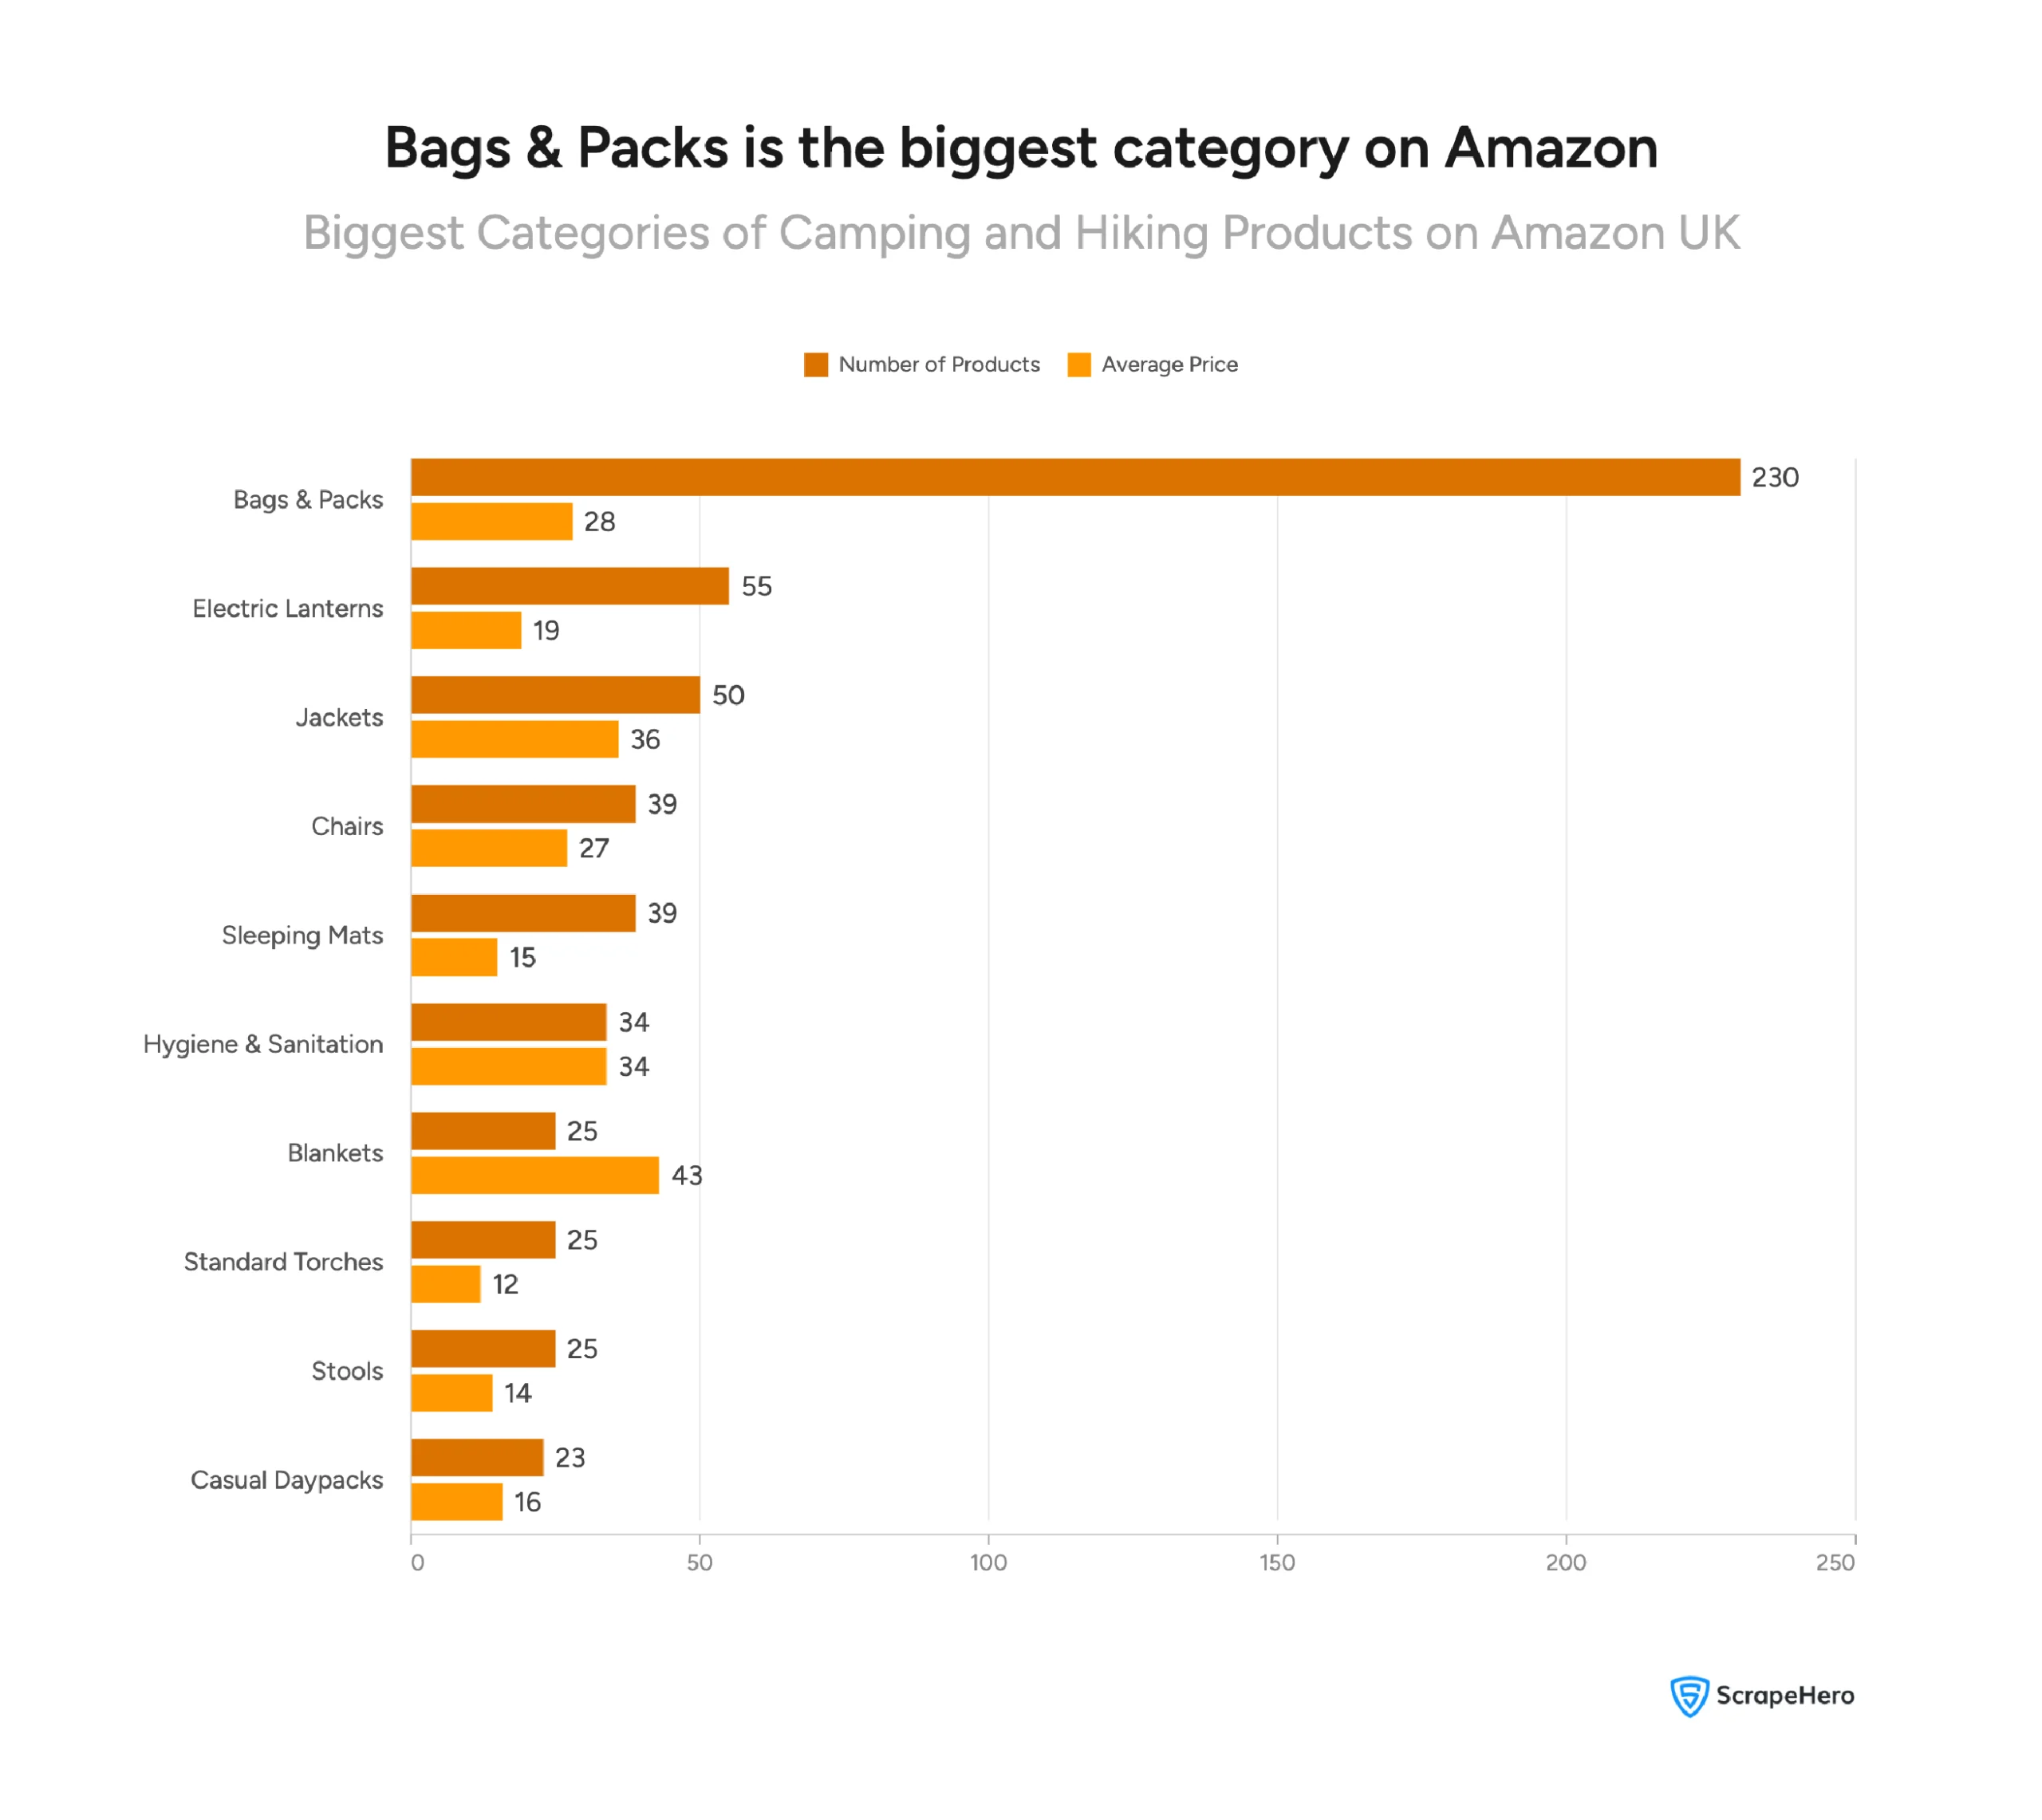
Bags & Packs lead the category by a significant margin — with 230 products listed, nearly double the next subcategory. Electric Lanterns (55 products) and Jackets (50 products) round out the top three.
Here’s a quick look at the top subcategories by product count:
- 🎒 Bags & Packs — 230 products, avg price £28
- 🔦 Electric Lanterns — 55 products, avg price £19
- 🧥 Jackets — 50 products, avg price £36
- 🪑 Chairs — 39 products, avg price £27
- 🛏️ Sleeping Mats — 39 products, avg price £15
- 🧴 Hygiene & Sanitation — 34 products, avg price £34
But product count alone doesn’t tell the full story.
Our Hiking and Camping gear UK 2026 analysis shows that Standard Torches have just 25 distinct listings on Amazon UK — but they’ve accumulated 5 million reviews at an average rating of 4.6. That’s an extraordinary sales volume relative to SKU count. A small, high-satisfaction niche that’s arguably underserved by sellers.
Another important pricing context, according to the analysis: 1,085 of 1,228 products — that’s 88% of the category — are priced under £50. This is an overwhelmingly affordable-to-mid-range market. Premium products exist, but they’re the exception, not the rule.
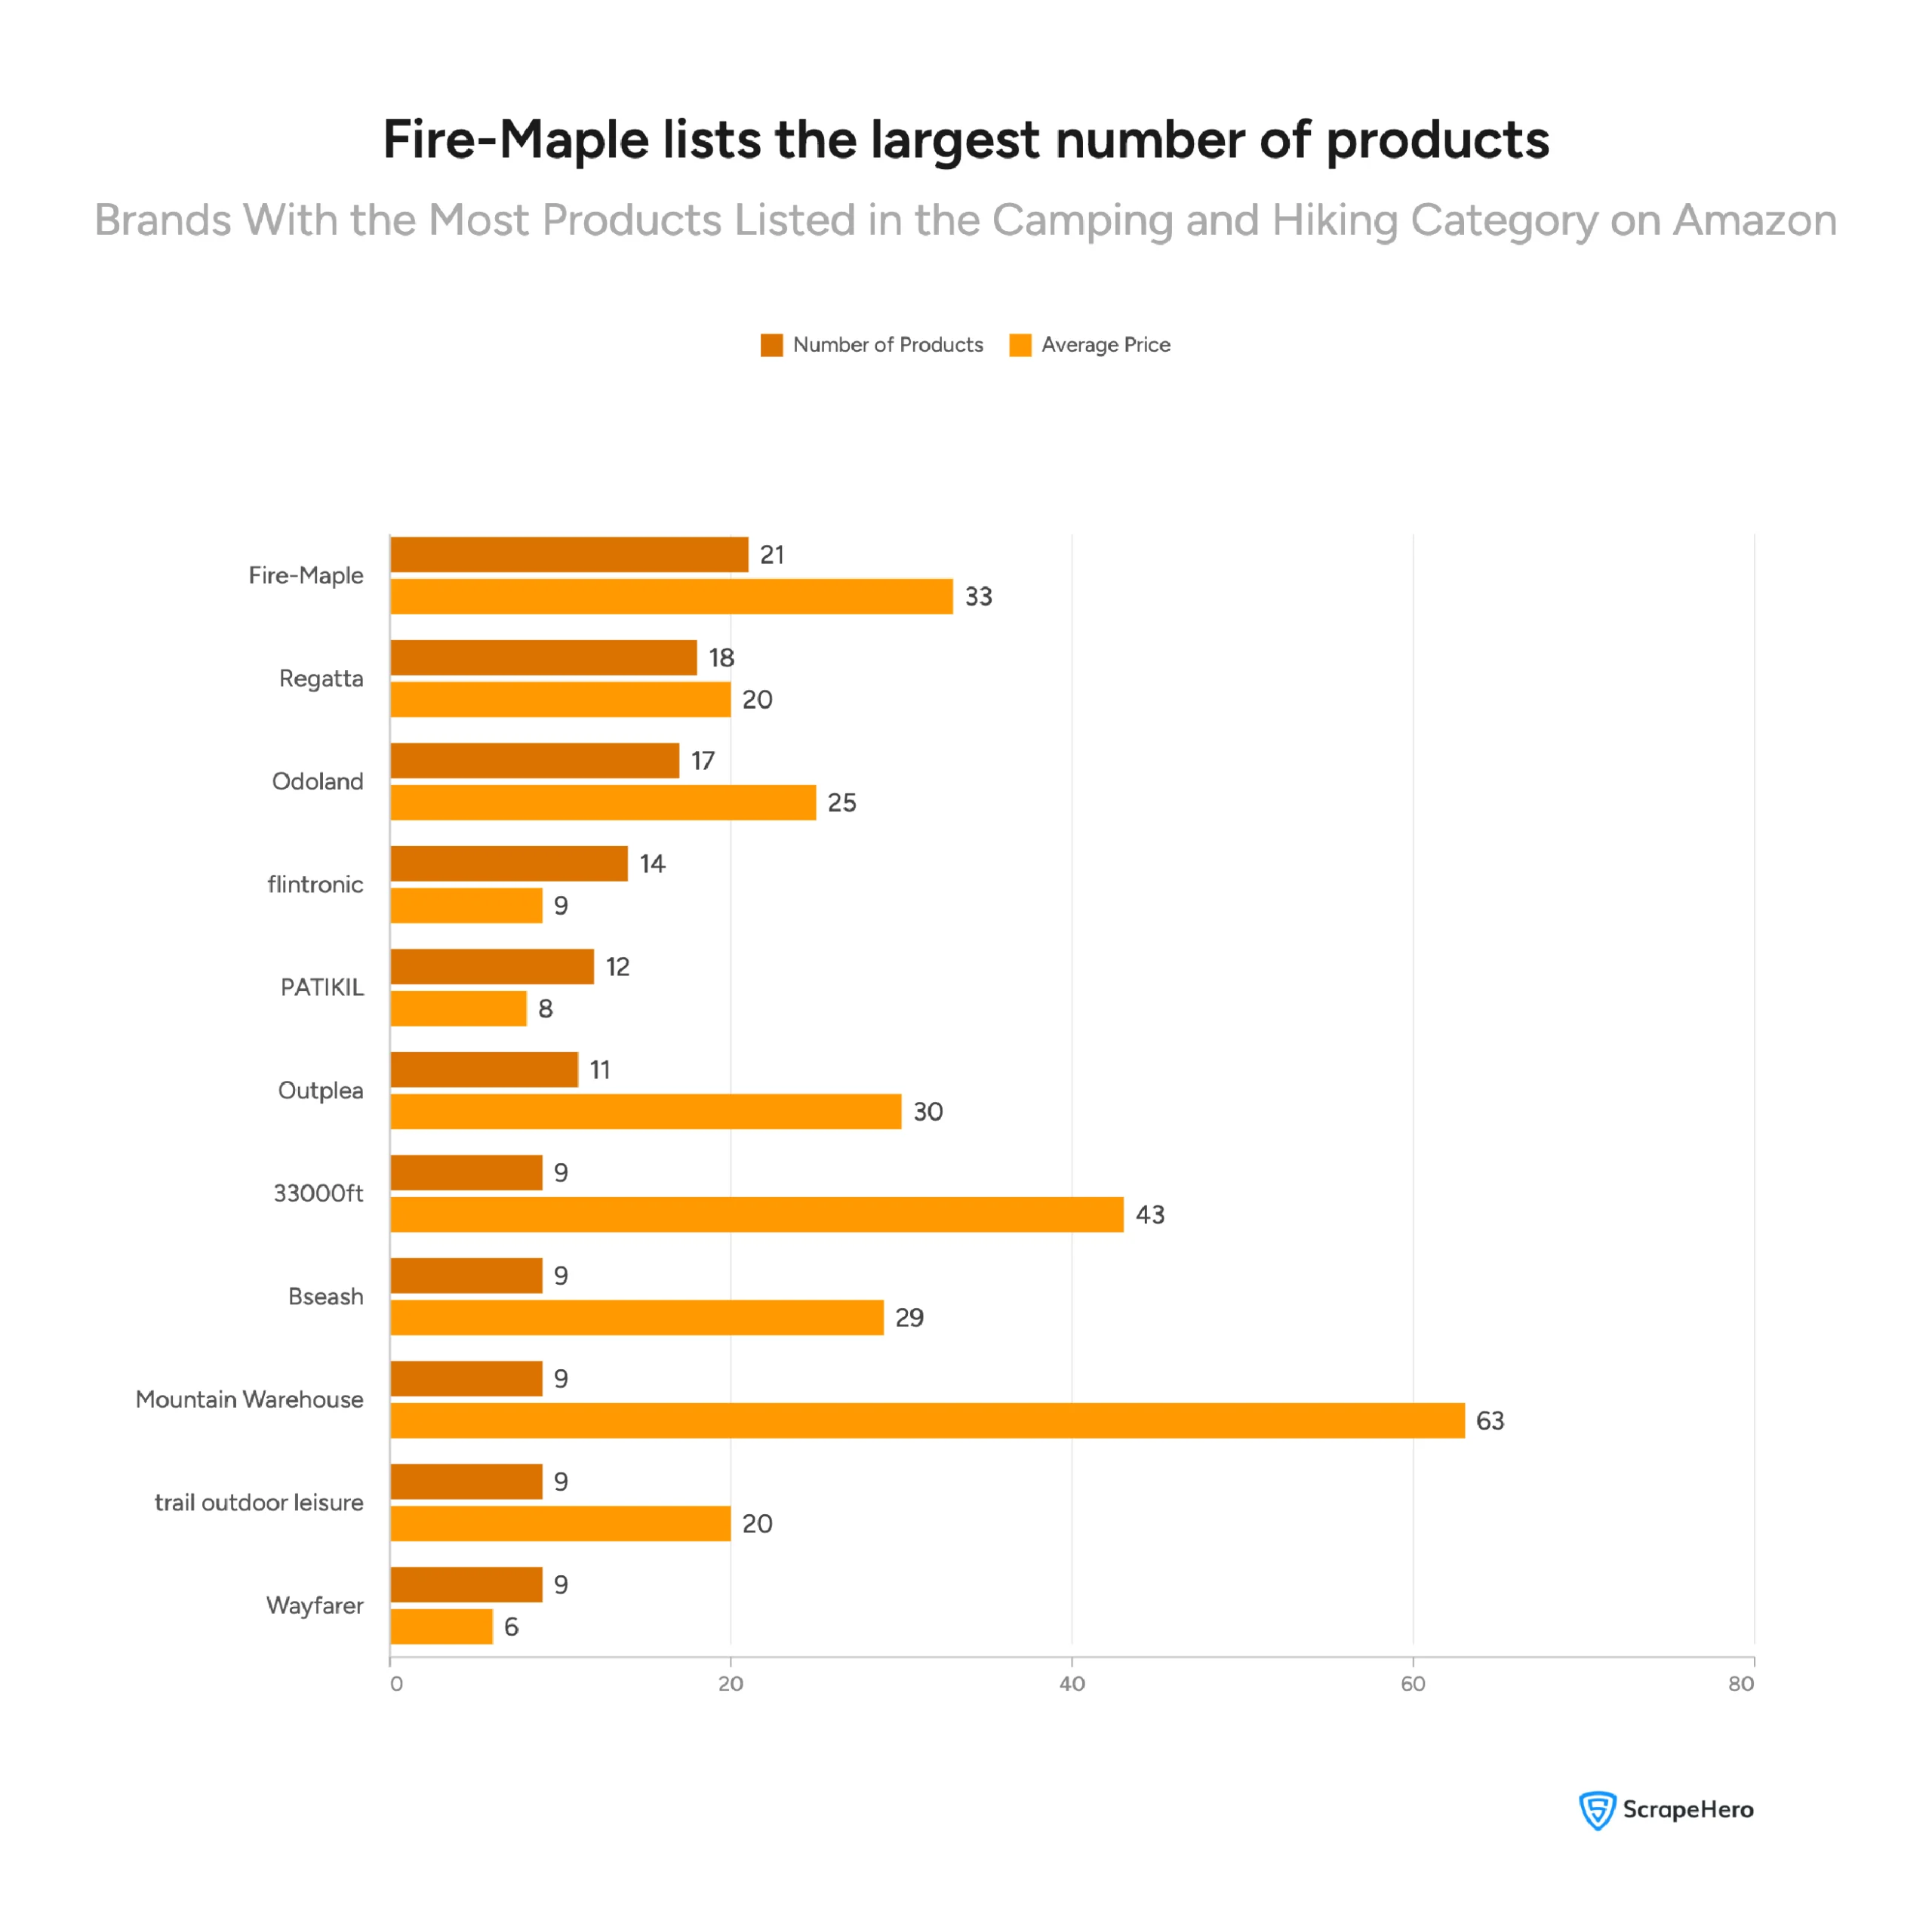
The average price across all 1,228 products is £23.27 — confirming this is largely a budget-to-mid range category. But the price range itself is surprisingly wide, stretching from under £5 all the way to £529. At the affordable end, everything is under £5. Think keychains, neck warmers, drawstring storage bags, first aid kits, and paper soaps. These are low-ticket, high-volume products. The expensive end — £180 to £529 — is a different world entirely. The most expensive product in the category is the TRELINO Evo L Composting Toilet at £529, followed by the Berghaus Adhara 700 7-Man Tent at £399 and the EcoFlow RIVER 2 MAX Portable Power Station at £299. Premium products in this category mainly fall into four types: Here’s something useful for sellers and brand managers. The £50–£100 band contains 113 products with an average rating of 4.5 — on par with several higher price bands, but with significantly more products and competition. The category has 761 brands competing across 743 sellers — a moderately fragmented marketplace with no single dominant force. But look closer, and clear patterns emerge. Fire-Maple leads by product count with 21 products, followed by Regatta (18 products) and Odoland (17 products). But volume alone isn’t the full picture. Fire-Maple stands out as the most strategically sophisticated brand in the category. It appears across three key dimensions simultaneously: Top sellers — Fire Maple Official Store lists 21 products with a 4.5 avg rating
Fire-Maple appears in the top brands by volume, top sponsored brands by count, and top sellers list — a rare triple presence that signals a deliberate, integrated Amazon strategy combining organic range-building with paid visibility. At the expensive end of the brand spectrum, Mountain Warehouse leads with an average price of £63, followed by 33,000ft at £43. At the individual product level, LE Camping Lanterns dominate — holding the top two spots with 6.6 million and 6.4 million reviews, respectively, both rated 4.6. The Blukar LED Torch follows closely with 4.5 million reviews at a 4.6 rating. A few things stand out across the top reviewed products: 💡 What This Means for Sellers: A high review count with a high rating is the hardest combination to compete against on Amazon. These products have effectively built a moat. New entrants should look for adjacent niches — similar use cases, lower review counts, and ratings above 4.4.
Precise sales velocity data at the Amazon category level isn’t publicly available. But review count and rating stability are reliable demand proxies — and the numbers here tell a clear story. Electric Lanterns lead the entire category with 20 million cumulative reviews and an average rating of 4.5. Bags & Packs rank second with 15 million reviews — but carry a slightly lower average rating of 4.3. As noted earlier, Standard Torches have just 25 distinct listings but have accumulated 5 million reviews at an average rating of 4.6. That’s the highest review-to-SKU ratio in the category — a strong signal of high sell-through and under-representation by sellers. First Aid Kits carry the highest average rating in the category at 4.7, with 2 million reviews. Hygiene & Sanitation appears in both the top categories by product count and as the most expensive sponsored category, with an average sponsored price of £143. That combination — solid organic presence plus premium ad spend — points to a category where brands are willing to pay to win.
When Amazon doesn’t publish category-level revenue, which it never does, review count growth, rating stability, and sponsored investment levels together act as a reliable demand signal. This is exactly the kind of multi-variable insight that structured Amazon data unlocks. And it’s precisely why the right data partner makes all the difference. With 743 sellers competing across 1,228 products, this is a busy marketplace. But the seller distribution is far from even. Amazon itself leads with 69 products listed, by a significant margin. Amazon US follows with 25 products, and Fire Maple Official Store comes in third with 21 products at a 4.5 average rating. All top sellers maintain an average rating of 4.3 or above. Very. 644 out of 1,228 products are sponsored — that’s over 52% of the entire category. Here’s how the top sponsored categories break down:
The insights in this report, pricing gaps, review velocity signals, sponsored blind spots, brand positioning, stock patterns all came from structured, product-level Amazon data. And they’re just the surface. A few things this analysis made possible: All the data in this report is publicly available on Amazon. Anyone can open a browser and look at product listings. But there’s a significant difference between browsing Amazon and understanding it. Manually checking 1,228 products across 219 subcategories — recording prices, review counts, ratings, sponsored status, brand names, and stock levels — would take weeks. And by the time you’re done, the data is already outdated. What structured Amazon scraping gives you is: The difference isn’t access to data. It’s the speed, scale, and regularity at which you can collect, structure, and act on it. That’s what separates reactive sellers from strategic ones. One small but telling detail from the data: most products in this category show an availability of just 15 units. Brands like ECOFLOW, MARCHWAY, and SELORSS maintain exactly 15 units of available stock, suggesting tight inventory management. For sellers, this means stockouts are a real risk, and monitoring competitor inventory levels regularly is a smarter strategy than most realise. Here’s what the data tells us, clearly and directly: Disclaimer: The data used in this report is sourced from publicly available information. This analysis has been produced independently by ScrapeHero and is not affiliated with, endorsed by, or produced in association with any of the camping and hiking gear brands mentioned in this report. All brand names are the property of their respective owners. The analysis in this report is a snapshot — one week of data across 1,228 products. Useful, yes. But the real competitive edge comes from tracking this data continuously, not just reading about it once. ScrapeHero is the data infrastructure behind reports like this one, built to collect, structure, and deliver structured web data at scale, so you can focus on making decisions rather than gathering numbers. ScrapeHero is a fully managed, enterprise-grade web scraping service trusted by Fortune 50 companies and 14,700+ businesses globally, and featured in Bloomberg, Forbes, and TechCrunch. ScrapeHero doesn’t just scrape data — every dataset goes through both automated and manual QA, so what your team receives is clean, structured, validated, and ready to use from day one. You tell us what data you need. Our experts, with decades of industry experience, handle everything else. Whatever your industry, whatever your data needs, ScrapeHero delivers clean, structured web data on demand, at scale, without the technical overhead. Camping equipment on Amazon UK spans a wide price range. The average price across 1,228 products analysed is £23.27, with the majority of products — 88% — priced under £50. The UK camping and caravanning sector dipped in 2024 due to poor weather and cost-of-living pressures, but the outlook is positive. Mintel forecasts ~9% value growth ahead, driven by premium offerings, wellness tourism, and growing interest in nature-based experiences — particularly among younger consumers and families. Online sales are expected to account for 64% of UK camping market revenue by 2029 (Statista). Fire-Maple is the most strategically dominant brand in the category — leading by product count, sponsored presence, and seller activity simultaneously. Regatta and Odoland follow by product count. At the premium end, Mountain Warehouse commands the highest average price at £63, followed by 33,000ft at £43. The most reviewed camping products on Amazon UK are LE Camping Lanterns, with over 6.6 million reviews and a 4.6 rating. Blukar LED Torches and TheFitLife Hiking Trekking Poles also rank among the top reviewed products. For overall category performance, Bags & Packs, Electric Lanterns, and Jackets are the top selling subcategories. The UK camping equipment market reached $1.3 billion at consumer level (IndexBox). The broader UK Sports Equipment and Outdoor Gear market is valued at approximately £11.3 billion (Research and Markets), with the Sporting and Outdoor Equipment Retailers industry forecast to reach £13.4 billion by 2025–26 (IBISWorld).
Hiking and Camping Gear UK 2026: How Is the Market Priced?
What Does Budget Look Like?
What Does Premium Look Like?
The Sweet Spot: £50–£100
Which Brands Dominate the Amazon UK Camping Category?
The Volume Leaders
The Brands Playing the Long Game
The Premium End
What Are the Top-Selling Camping and Hiking Products by Reviews?
Which Hiking Gear Categories Are Growing Fastest in the UK?
Electric Lanterns: The Volume King
Bags & Packs: Popular but Competitive
Standard Torches: Small Catalogue, Massive Demand
First Aid Kits: The Trust Leader
Hygiene & Sanitation: The Premium Signal
The Seller & Sponsorship Landscape; Where the Competition Really Stands
Who’s Actually Selling?
How Competitive Is the Ad Landscape?
What Data Do You Actually Need to Win in This Category?
What the Data Revealed
The Difference Between Browsing Amazon and Understanding It
Most Camping and Hiking Products Carry Tight Stock
Hiking and Camping Gear UK 2026 — Key Takeaways for Sellers, Brands & Researchers
Why Partner With ScrapeHero?
Ready to Get the Data That Drives Real Decisions?
FAQ About Hiking and Camping Gear UK 2026
Budget products like keychains and neck warmers start as low as £3–£5, while premium items like large tents, portable power stations, and composting toilets can reach up to £529.