About the Report: This analysis compares Five Guys and Shake Shack across US location data, revenue figures, web traffic insights, delivery coverage, and meal pricing- based on publicly available data.
Want to easily download accurate, updated, affordable, and ready to use the POI data of a retail brand?
Introduction
Two Brands, One Burger, Two Very Different Footprints
Five Guys and Shake Shack are both premium burger chains with significant US presence — but the scale difference between them is stark. Five Guys has 1,508 US locations. Shake Shack has 371.
Here’s the snapshot:
- Five Guys: 1,508 locations, 50 states, 1,085 cities
- Shake Shack: 371 locations, 34 states, 244 cities
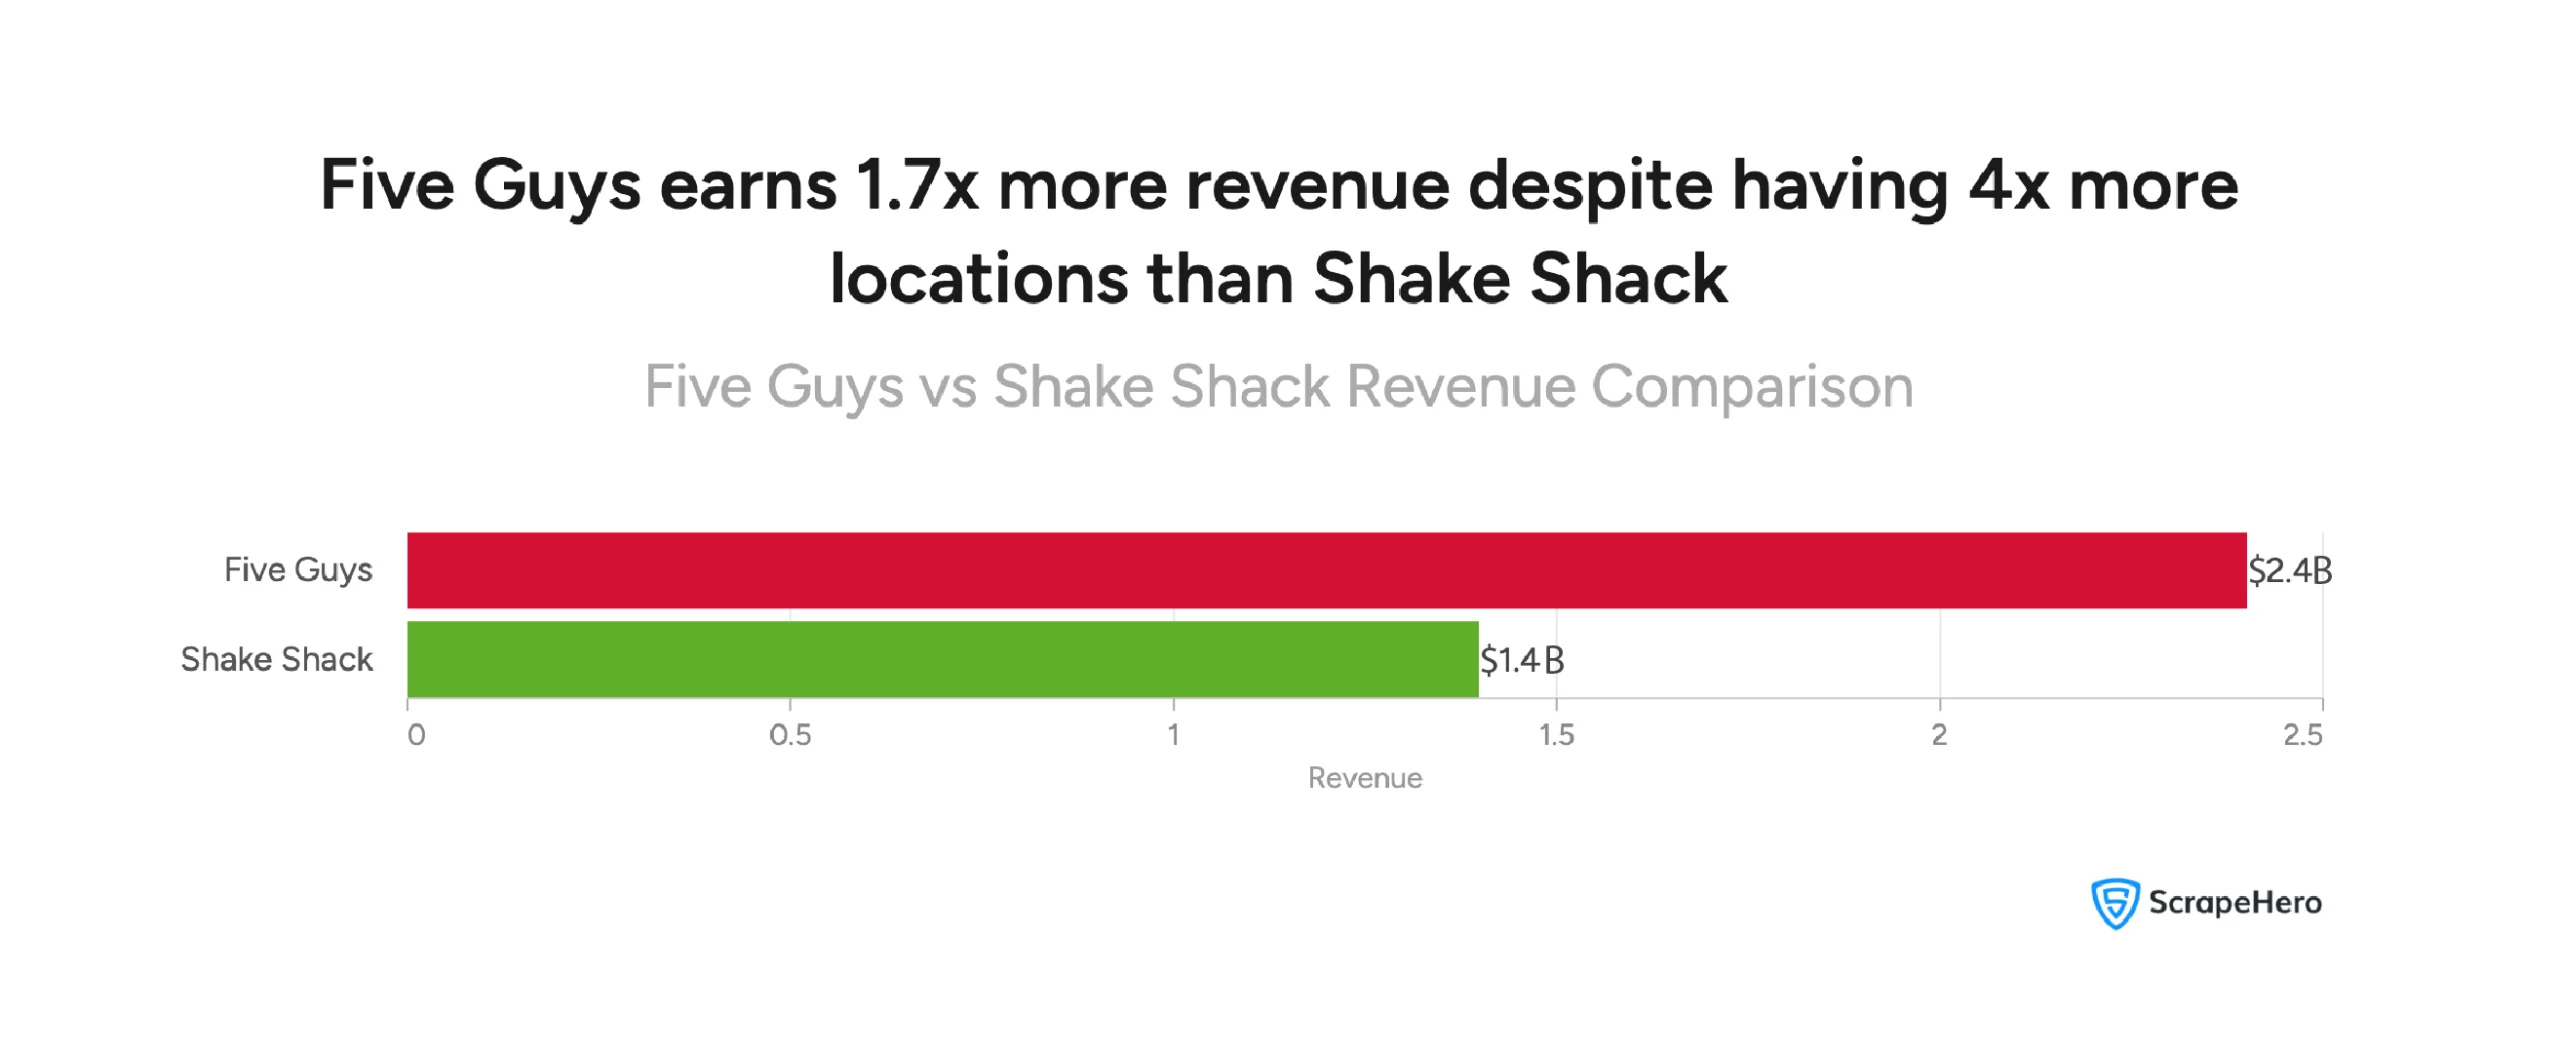
- Revenue: $2.4B (Five Guys) vs $1.4B (Shake Shack)
The numbers raise an immediate question. Five Guys has over 4x more locations — but only 1.7x more revenue. Shake Shack generates significantly more revenue per location.
So who is actually winning? Let’s look at the data.
The Scale Gap Nobody Talks About: Shake Shack vs Five Guys
The most immediate way to understand this competition is to look at it geographically. The map below says more than any single statistic can.
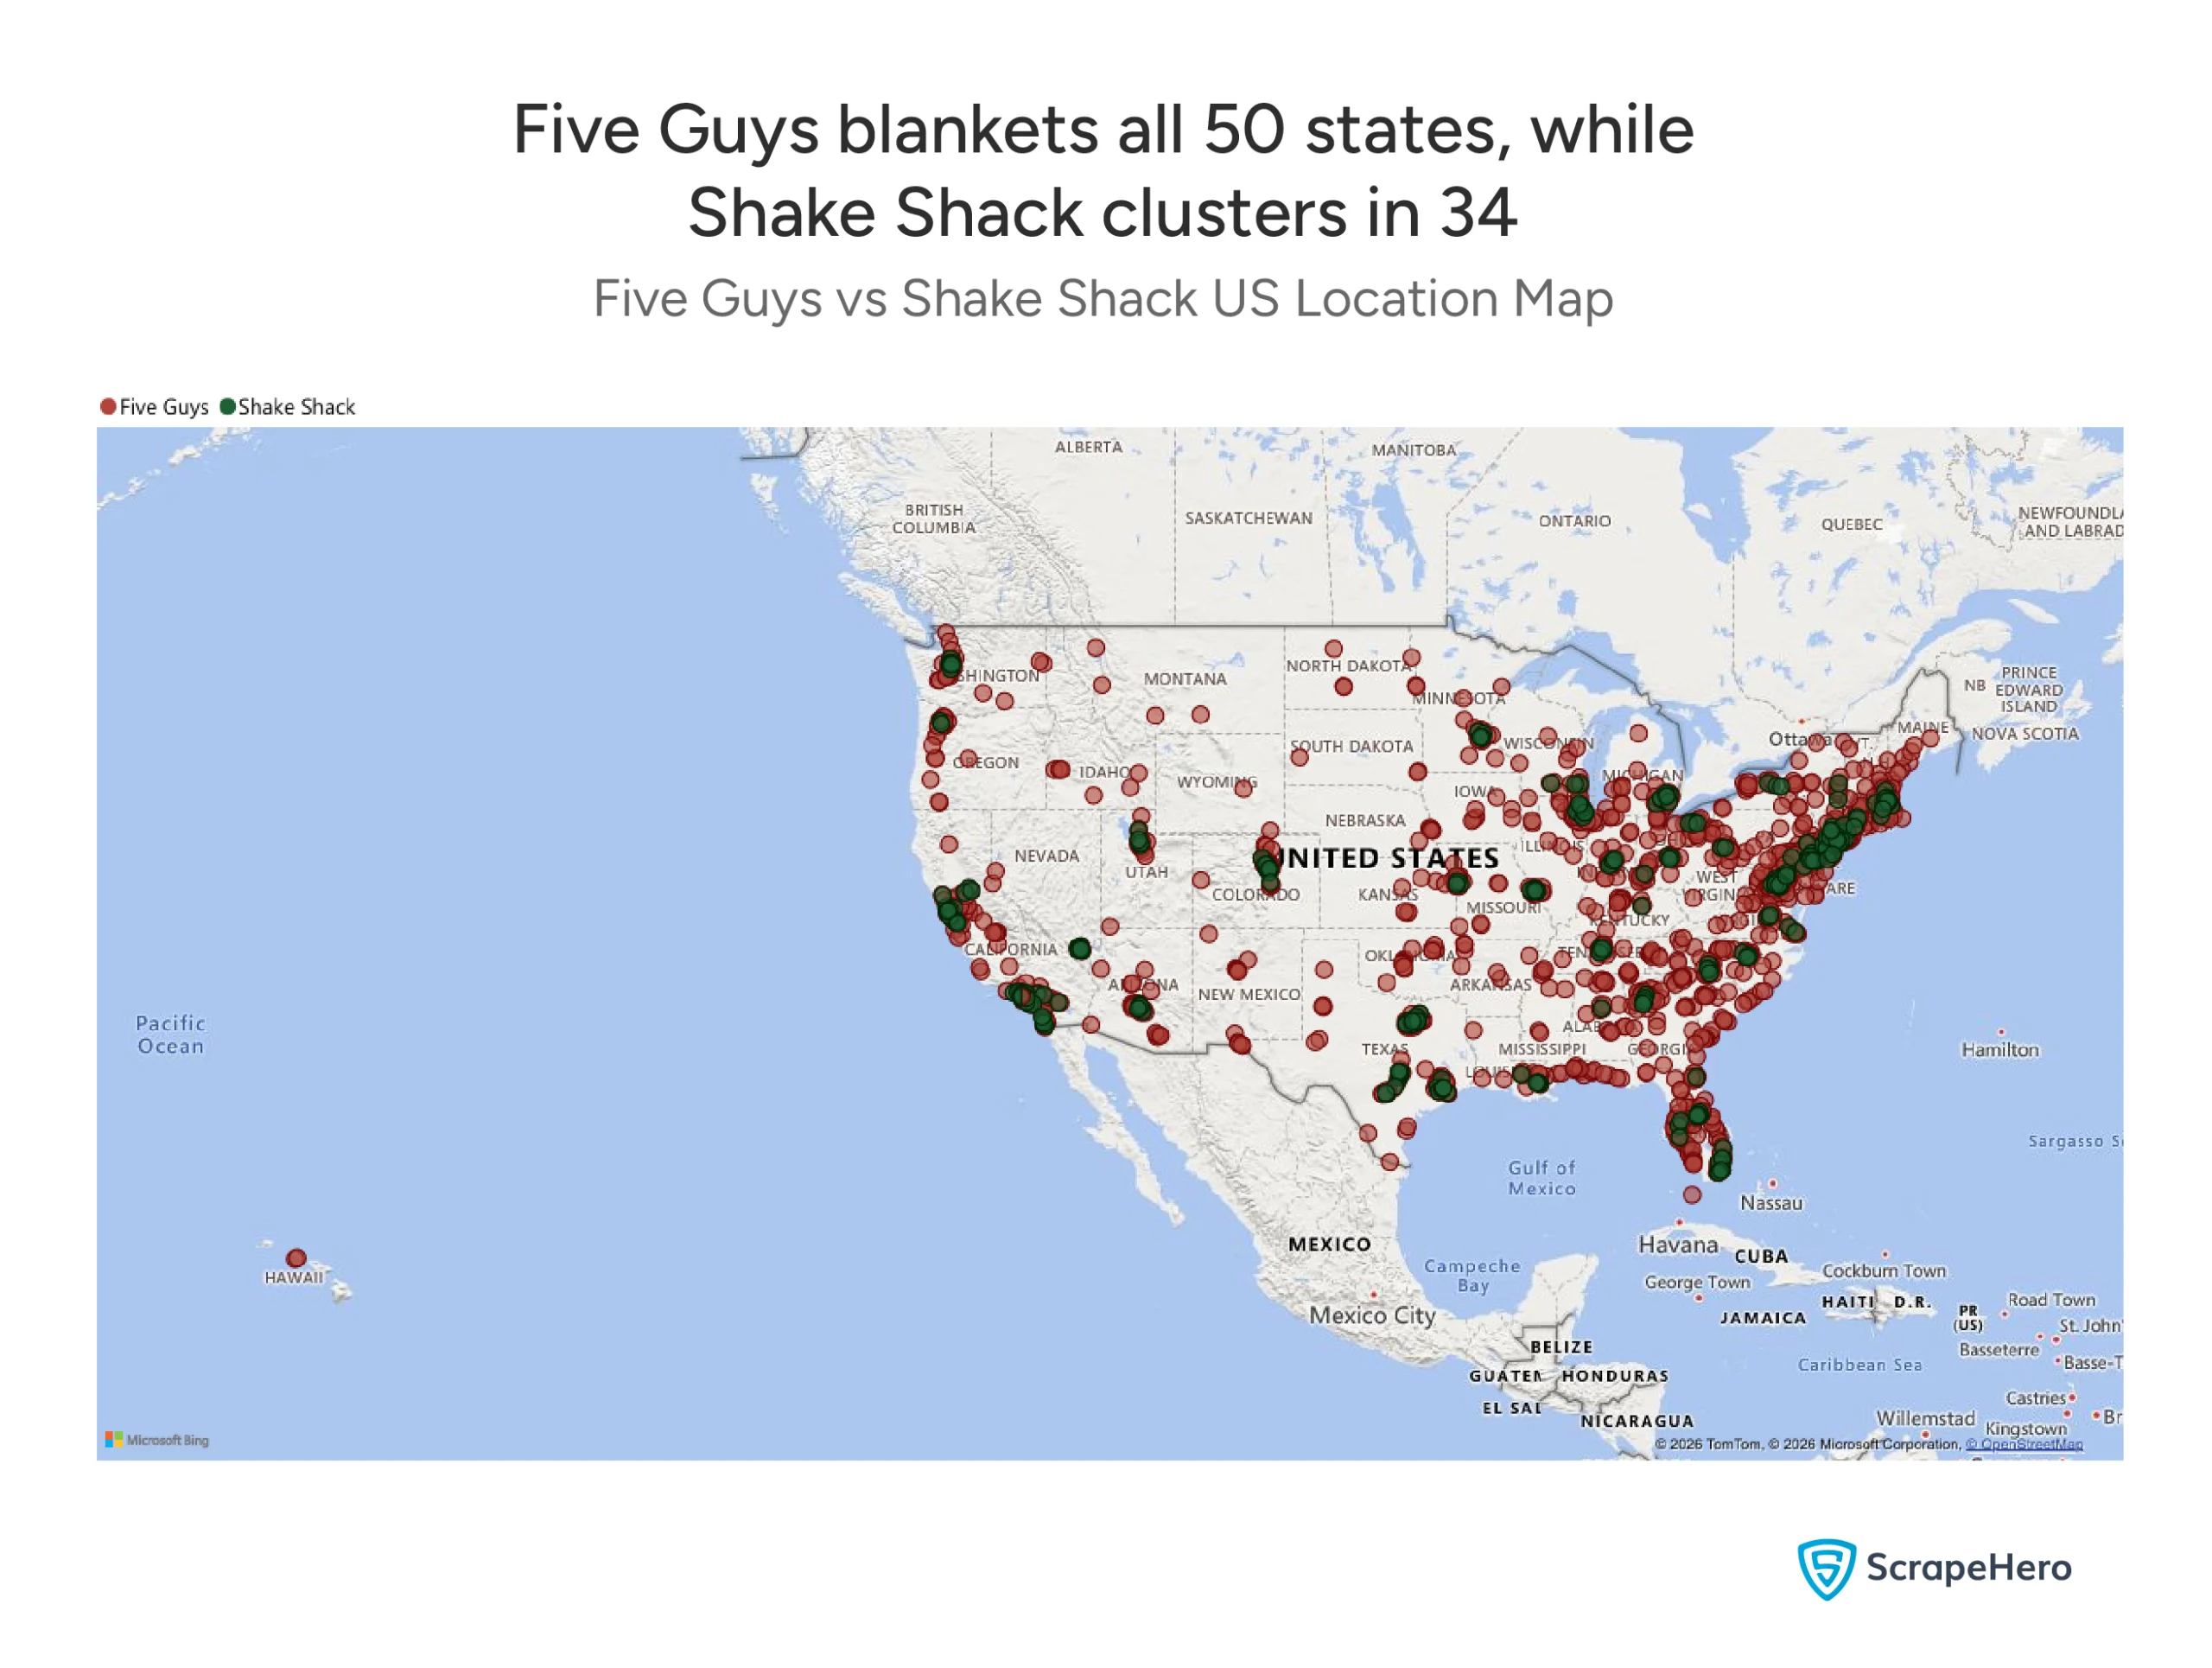
Five Guys operates in all 50 states. Shake Shack is present in 34 states. That’s a 16-state gap, meaning there are entire regions of the US where Shake Shack simply does not exist.
The city-level data makes the gap even clearer:
| Five Guys | Shake Shack | |
|---|---|---|
| Total US Locations | 1,508 | 371 |
| States Present | 50 | 34 |
| Cities Present | 1,085 | 244 |
Want to run your own analysis? Download the location datasets used in this report directly from the ScrapeHero Data Store:
- Explore Shake Shack’s US locations
- Explore Five Guys’ US locations
Where Does Each Brand Concentrate?
Five Guys’ top states:
- Florida — 127 locations
- California — 119 locations
- New York — 92 locations
- Virginia — 79 locations
- Texas — 78 locations
Shake Shack’s top states:
- New York — 56 locations
- California — 49 locations
- Texas — 28 locations
- New Jersey — 26 locations
- Florida — 24 locations
What the Location Gap Actually Means
The map shows where each brand exists. The chart below shows the actual size of the gap.
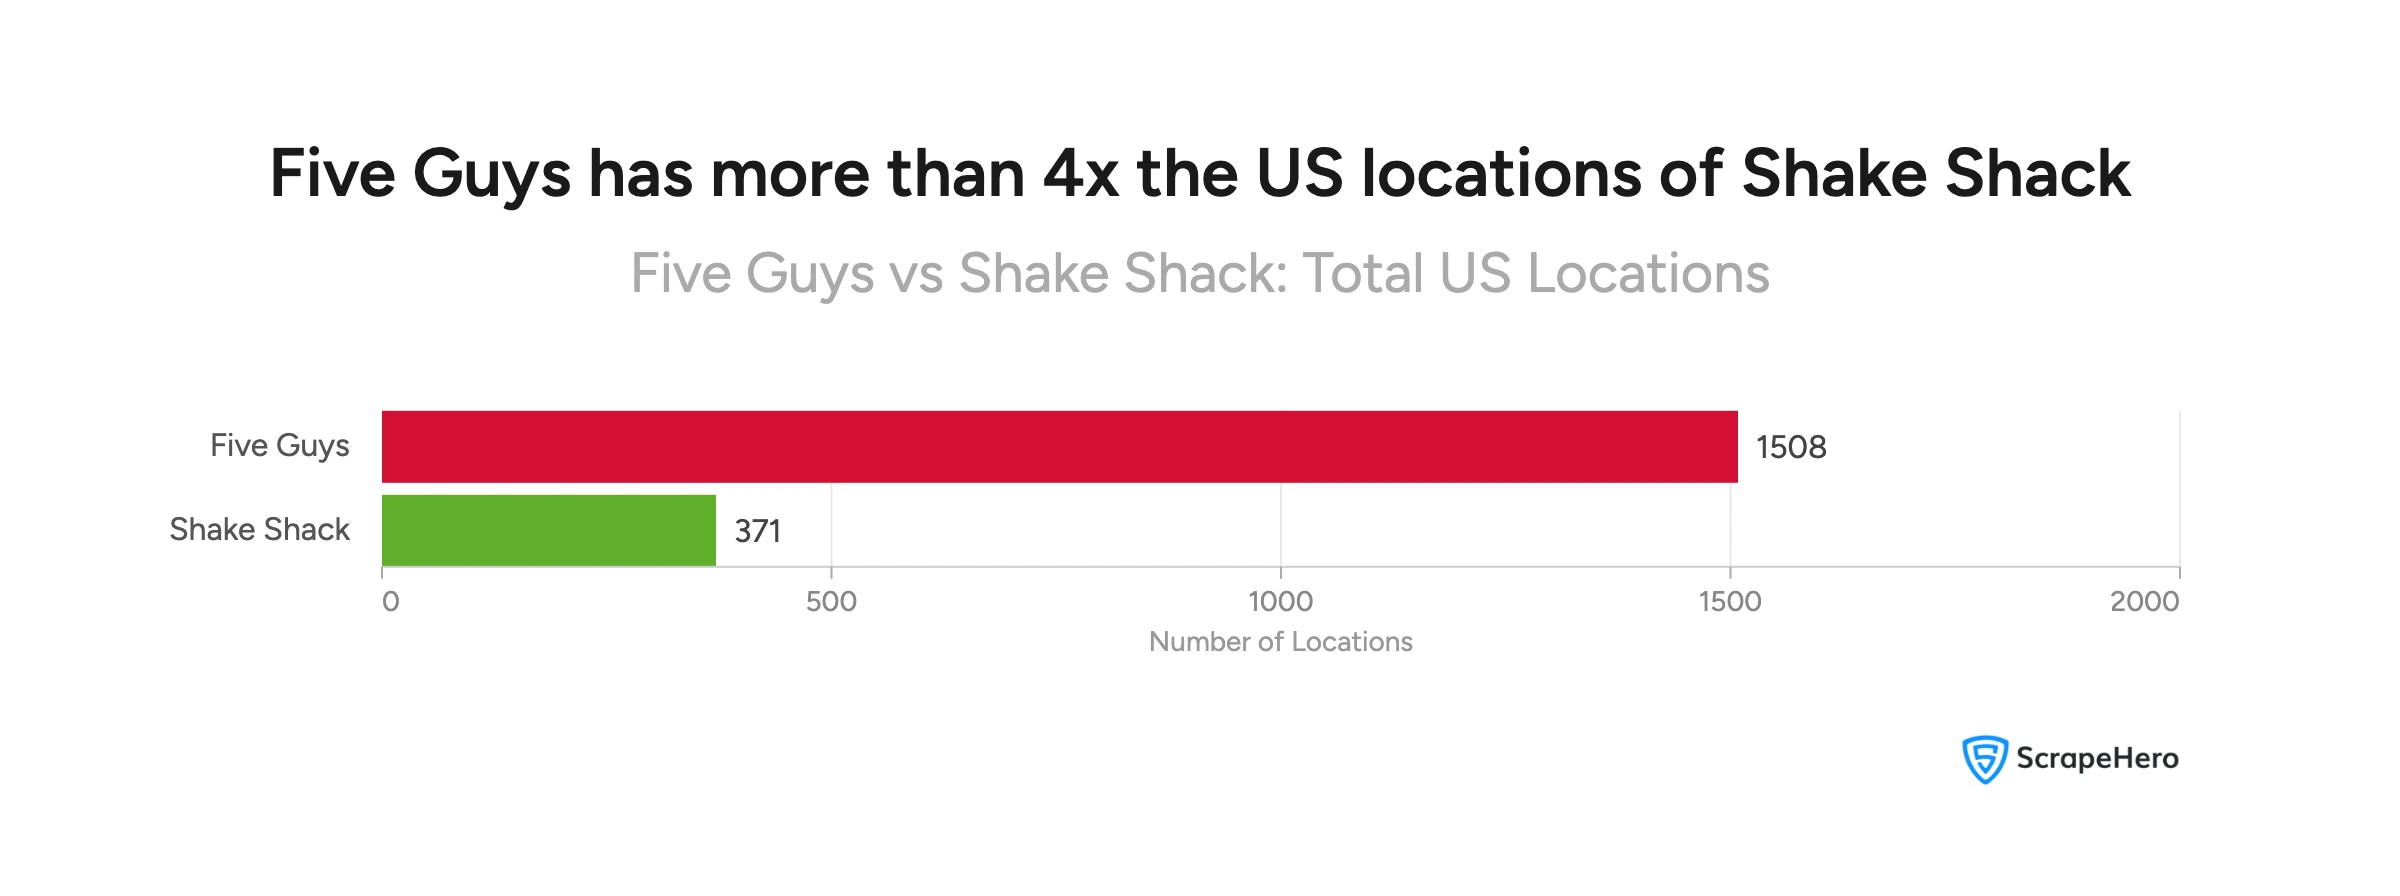
At the city level, the gap is equally significant:
- Five Guys is present in 1,085 cities
- Shake Shack is present in 244 cities
- That’s a 4.4x difference in city coverage
Top cities for each brand:
| Five Guys | Locations | Shake Shack | Locations |
|---|---|---|---|
| New York | 14 | New York | 23 |
| Columbus | 10 | Atlanta | 7 |
| Orlando | 10 | Los Angeles | 7 |
| – | – | Washington | 7 |
One data point stands out. Shake Shack has more locations in New York City than Five Guys does: 23 vs 14. It is the only city in the data where Shake Shack outnumbers Five Guys.
Outside of New York, Five Guys leads in every city and every state.
Does More Always Mean More Money?
More locations should mean more revenue. And it does — but not at the rate you might expect.
Here’s what the numbers directly show:
| Five Guys | Shake Shack | |
|---|---|---|
| Total US Locations | 1,508 | 371 |
| Revenue | $2.4B | $1.4B |
| Revenue Per Location | ~$1.6M | ~$3.8M |
The location gap between the two brands is 4x. The revenue gap is only 1.7x.
That means Shake Shack generates approximately 2.4x more revenue per location than Five Guys.
This is the most significant finding in the data. Four times the locations. Less than twice the revenue. The data does not explain why, but it does make the gap impossible to ignore.
Is Shake Shack cheaper than Five Guys?
Location count and revenue tell the business story. Meal pricing tells the consumer story.
Here’s how the two brands compare on price:
| Five Guys | Shake Shack | |
|---|---|---|
| Meal | Cheeseburger Meal | ShackBurger Combo |
| Price Range | $15-$17 | $13-$15 |
| Includes | Burger, fries, drink | Burger, fries, drink |
The meals are comparable in content. Five Guys charges $2–$4 more for an equivalent combo.
Key takeaways directly from the data:
- Five Guys is the more expensive option at $15–$17 per meal
- Shake Shack is the mid-range option at $13–$15 per meal
- Both meals include the same three components — burger, fries, and a drink
The Digital Picture — Who’s Winning Online?
Beyond physical presence, let us see how each brand performs digitally.
Website Engagement
| Five Guys | Shake Shack | |
|---|---|---|
| Avg. Time on Site | 2 min 41 sec | 2 min 20 sec |
Five Guys visitors spend slightly more time on its website than Shake Shack visitors — a difference of 21 seconds.
Web Traffic by Country
Both brands draw the majority of their traffic from the US:
| Country | Five Guys | Shake Shack |
|---|---|---|
| United States | 84.65% | 86.85% |
| Canada | 1.55% | 1.06% |
| Germany | 1.18% | 0.50% |
| Czech Republic | 0.80% | – |
| Australia | – | 0.62% |
| France | – | 0.56% |
| United Kingdom | 0.54% | – |
| Others | 11.28% | 10.41% |
Key observations directly from the data:
- Shake Shack draws a slightly higher share of US traffic than Five Guys (86.85% vs 84.65%)
Web Traffic by Age Group
Both Five Guys and Shake Shack skew toward younger audiences:
| Age Group | Five Guys | Shake Shack |
|---|---|---|
| 18-24 | 17.07% | 18.15% |
| 25-34 | 29.70% | 31.28% |
| 35-44 | 19.28% | 18.84% |
| 45-54 | 16.41% | 15.91% |
| 55-64 | 10.96% | 9.92% |
| 65+ | 6.58% | 5.9% |
- 25–34 is the biggest age group for both brands
- Shake Shack draws a slightly higher share of 25–34 visitors — 31.28% vs 29.70%
- Both brands attract similar age groups overall and are most popular with 18–44-year-olds.
- Traffic drops for older age groups in both cases.
Delivery — The Invisible Footprint
Physical locations tell one part of the story. Delivery coverage tells another.
Here’s what the data shows:
| Five Guys | Shake Shack | |
|---|---|---|
| Delivery Available | 1,508 locations | 310 locations |
| Delivery Not Available | 0 locations | 61 locations |
Two things stand out directly from this data:
- Every single Five Guys location in the US offers delivery– 1,508 out of 1,508
- 61 Shake Shack locations do not offer delivery– representing 16.4% of its total US footprint
For Five Guys, delivery coverage is total. For Shake Shack, it is near-total but not complete.
Five Guys Won the Map. The Data on Shake Shack Is Harder to Dismiss
The data paints a clear picture on scale. Five Guys wins — comprehensively.
- 4x more locations
- 16 more states
- 4.4x more cities
- 4.9x wider delivery network
- 1.7x more total revenue
But the single most striking number in this entire analysis is not a Five Guys number. It is Shake Shack’s ~$3.8M revenue per location — versus Five Guys’ ~$1.6M.
Shake Shack generates approximately 2.4x more revenue per location than Five Guys. With 371 locations against 1,508. With 34 states against 50. With a higher-priced competitor charging $2–$4 more per meal.
Here is what the data directly tells us:
- Five Guys has built the wider network
- Shake Shack has built the more productive one — at least on a per-location basis
- Both brands attract the same core demographic online — the 25–34 age group
- Five Guys holds the edge in total web engagement time — 2:41 vs 2:20
- Shake Shack edges ahead in US web traffic share — 86.85% vs 84.65%
Neither brand is losing. They are simply answering different questions with their growth models. The data shows two viable paths in the same category — and makes no definitive case for which is the smarter long-term bet.
What it does show is that more locations does not automatically mean more efficiency. And that gap — 4x the footprint, 1.7x the revenue — is the most important number in this analysis.
This analysis was built on location data, web traffic insights, and publicly available figures. If you want to conduct a similar competitive analysis for any brand or market, you need reliable, structured data.
ScrapeHero, one of the top 3 web scraping services globally, can help you extract location data, pricing information, and more from any website — at scale.
Disclaimer: Report by ScrapeHero using publicly available data. This report is independent and not affiliated with Shake Shack or Five Guys.
Ready to Build Your Own Market Analysis?
Frequently Asked Questions: Shake Shack vs Five Guys
No. Shake Shack operates primarily as a corporate-owned chain in the US, you cannot own a Shake Shack franchise domestically. Five Guys operates on a franchise model with US territories sold out. This single structural difference directly explains why Five Guys has 4x more US locations.
Both showed positive momentum in 2025. Five Guys same-store sales rose 4.4% through Q3 2025, while Shake Shack posted same-store sales growth of 4.9% in Q3 and 2.1% in Q4 2025. Five Guys
Yes, explicitly. Shake Shack has updated its target to at least 1,500 company-operated locations, up from its original 2015 IPO target of 450. Getting there means moving into suburban America with drive-thrus and smaller format units.