Here’s what this Amazon action figure market analysis gives you: hard data from 1,241 action figure products across 282 brands over a 7-day period.
We tracked pricing, reviews, seller distribution, and daily fluctuations to show you exactly what’s happening in this market.
How we gathered this data: We used ScrapeHero Cloud Amazon Search Results scraper to collect product details, pricing, and review data across the entire action figure category.
What you’ll learn:
- Which brands dominate both shelf space and consumer trust
- How sellers—from Amazon itself to third-party stores—control pricing and distribution
- Where sponsored products fit in the pricing landscape
- How one specific day saw dramatic shifts in price, engagement, and product availability
The bottom line upfront: Marvel and DC Comics control consumer attention. Amazon.com dominates distribution. And the market is more volatile than it appears, prices, and reviews, can shift significantly in 24 hours.
We analyzed 7 million reviews and tracked daily price changes to give you a clear picture of how this market operates. Let’s break down what the data reveals.
The Action Figure Market at a Glance: Scale and Structure
Before diving into brand competition or pricing strategies, you need to understand the market’s foundation. Here’s what 1,241 products tell us about Amazon’s action figure landscape.
Market size and diversity:
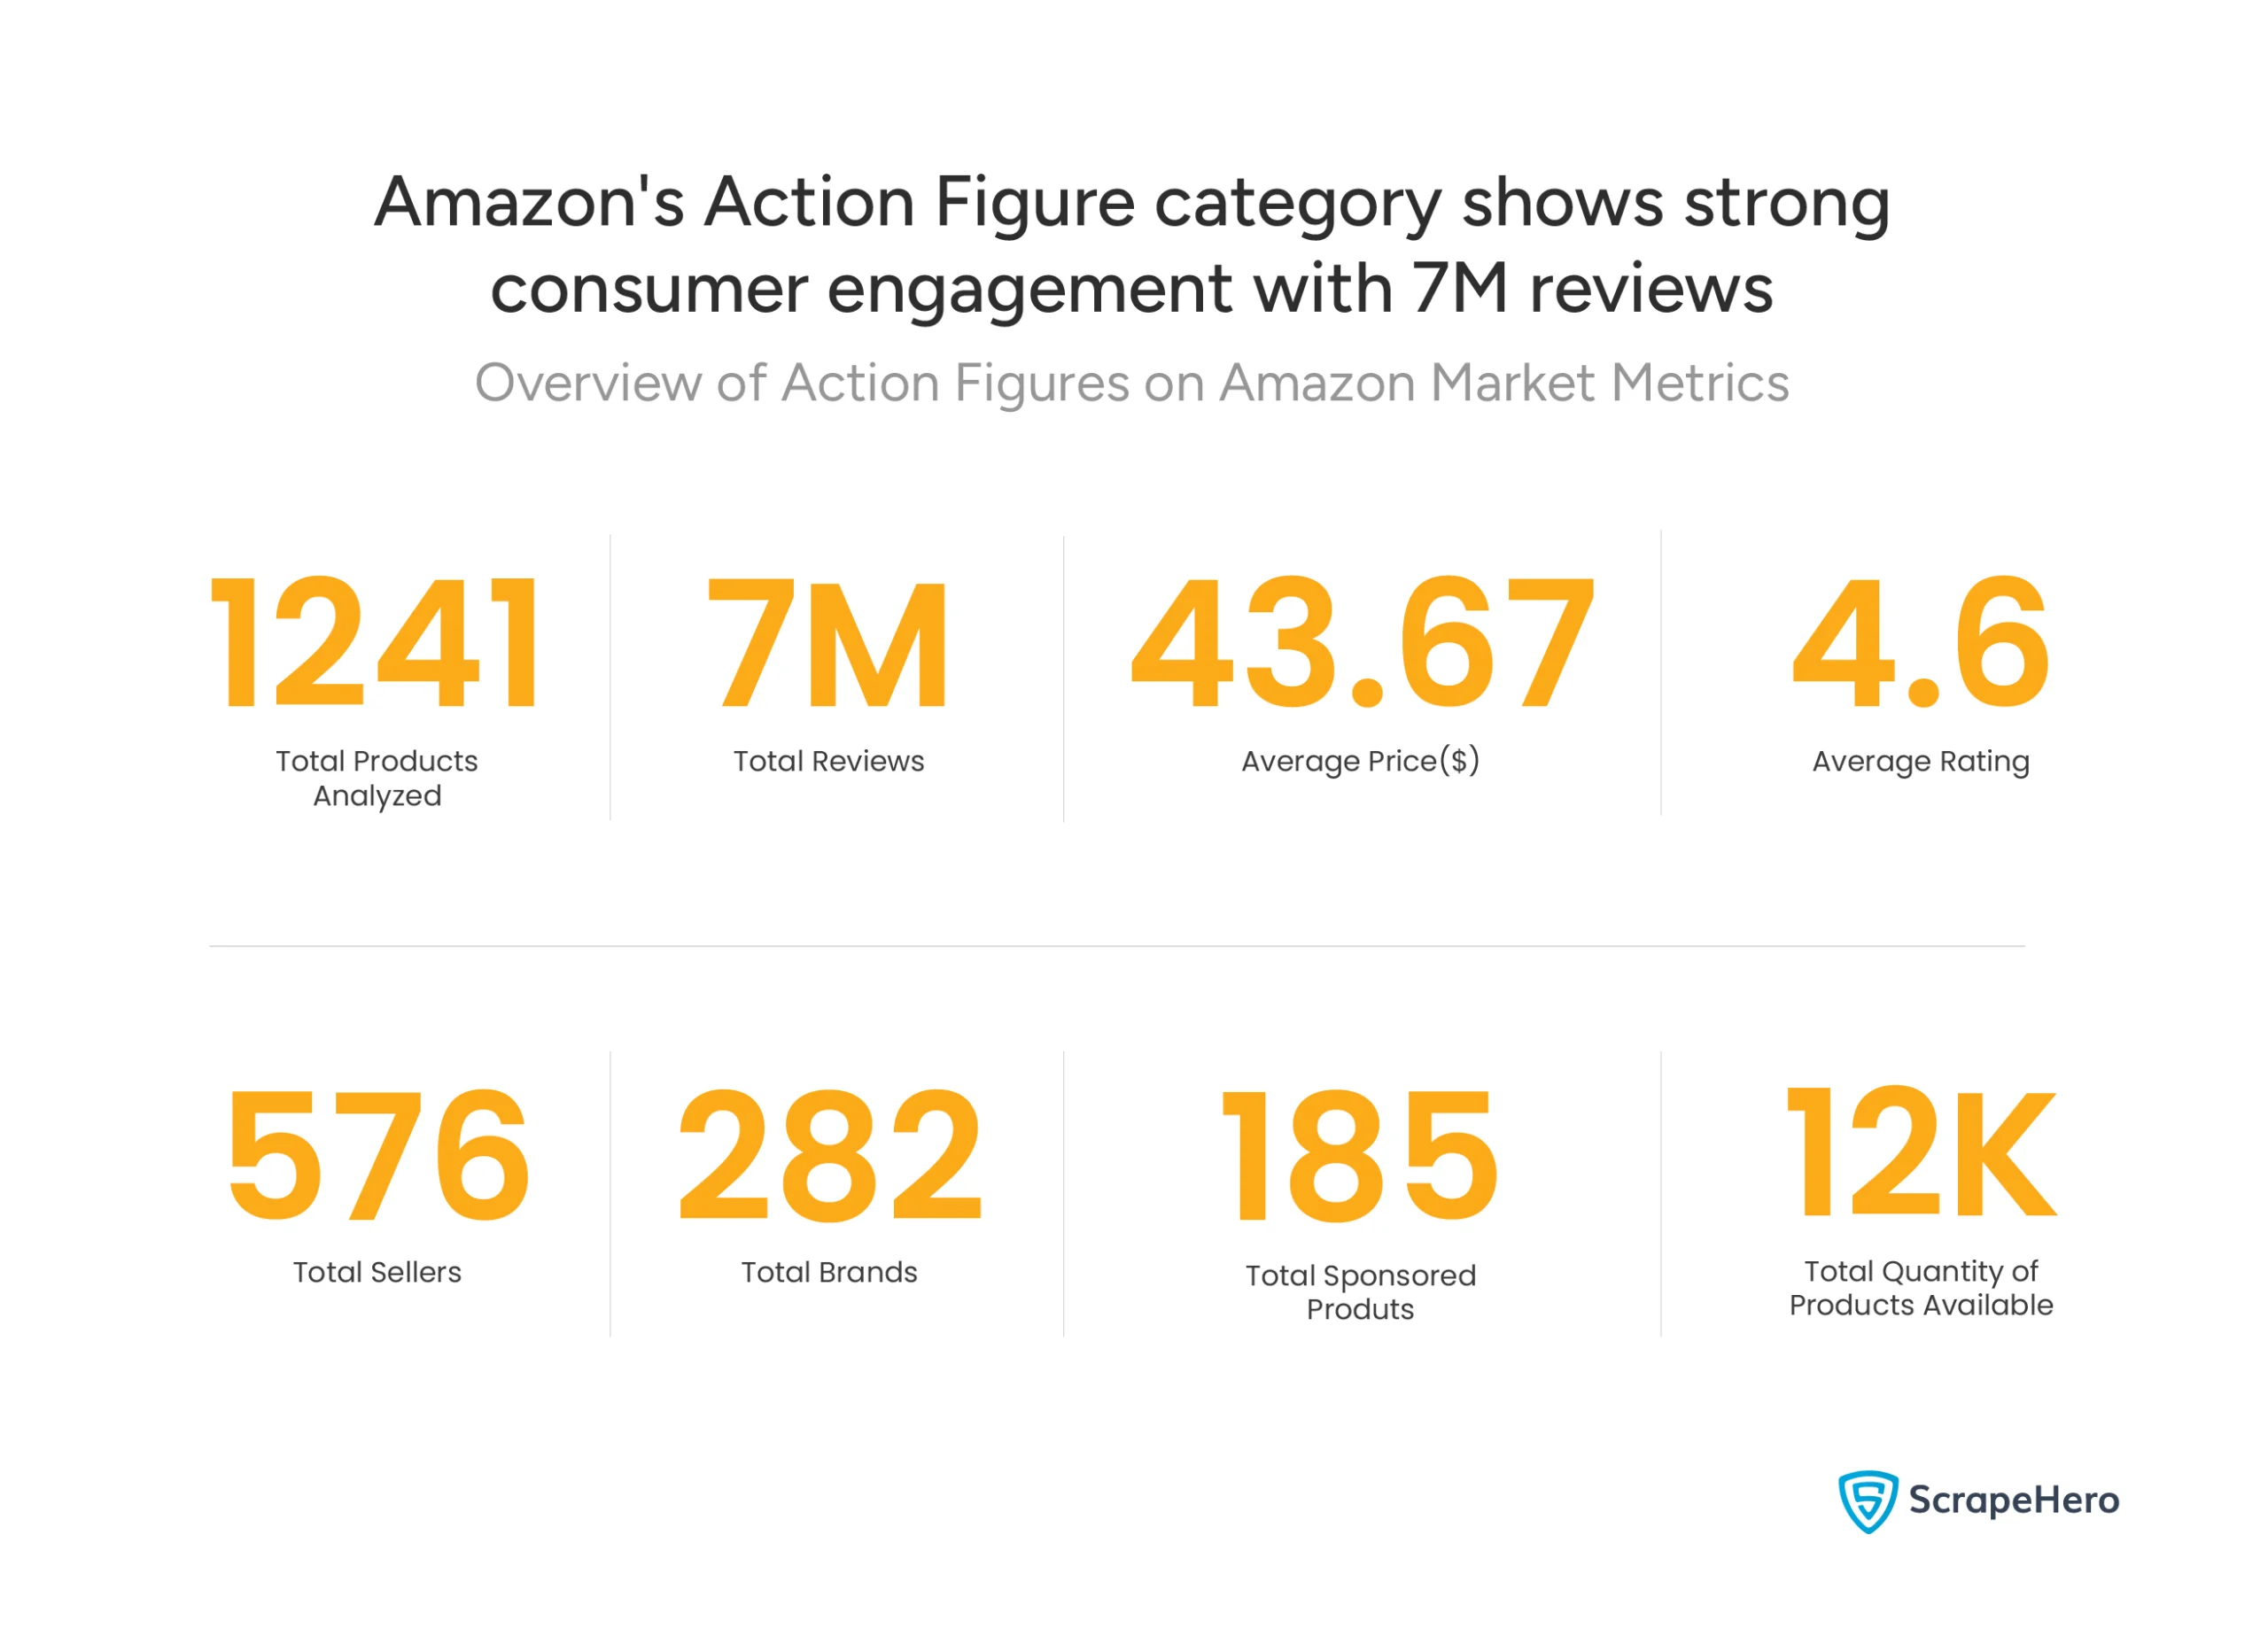
- 1,241 total products analyzed
- 282 distinct brands competing for attention
- 576 sellers distributing products
- 12,000 units available across the category
Consumer engagement:
- 7 million total reviews
- 4.6 average rating across all products
- 185 sponsored product listings (15% of total inventory)
Pricing benchmark:
- $43.67 average price point
This isn’t a niche market.
With 7 million reviews, you’re looking at substantial consumer activity and established buying patterns. The 4.6 average rating suggests customers are generally satisfied, but it also means standing out requires more than just decent quality.
Key takeaway: 282 brands competing across 1,241 products means differentiation matters.
Whether you’re entering this market or analyzing competitors, you’re facing established players with proven track records.
The 15% sponsored product rate shows that paid visibility is a common strategy, but 85% of products still compete organically.
Now that you know the market’s scale, let’s look at which brands actually dominate this space.
Competitive Arena: Brand Dominance and Pricing Strategy
This section breaks down brand dominance from two angles:
First, volume and pricing. Which brands have the most products listed, and how do they position themselves on price? This shows you who’s investing heavily in market presence.
Second, consumer engagement. Which brands generate the most reviews? This reveals where buyers actually spend their money and trust.
Let’s start with who’s taking up the most shelf space.
Which Brands Flood the Market (And at What Price)?
Product count tells you who’s investing in market presence. Price tells you their strategy. Here’s how the top Action Figure brands on Amazon stack up.
The Volume Leaders
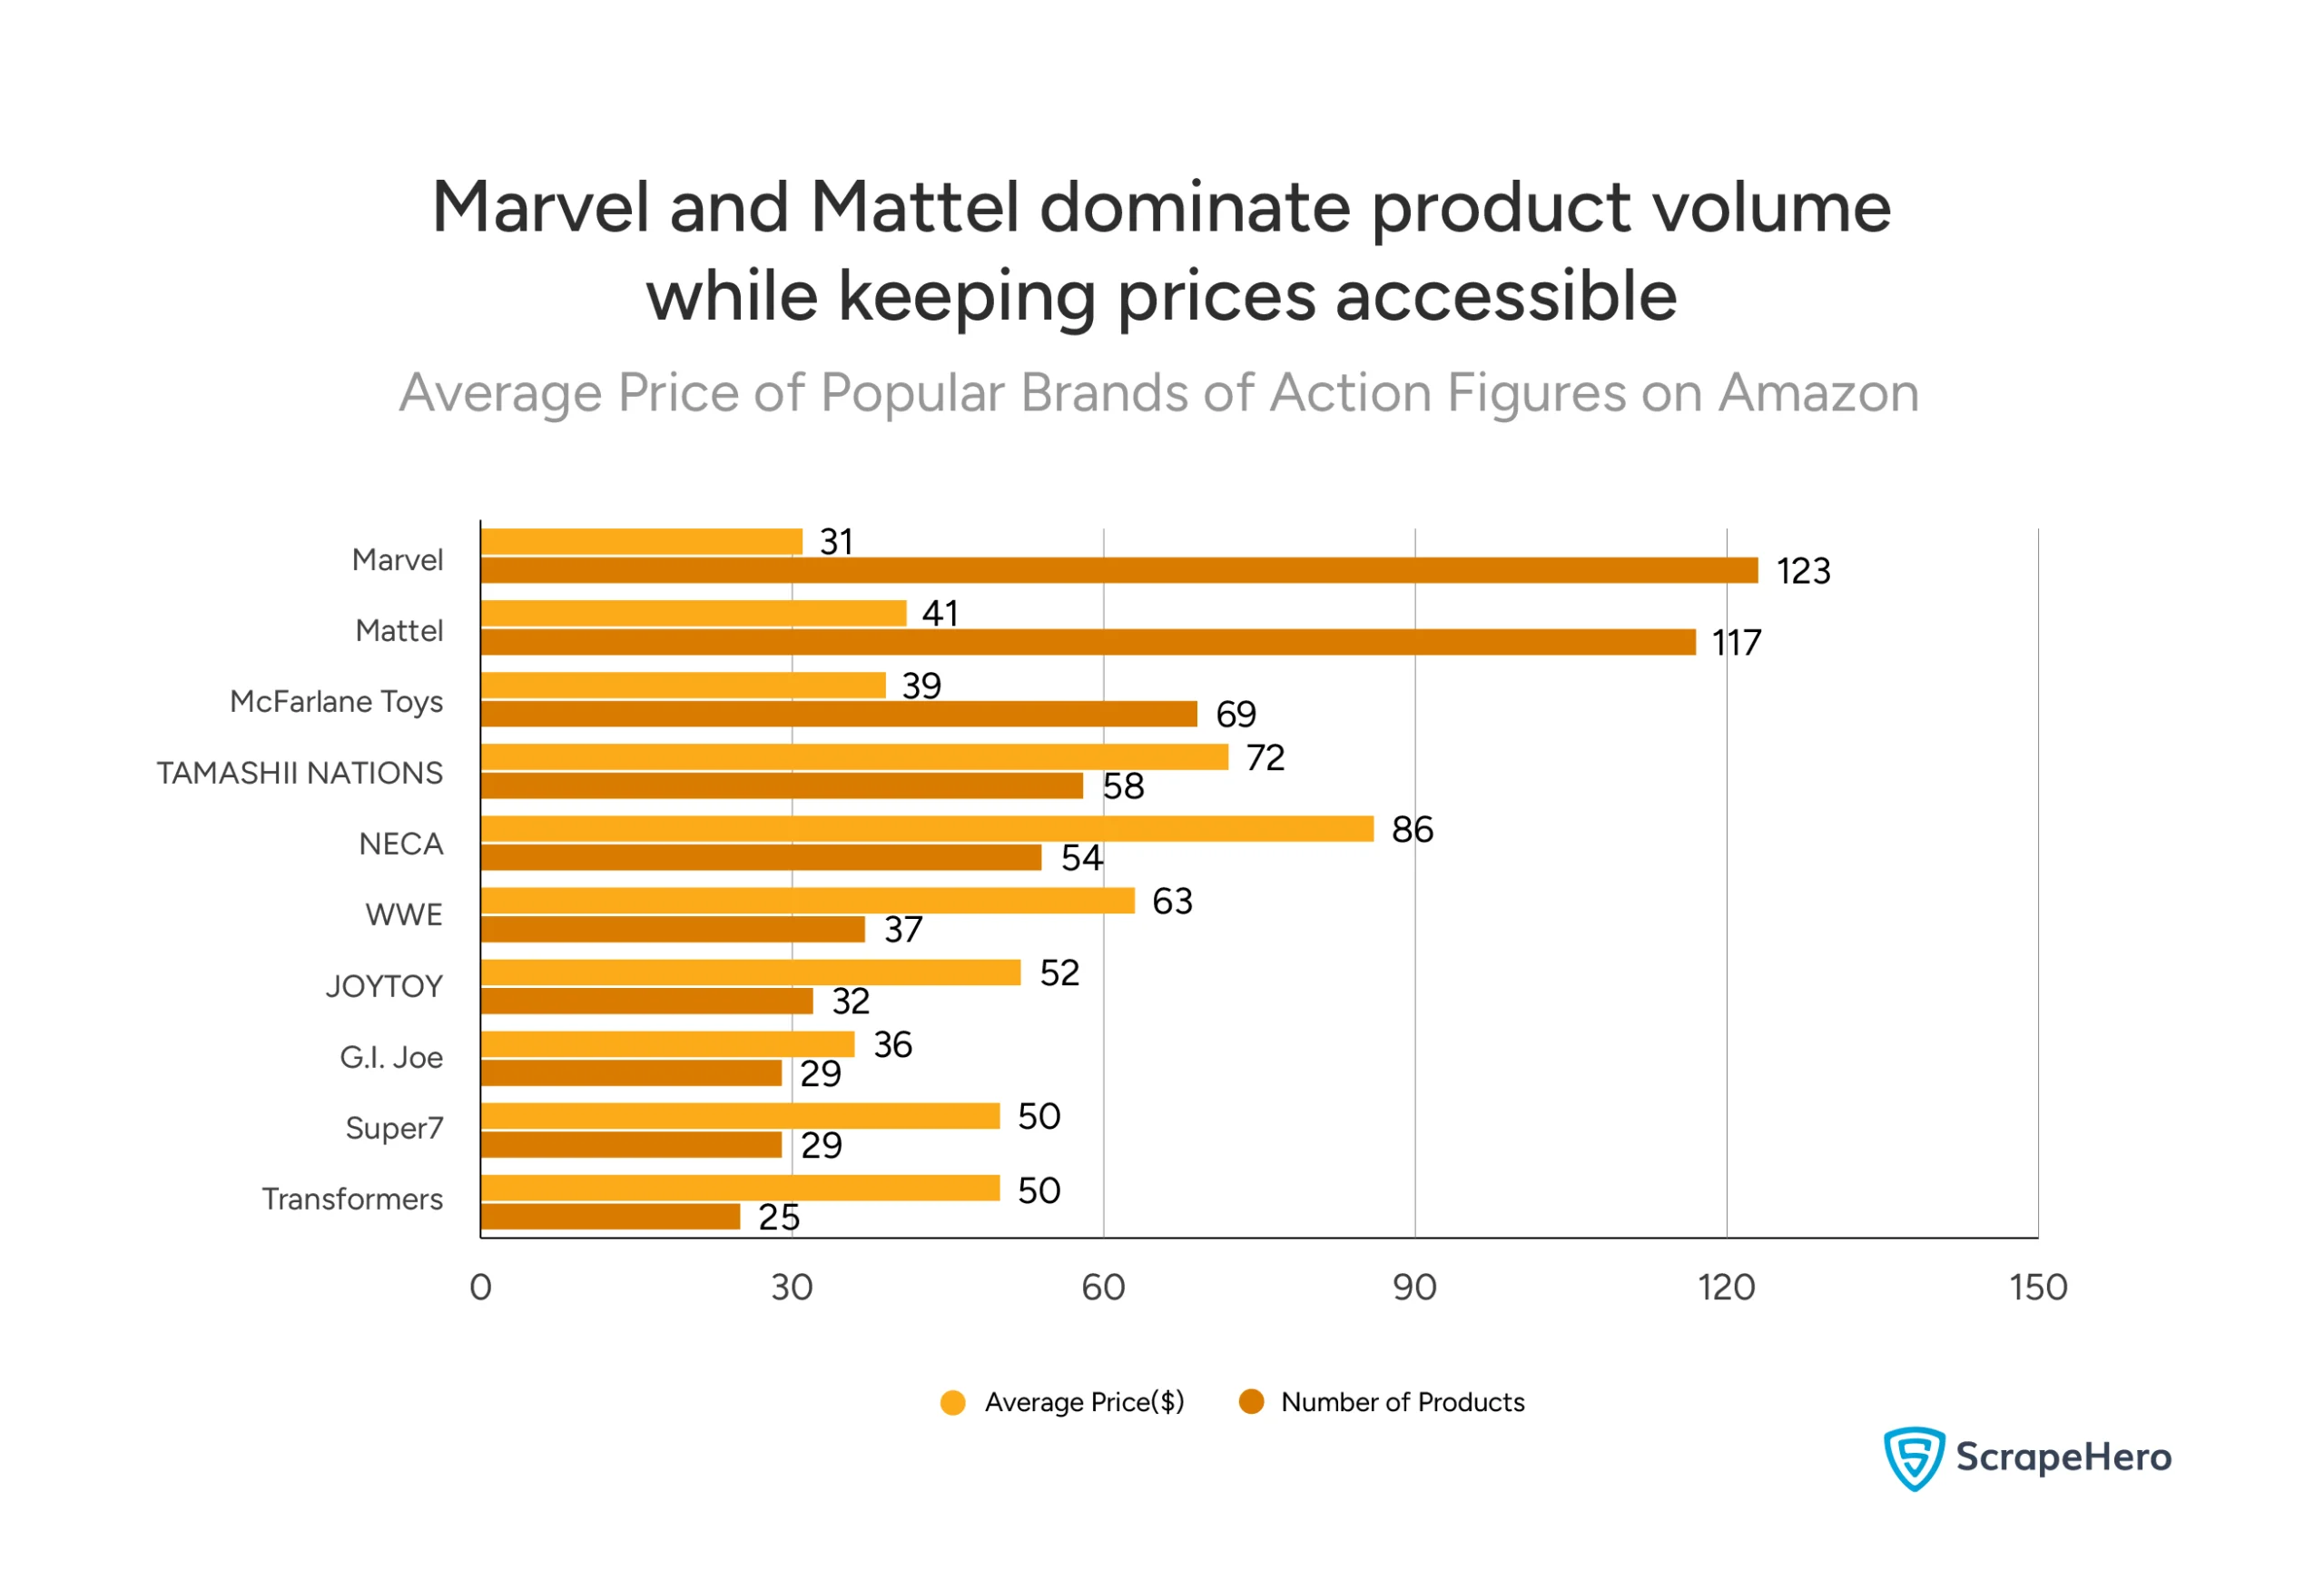
Marvel leads:
- 123 products listed
- $31 average price
Mattel follows close behind:
- 117 products listed
- $41 average price
McFarlane Toys takes third:
- 69 products listed
- $39 average price
The Price-to-Volume Strategy
The data reveals three distinct approaches:
High volume, low price (Market penetration):
- Marvel: 123 products at $31
- G.I. Joe: 29 products at $36
- Transformers: 25 products at $50
High volume, moderate price (Mass market premium):
- Mattel: 117 products at $41
- McFarlane Toys: 69 products at $39
- WWE: 37 products at $63
Lower volume, higher price (Collector focus):
- NECA: 54 products at $86
- TAMASHII NATIONS: 58 products at $72
- JOYTOY: 32 products at $52
Where Buyers Actually Spend Their Money?
Product count shows market presence. Review count shows market performance. Here’s where consumers actually put their trust and their money.
Marvel crushes the competition:
- 1,235K total reviews
- 28% more reviews than the second-place brand
- Clear leader in consumer engagement
DC Comics holds strong second:
- 965K total reviews
- Still commands nearly 1 million customer interactions
- Significant gap from Marvel, but far ahead of everyone else
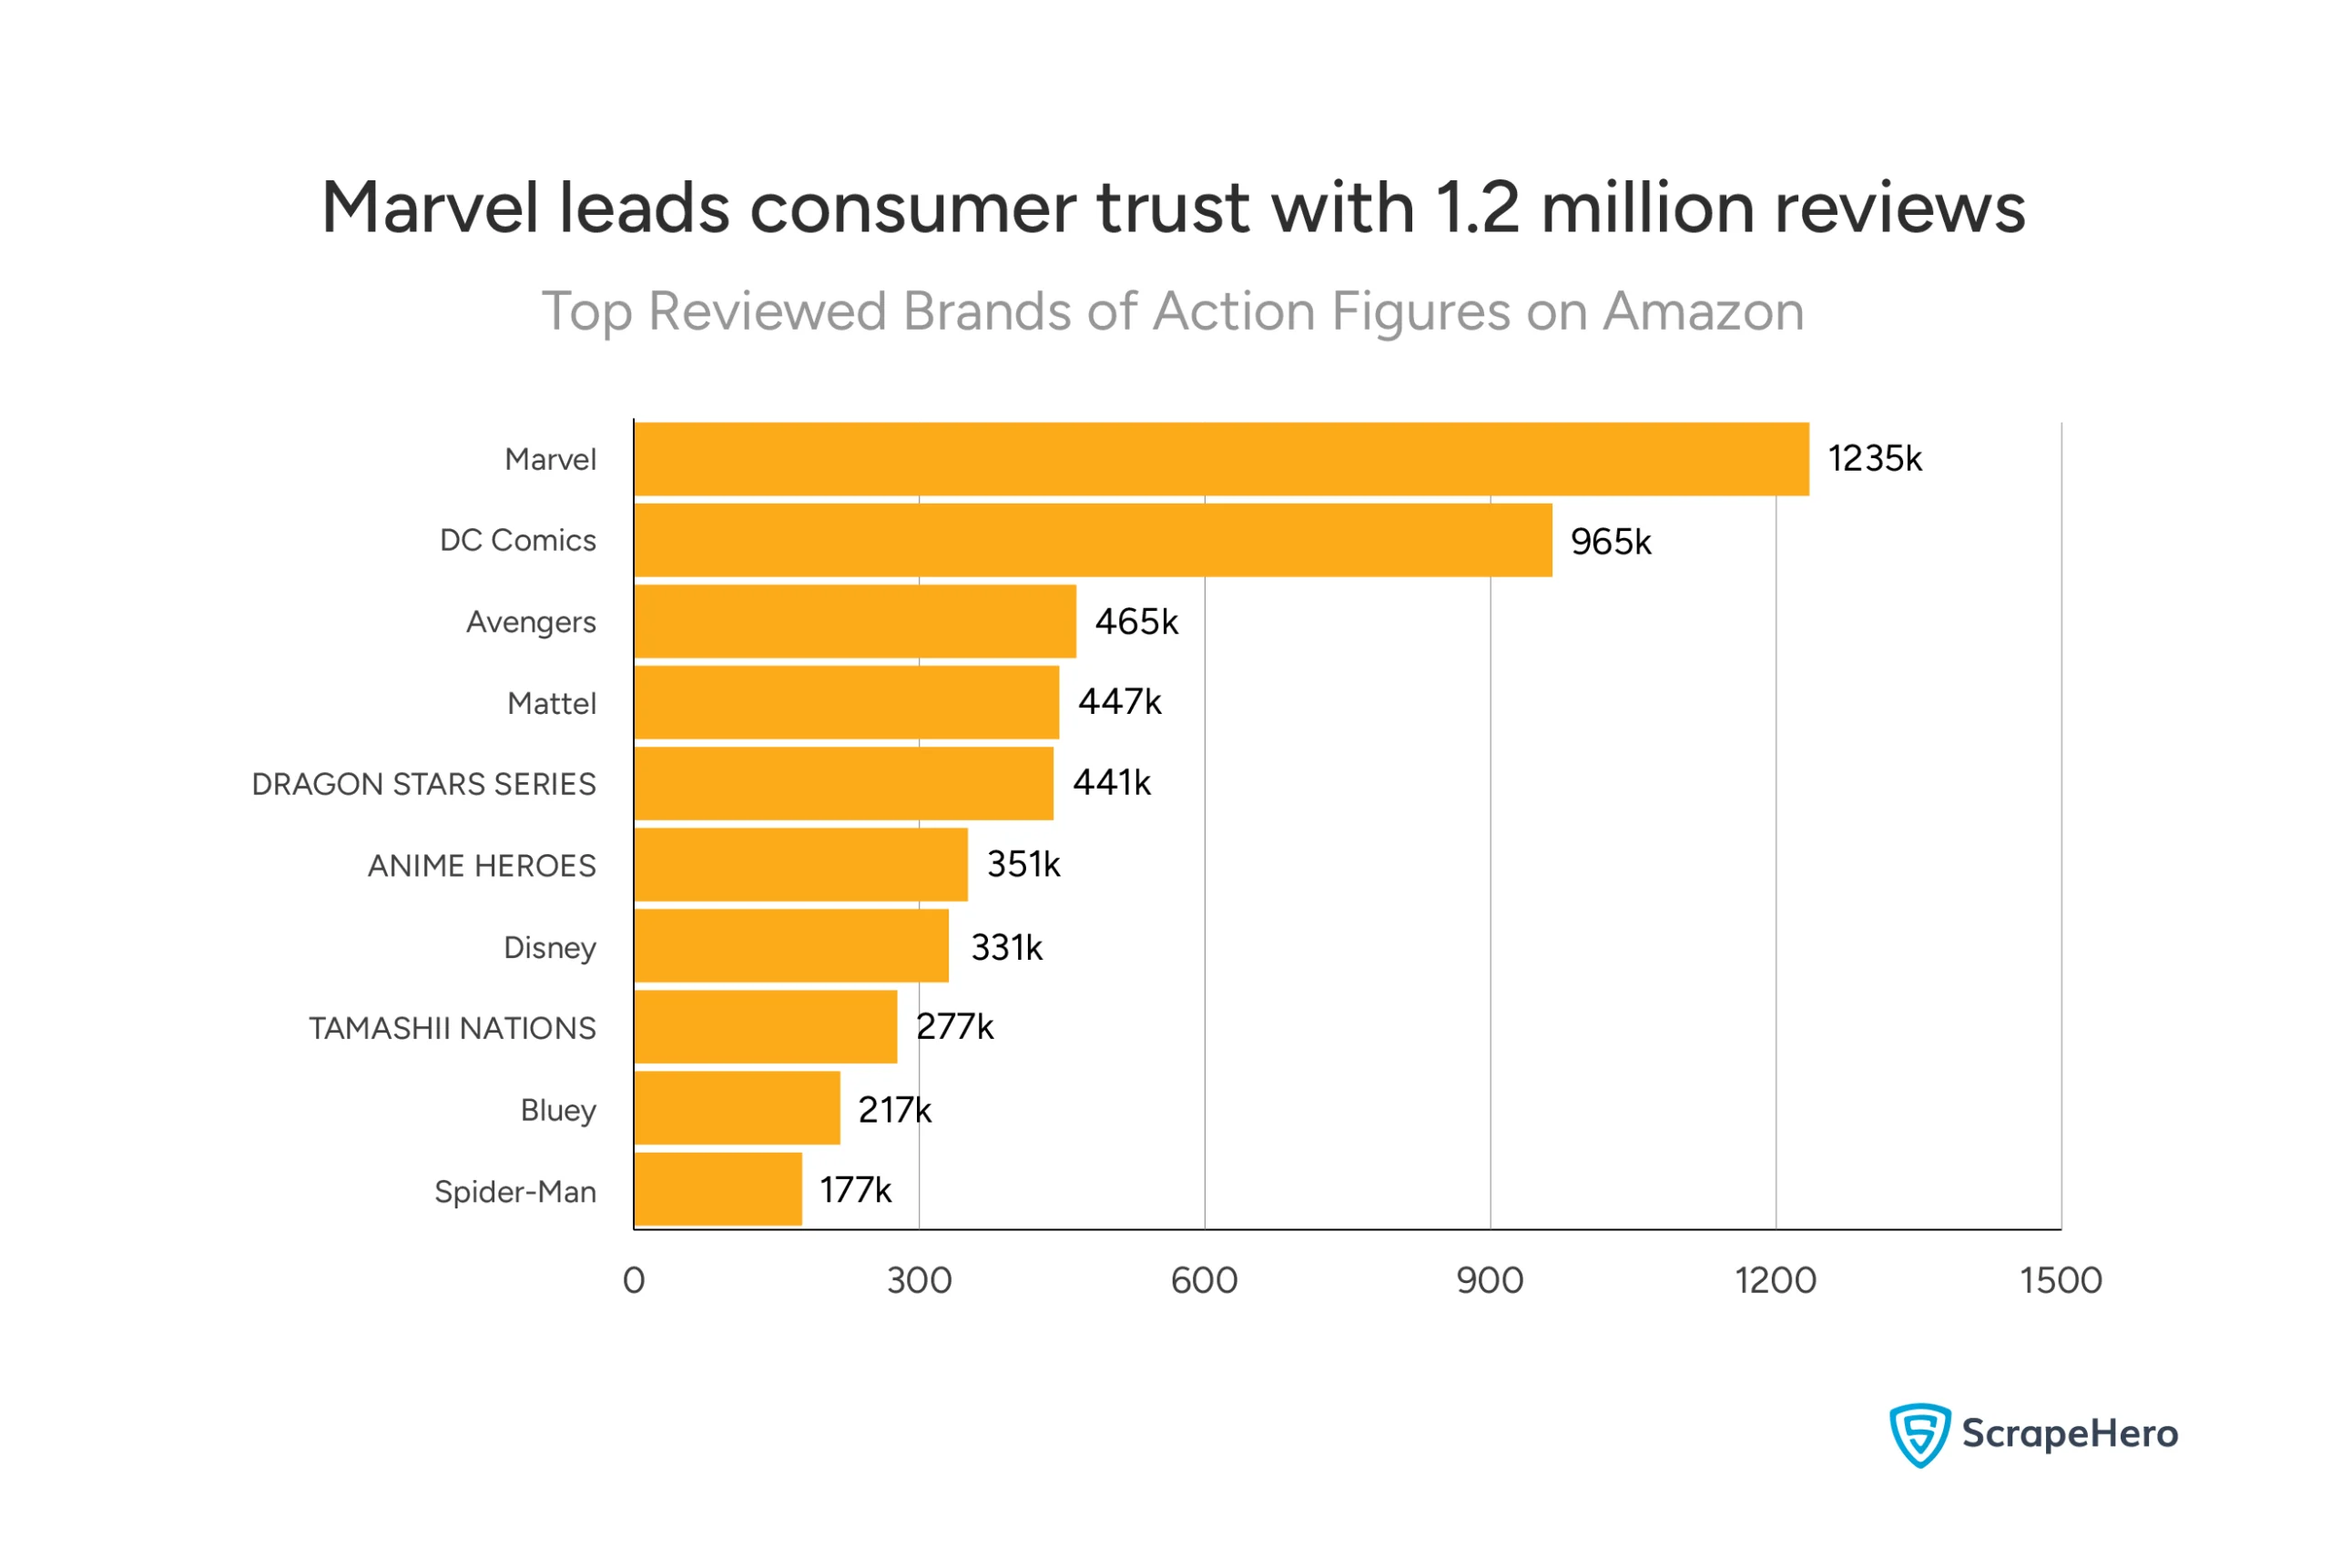
The mid-tier performers:
- Avengers: 465K reviews
- Mattel: 447K reviews
- DRAGON STARS SERIES: 441K reviews
These brands cluster in the 440K-465K range, forming a distinct middle tier.
Cross-Referencing Volume and Reviews
Look at Marvel’s position:
- Previous chart: 123 products, $31 average price
- This chart: 1235K reviews
That’s strong conversion. High product count translating to substantial review engagement.
Compare to brands missing from this top 10:
- McFarlane Toys had 69 products but didn’t crack the top reviewed list
- NECA had 54 products but is not on the top reviewed list
Volume doesn’t guarantee customer engagement.
Distribution Power: Who Gets These Products in Front of Buyers
You can have the best action figure in the world, but if you’re not in the right distribution channels, buyers won’t find it. Amazon’s marketplace operates on two tracks: Amazon itself as a direct seller, and third-party sellers competing for visibility.
This section answers two critical questions:
First, who dominates distribution? Which sellers move the most products, and how does their pricing compare? This shows you where the market power actually sits.
Second, can third-party sellers actually compete? Amazon has built-in advantages—trust, Prime shipping, search priority. But the review data tells a more nuanced story about who wins customer loyalty.
Who Controls the Action Figure Distribution?
Distribution isn’t evenly spread. One seller controls the overwhelming majority of product listings, while third-party sellers fight for the remaining space.
The Distribution Breakdown <h4>
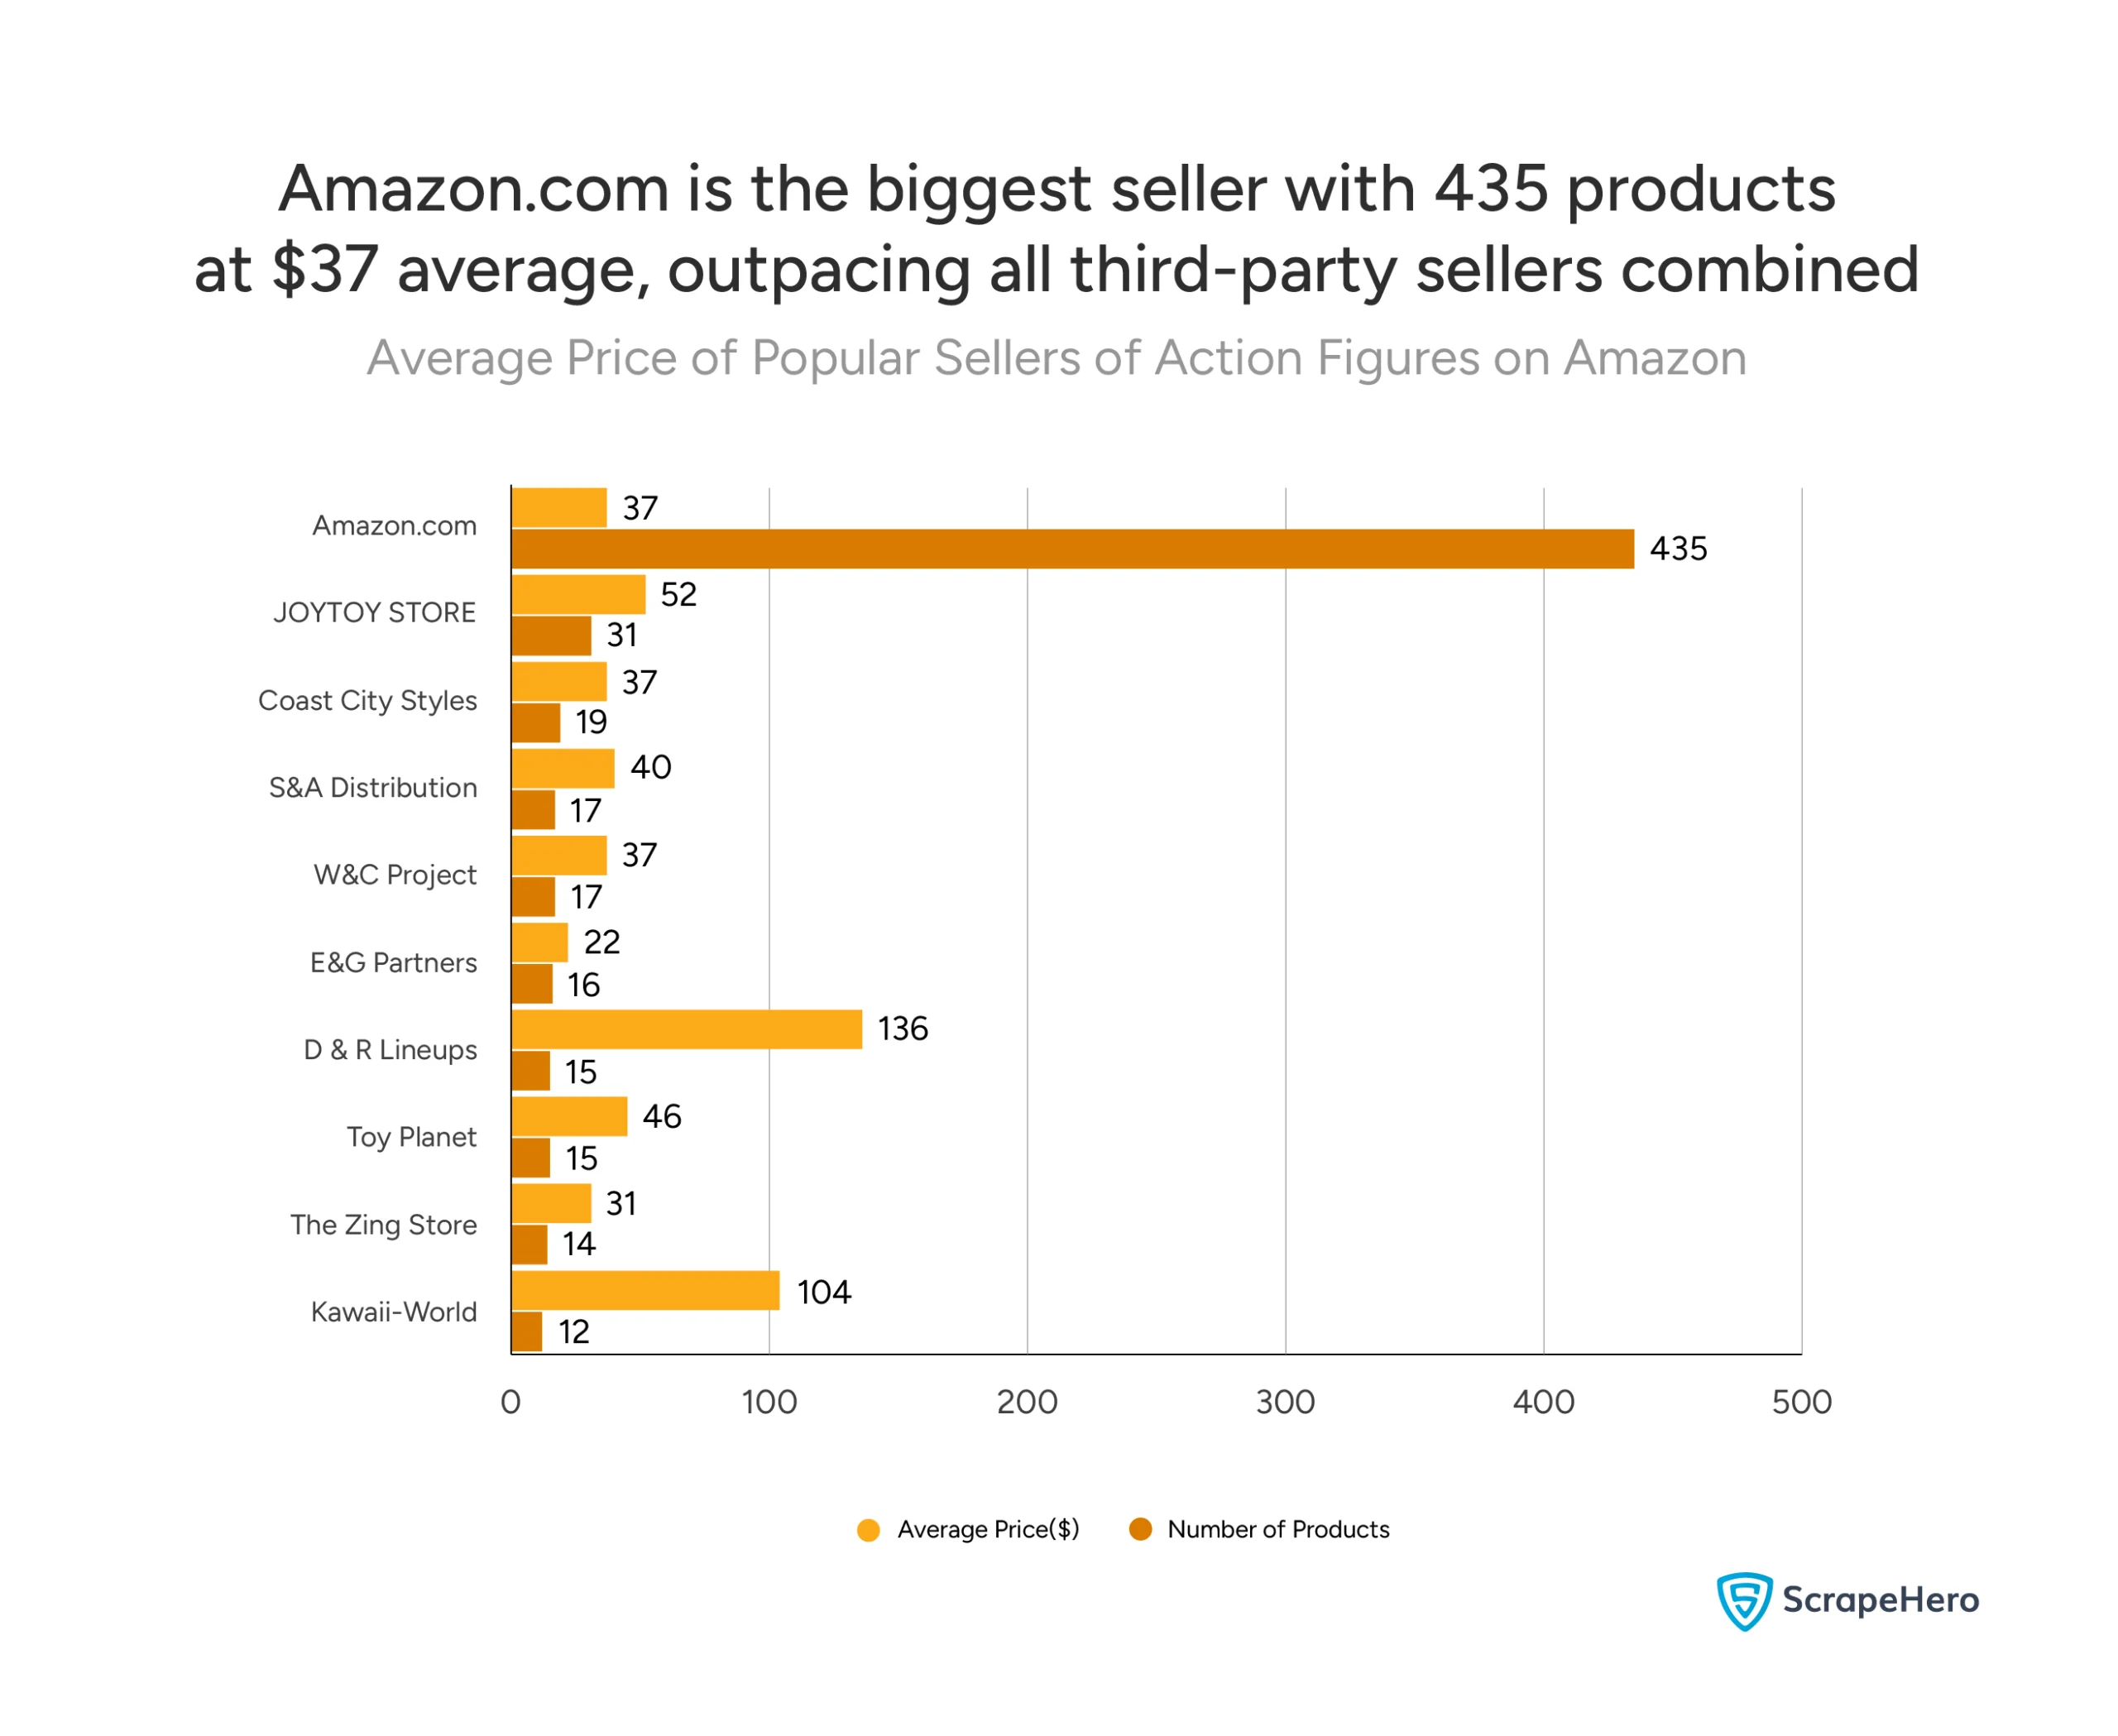
Amazon.com’s dominance is absolute:
- 435 products listed
- $37 average price
- More products than the next 9 sellers combined
JOYTOY STORE claims second place:
- 31 products listed
- $52 average price
- 14x fewer products than Amazon
The rest fight for scraps:
- Coast City Styles: 19 products at $37
- S&A Distribution: 17 products at $40
- W&C Project: 17 products at $37
- E&G Partners: 16 products at $22
Amazon’s 435-product catalog isn’t just about scale. It’s about control. When one seller lists 35% of all analyzed products, they set market expectations for:
- Pricing norms
- Shipping speed
- Product availability
- Search visibility
Key Distribution Insights
If you’re a brand: Getting your products listed under Amazon.com gives you massive visibility advantages. But premium brands like those sold by D & R Lineups show you can succeed outside Amazon’s direct distribution.
If you’re a seller: You’re competing against a platform that also sells directly. Amazon’s $37 average sets the price expectation.
If you’re analyzing competitors: Look beyond product counts. JOYTOY STORE’s 31 products at $52 suggests a focused strategy on higher-margin items rather than volume play.
But product count doesn’t tell the whole story. Let’s see which sellers actually win consumer trust through reviews.
Can Third-Party Sellers Compete with Amazon?
Product listings tell you who’s present. Reviews tell you who buyers trust.
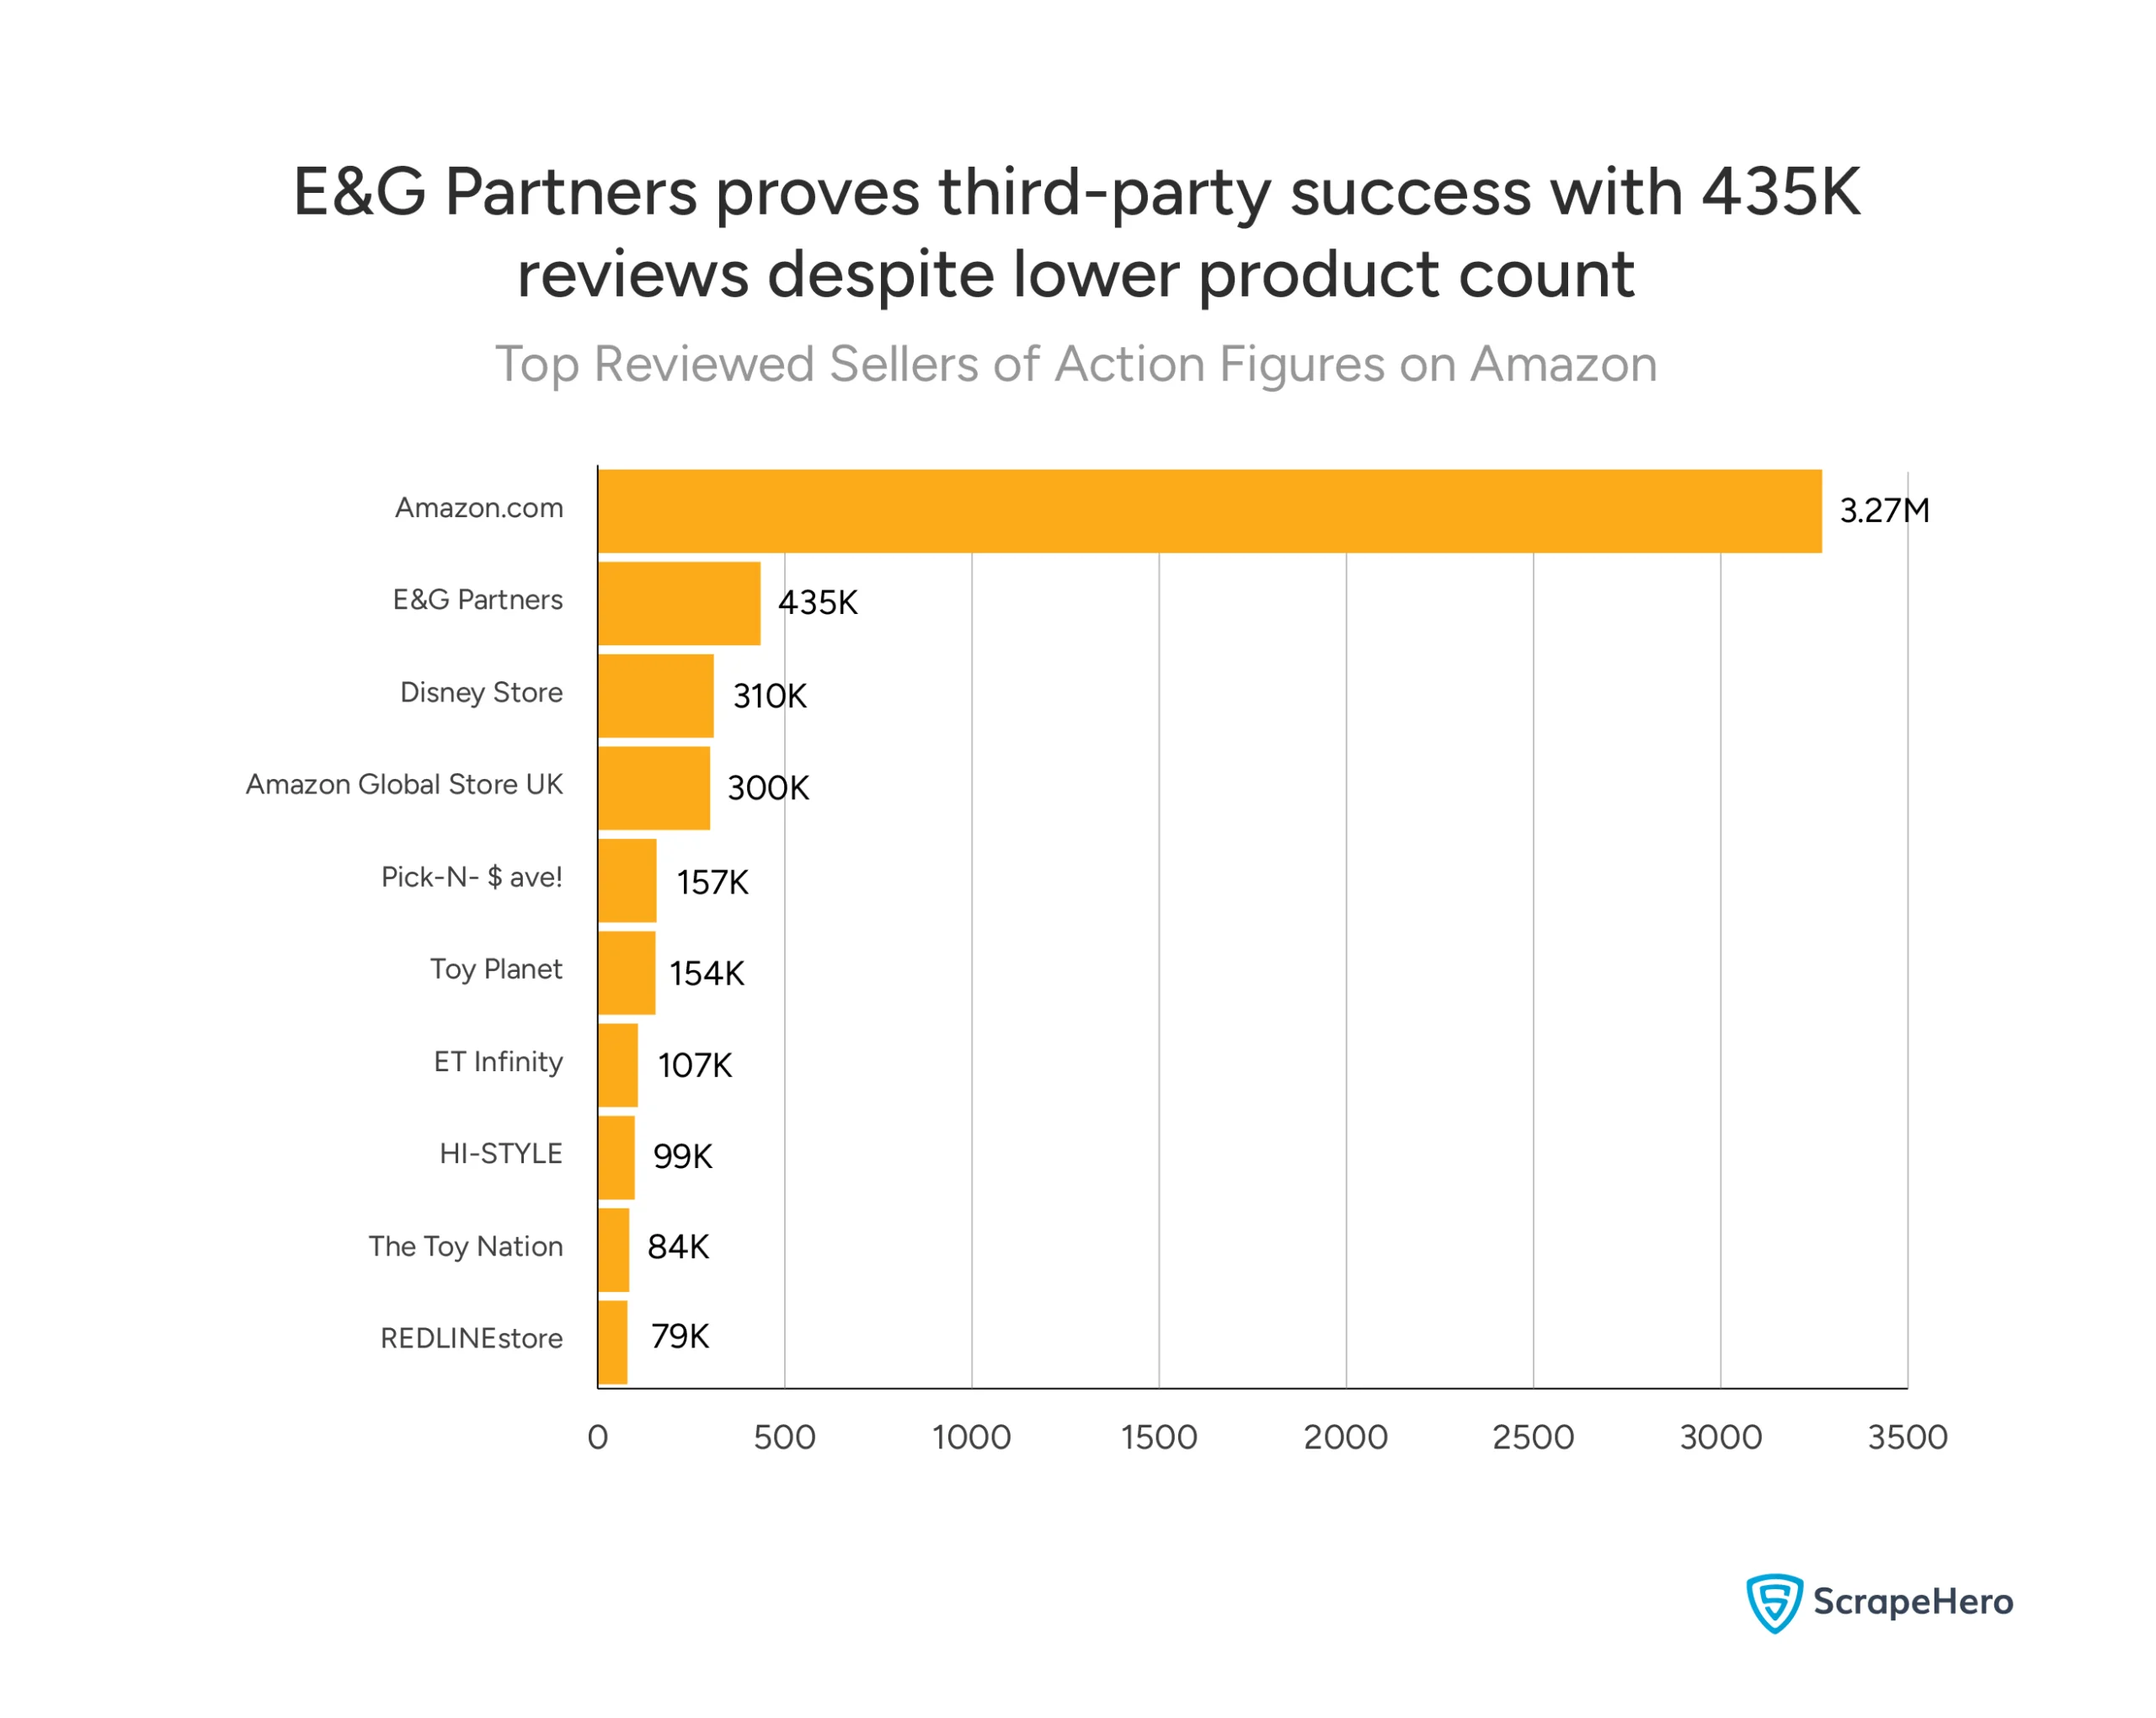
Amazon.com dominates consumer engagement:
- 3,271K total reviews
- 7.5x more reviews than the second-place seller
- Reinforces its product count advantage with massive consumer trust
E&G Partners emerges as the standout third-party seller:
- 435K reviews
- Remember: only 16 products listed (from previous chart)
Other notable third-party performers:
- Disney Store: 310K reviews
- Amazon Global Store UK: 300K reviews
- Pick-N-Save: 157K reviews
- Toy Planet: 154K reviews
E&G Partners listed only 16 products but generated 435K reviews. Compare that to JOYTOY STORE from the previous chart—31 products listed but not even in the top 10 sellers for reviews.
What this suggests:
- Product count doesn’t guarantee customer engagement
- Quality and customer satisfaction drive reviews
- Third-party sellers can build trust despite Amazon’s advantages
The Amazon Ecosystem Effect
Notice Amazon Global Store UK with 300K reviews. Amazon’s own satellite stores capture significant engagement, reinforcing the platform’s overall dominance.
Combined Amazon entities:
- Amazon.com: 3.271 M reviews
- Amazon Global Store UK: 300K reviews
- Total Amazon control: 3,571K reviews
That’s over half of all reviews in this top 10 list.
Market Dynamics and Volatility
You’ve seen which brands dominate. You know who controls distribution. Now here’s what most analyses miss: how fast this market moves.
Action figure pricing isn’t static. Over just seven days, we tracked significant fluctuations that reveal how dynamic and unpredictable this market can be.
This section answers a critical question: can you rely on pricing stability, or do you need to monitor daily changes?
How Stable are Action Figure Prices on Amazon?
Price stability matters. If you’re planning inventory buys, setting competitive prices, or forecasting margins, you need to know how much prices move day-to-day.
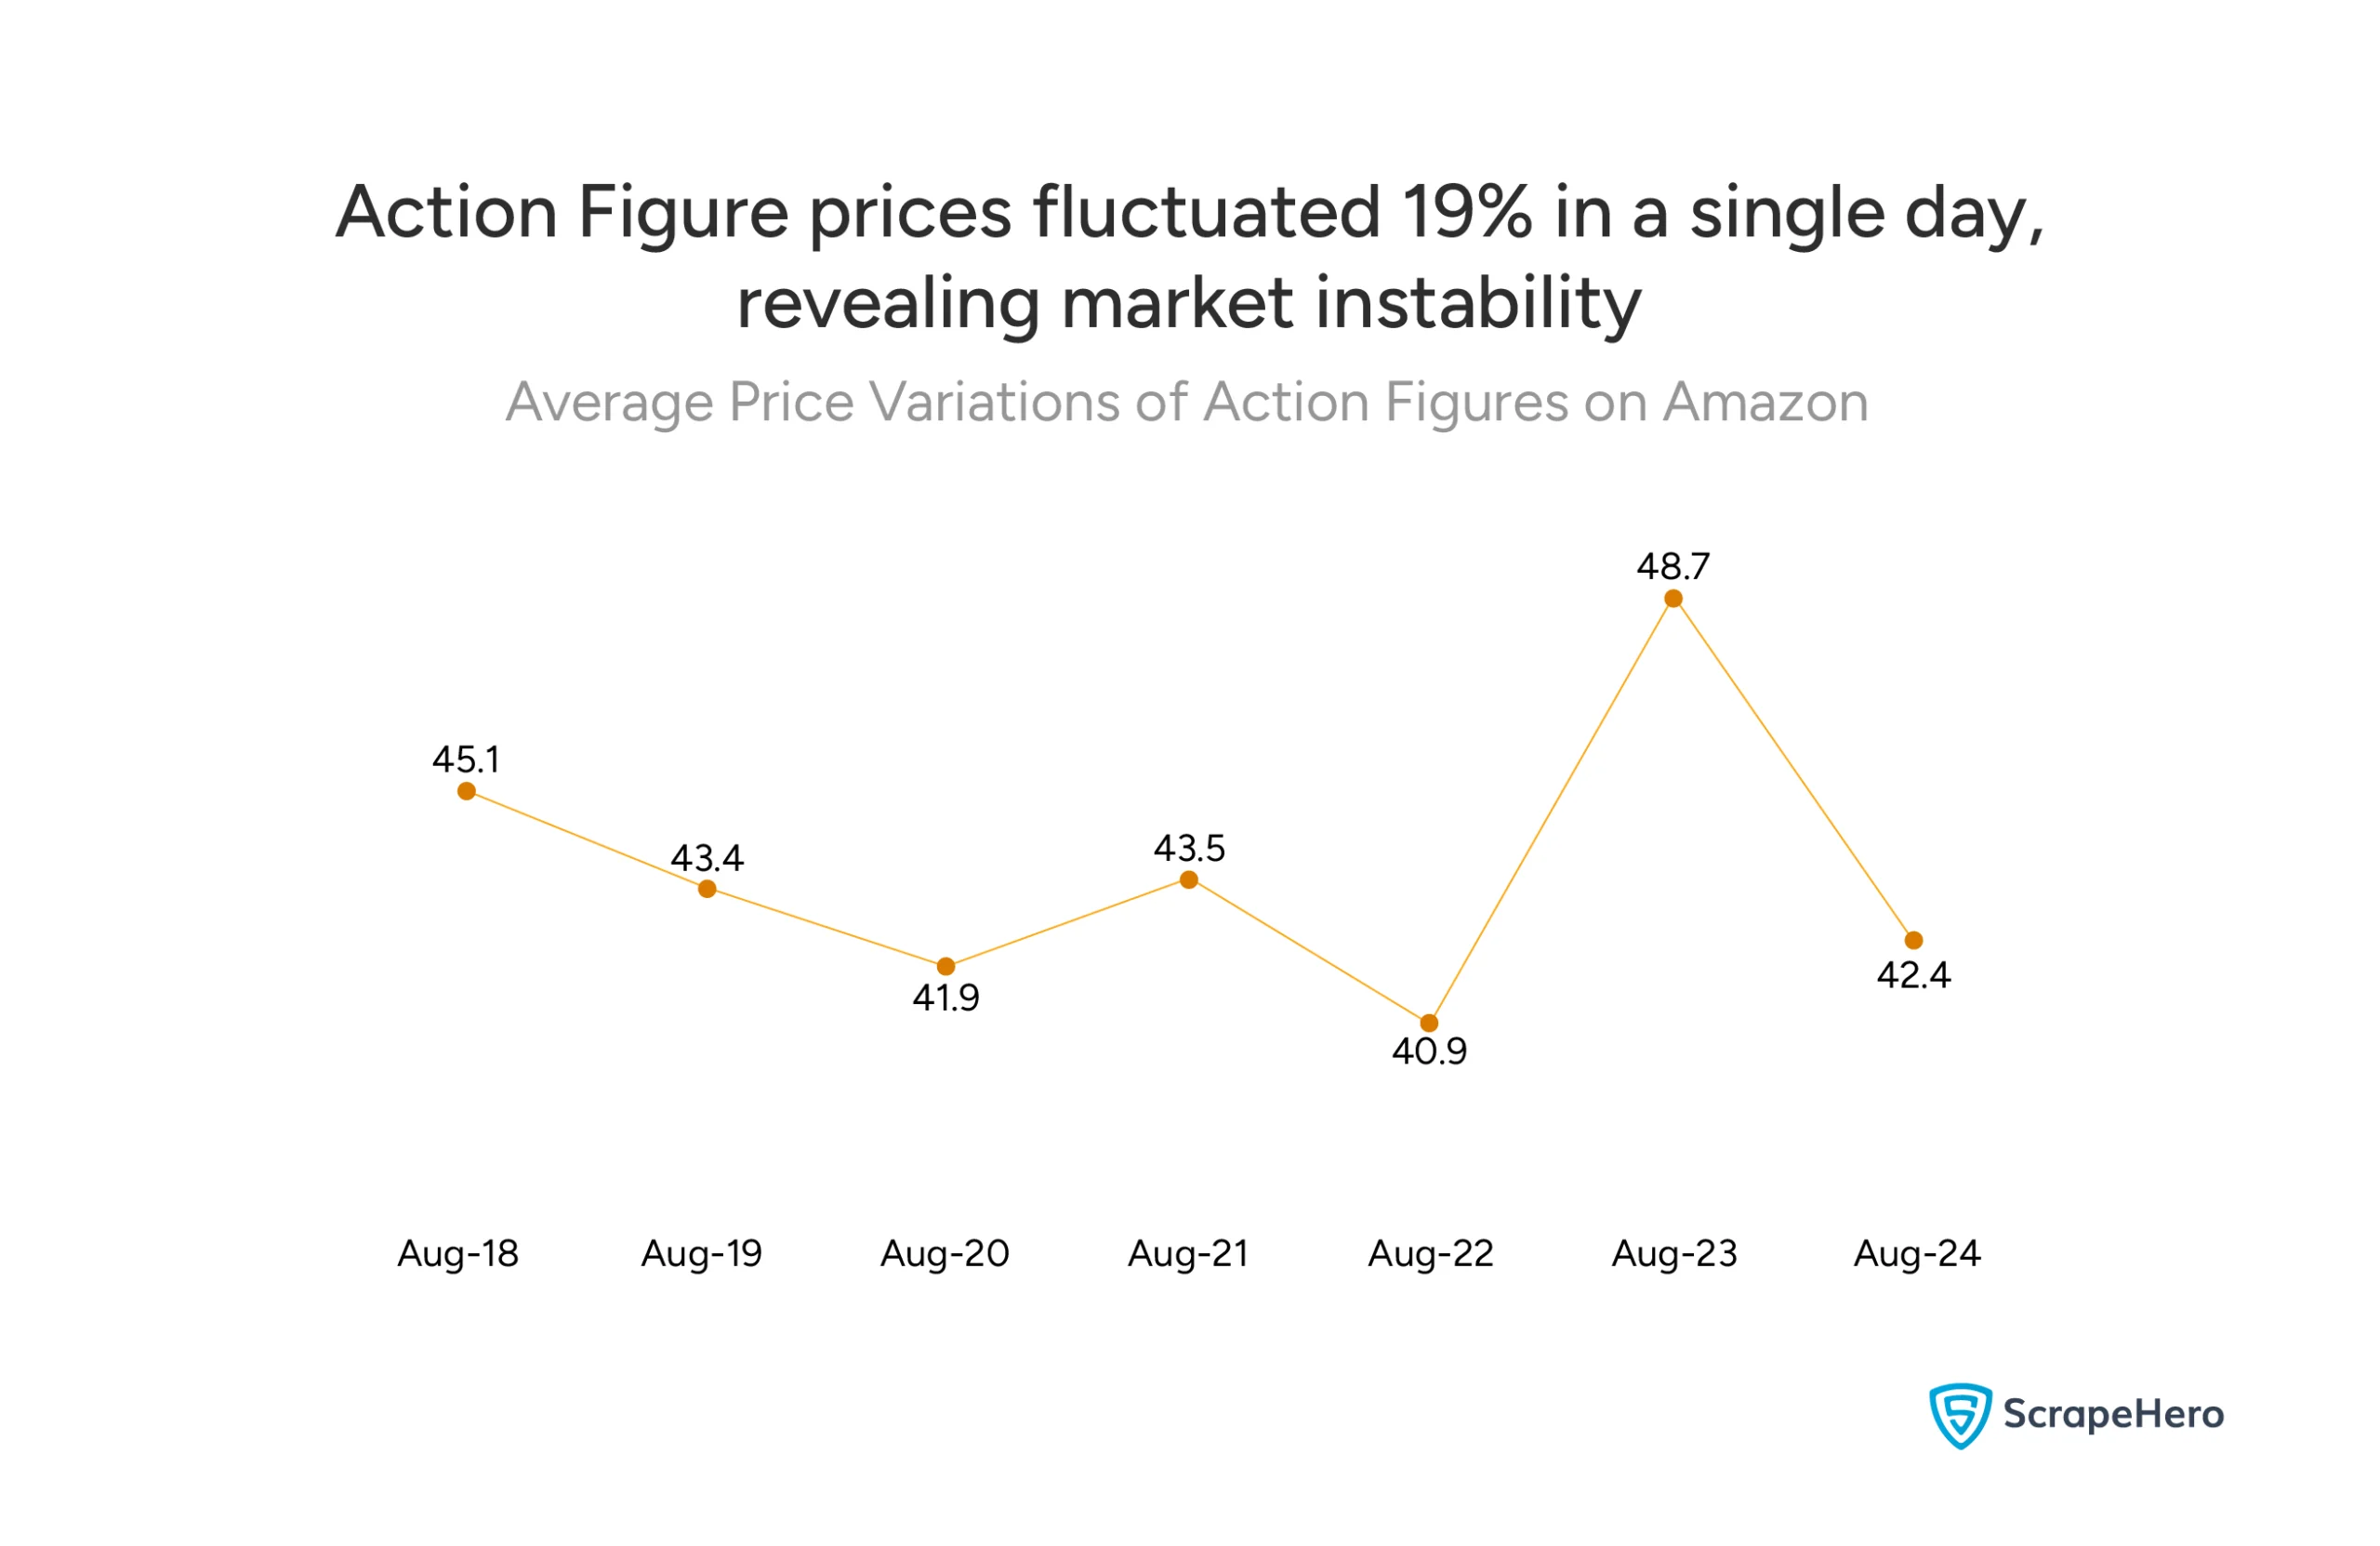
Days 1-5 showed gradual decline:
- Day 1: $45.1
- Day 2: $43.4
- Day 3: $41.9
- Day 4: $43.5
- Day 5: $40.9 (lowest point)
Prices drifted downward over five days, dropping $4.20 from start to the week’s low point.
Then Day 6 broke the pattern:
- Day 6: $48.7
- Jump from $40.9 to $48.7
- 19% increase in 24 hours
Day 7 showed correction:
- Day 7: $42.4
- Prices retreated but stayed above the Day 5 low
What the Price Range Tells You
Total volatility span: $40.9 to $48.7
- $7.80 difference between lowest and highest points
- 19% swing from bottom to peak
For context: the market’s average price across all our data was $43.67. Day 6’s spike to $48.7 pushed prices 11.5% above that baseline.
The Price Pattern Breakdown
Normal fluctuation (Days 1-5, Day 7):
- Price movements of $1-2 per day
- Gradual trending in one direction
- Predictable competitive behavior
Anomalous spike (Day 6):
- $7.80 jump overnight
- Complete reversal of previous downward trend
- Suggests external market force, not gradual adjustment
Action figure pricing isn’t stable. The 19% single-day spike on Day 6 proves this market can shift dramatically overnight. You can’t set a price and forget it, especially when market forces you don’t control can reshape the landscape in 24 hours.
But price is only half the story. Let’s look at what else changed on Day 6.
How Does the Review Count of Action Figures Fluctuate on Amazon?
Day 6 wasn’t just about price. When we layer review data over the price spike, a complete picture emerges, and it tells you exactly what happened in the market.
The Review Engagement Pattern
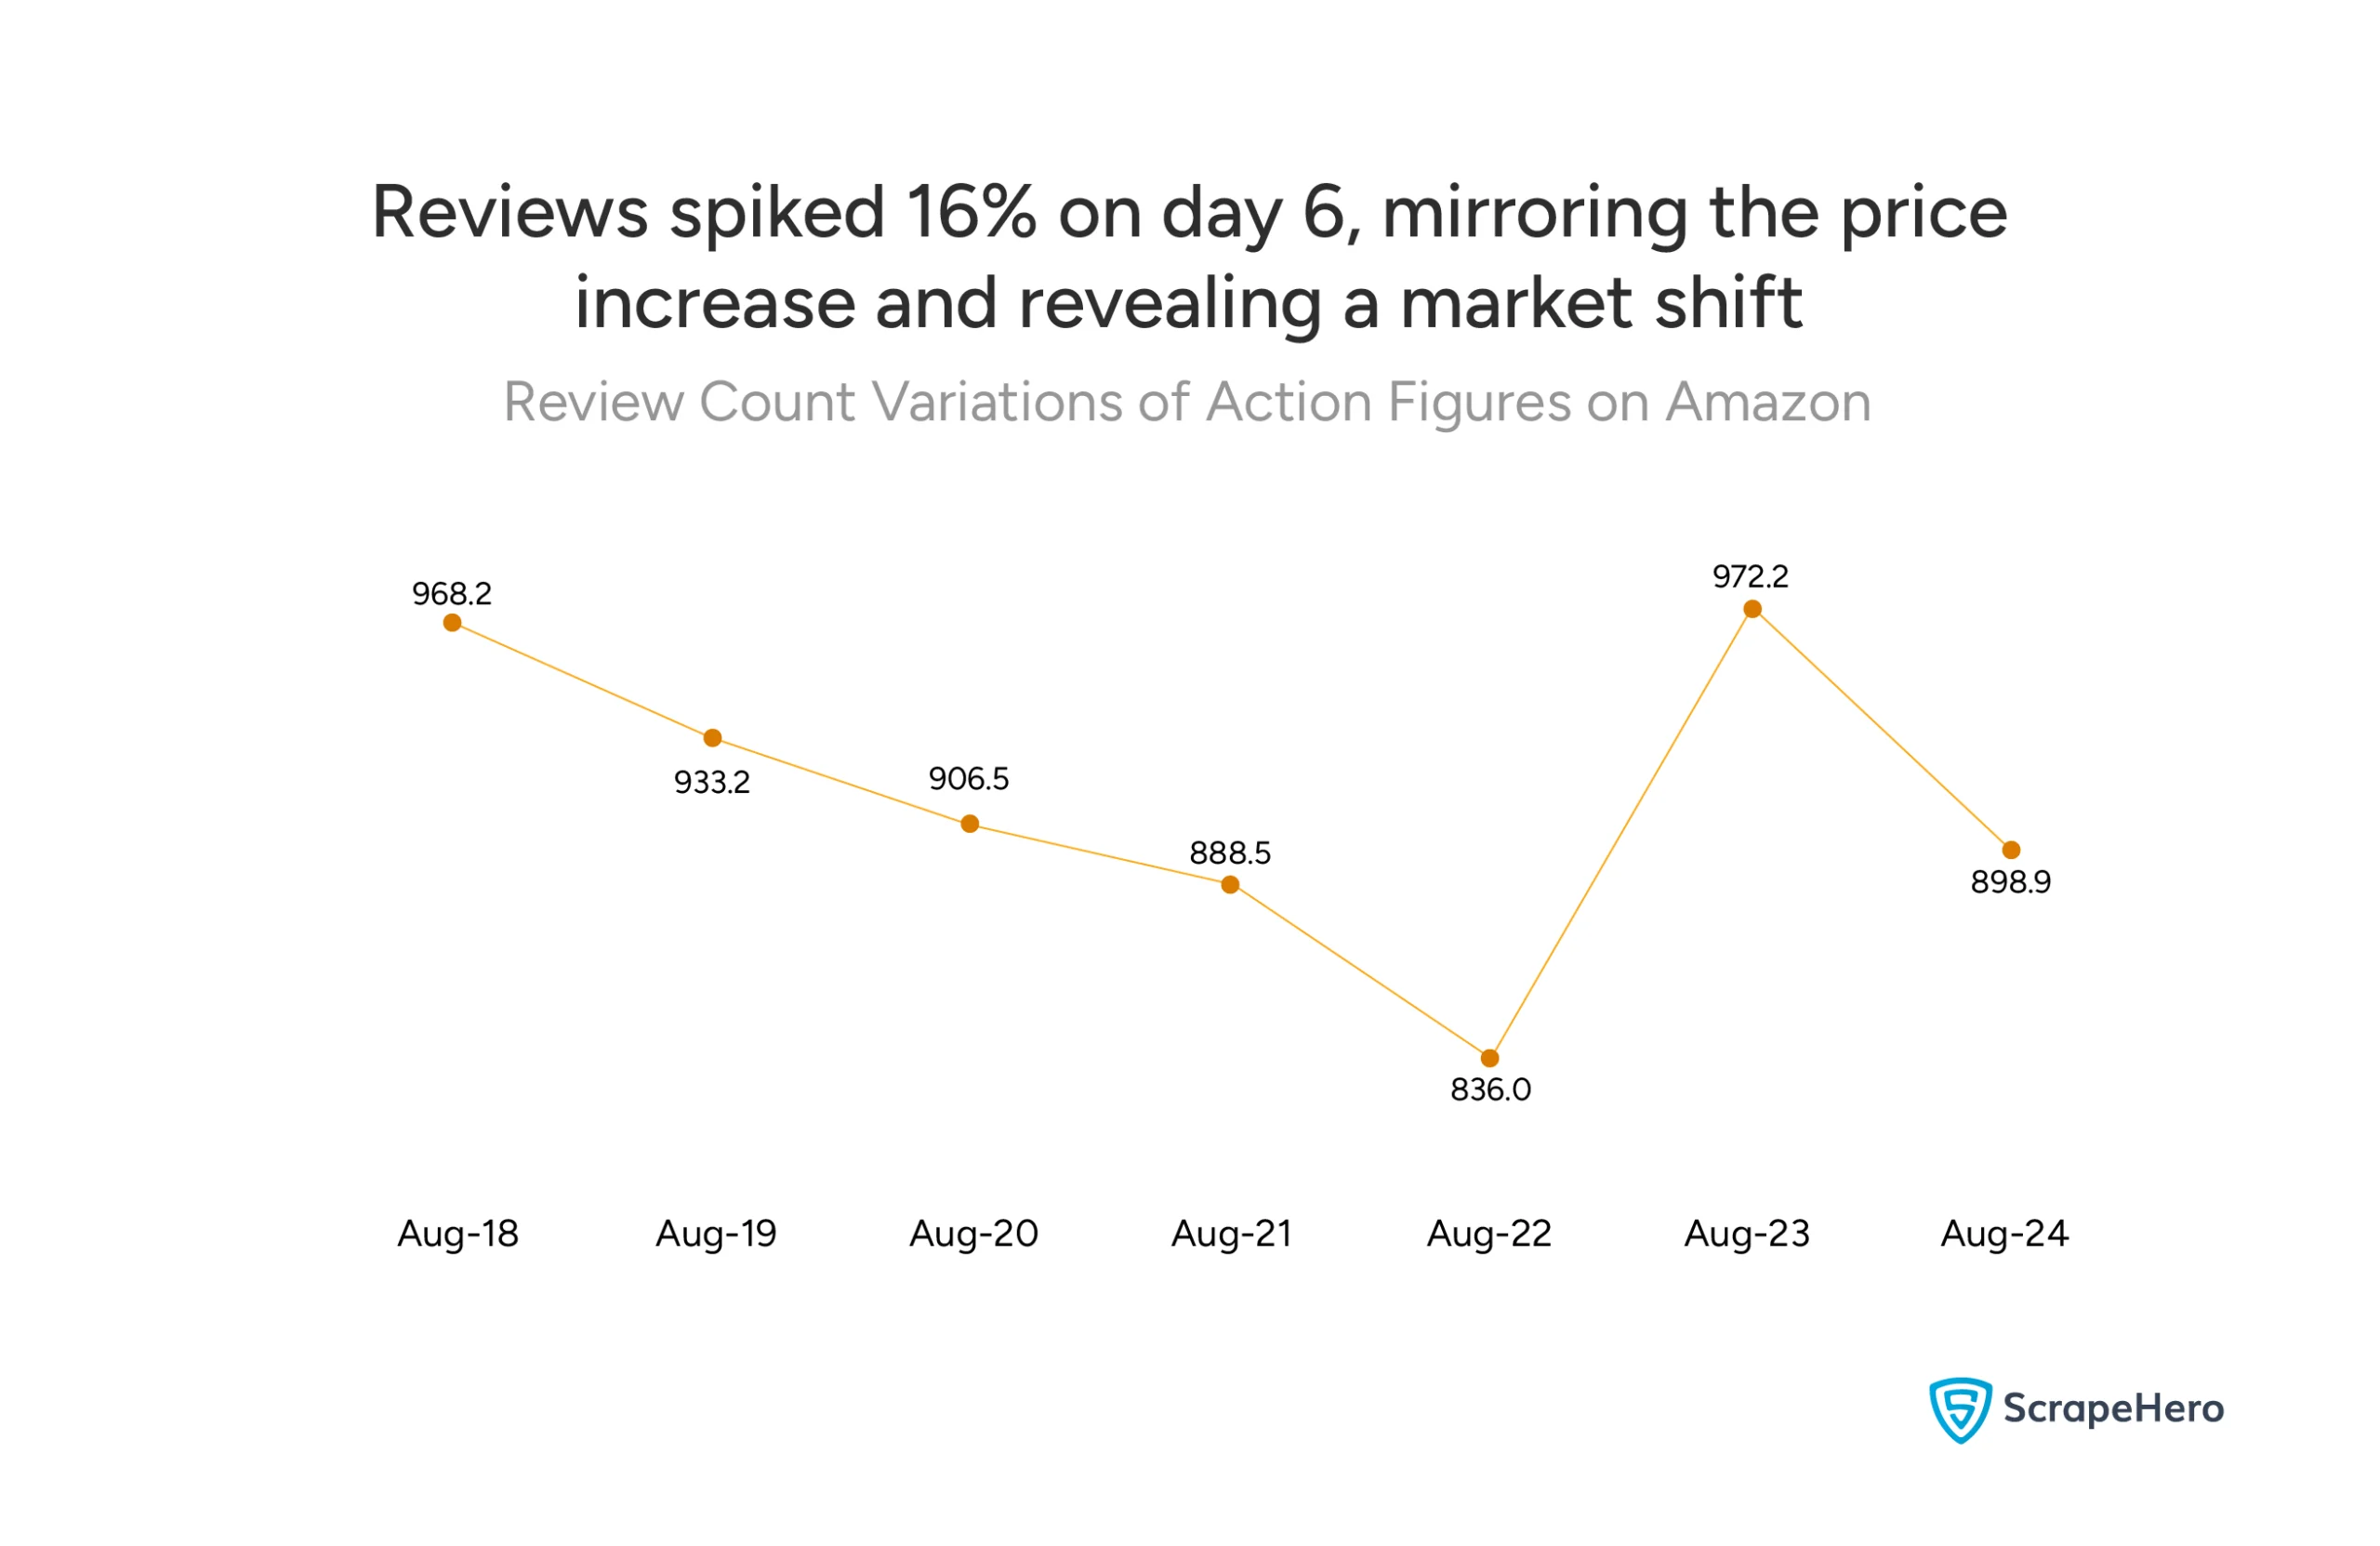
Days 1-5 showed steady decline:
- Day 1: 968.2 reviews
- Day 2: 933.2 reviews
- Day 3: 906.5 reviews
- Day 4: 888.5 reviews
- Day 5: 836.0 reviews (lowest point)
Review counts dropped 13.7% over five days. Products were selling through, getting delisted, or losing visibility in search.
Day 6 reversed everything:
- Day 6: 972.2 reviews
- Jump from 836.0 to 972.2
- 16% increase in 24 hours
Day 7 showed correction:
- Day 7: 898.9 reviews
- Retreated but remained above Day 5 low
- Similar pattern to price correction
Now let’s connect the dots from both charts:
Day 6 saw three simultaneous shifts:
- Price jumped 19% (from $40.9 to $48.7)
- Reviews spiked 16% (from 836.0 to 972.2)
This parallel movement is unusual. Typically, you’d expect price increases to dampen consumer engagement, not amplify it.
Logic suggests that when prices increase 19%, consumer engagement should drop. People buy less when things cost more.
But review counts increased 16% alongside the price spike. This could mean:
- The products being shown to consumers changed
- Higher-priced items weren’t discouraging purchases
- Product quality (reflected in reviews) matters more than price alone
Key Takeaways from Our Amazon Action Figure Market Analysis
This Amazon action figure market analysis tracked 1,241 products over seven days. The data shows a market that’s bigger and moves faster than you’d expect from the outside.
Critical Findings
- Marvel and DC own consumer attention, but there’s room for others
Marvel leads with 1,235K reviews across 123 products averaging $31. DC Comics has 965K reviews. Together, they represent most of the consumer engagement in this category.
But other brands succeed too. DRAGON STARS SERIES has 441K reviews. TAMASHII NATIONS averages $72 per product and maintains 277K reviews.
- Amazon.com has distribution locked down, but good third-party sellers still win
Amazon.com lists 435 products at a $37 average. That’s 35% of everything we analyzed. They have 3,271K reviews. No other seller comes close on volume.
E&G Partners shows what’s possible for third-party sellers: just 16 products but 435K reviews. That’s the second-highest review count among all sellers.
- This market moves fast
Day 6 showed how quickly things change. Prices jumped 19% in one day. Reviews increased 16% at the same time. Both moved up together, which isn’t what you’d normally expect.
Usually when prices go up, engagement drops. But Day 6 broke that pattern. Something changed in what products were visible or available, and both metrics shifted together.
How to Get the Data for an Analysis Effortlessly?
The most effortless way to get data for an analysis is to outsource to a web scraping service like ScrapeHero.
ScrapeHero Cloud’s scrapers are a go-to for small data requirements because of their ease of use.
However, outsourcing with ScrapeHero’s web scraping service is the smarter choice if you require custom data extraction, complex web navigation, or simply want to save time.
We are among the top 3 web scraping service providers globally. And since we are a full-service data provider that handles everything, including data collection, accuracy, and delivery, you don’t need software, hardware, or scraping expertise. Instead, you can focus on using data for your business, not extracting it.
Connect with ScrapeHero today.
Report by ScrapeHero using publicly available data. This report is independent and not affiliated with any action figure brands.
FAQ
You can analyze Amazon action figure market data by tracking key metrics like product counts, pricing, reviews, and seller distribution. In our analysis, we used ScrapeHero Cloud’s Amazon Search Results scraper to collect data on 1,241 products across 282 brands over a 7-day period.
The essential metrics to track include:
1. Average pricing across brands and sellers
2. Review counts and ratings for consumer engagement
3. Product availability and seller distribution
4. Daily price fluctuations and trends
This approach gives you a complete picture of market dynamics without relying on Amazon’s limited seller dashboard data.
Based on our Amazon action figure market analysis, the category includes:
1. 1,241 products analyzed (from 12,000 total available units)
2. 282 distinct brands
3. 576 active sellers
4. 7 million total reviews
5. $43.67 average price point
The market shows strong consumer engagement with a 4.6 average rating across products. With 7 million reviews, this represents substantial buying activity and an established marketplace. The 282 competing brands indicate a mature, competitive category with both major franchises and niche players.
Marvel leads all brands with 1,235K reviews, followed by DC Comics with 965K reviews. Among specific product lines, Wonder Woman and Dragon Ball Super Hero action figures generate the highest review counts.
The top reviewed brands are:
1. Marvel: 1,235K reviews
2. DC Comics: 965K reviews
3. Avengers: 465K reviews
4. Mattel: 447K reviews
5. DRAGON STARS SERIES: 441K reviews
Review count indicates both sales volume and customer engagement. Marvel’s lead reflects their combination of high product count (123 products) and affordable pricing ($31 average), making their figures accessible to casual buyers and collectors alike.
Marvel and Mattel dominate by product volume, while Marvel and DC Comics lead in consumer engagement.
By product count:
1. Marvel: 123 products
2.nMattel: 117 products
3. McFarlane Toys: 69 products
By review engagement:
1. Marvel: 1,235K reviews
2. DC Comics: 965K reviews
3. Avengers: 465K reviews
Marvel wins on both metrics, combining volume with customer trust. Their $31 average price point makes them accessible while maintaining quality that generates positive reviews.
While we tracked reviews rather than direct sales, review count strongly correlates with sales volume. Marvel leads with 1,235K reviews, indicating the highest sales velocity. DC Comics follows with 965K reviews.
However, “best-selling” depends on your definition:
1. Highest volume: Marvel (123 products, 1,235K reviews)
2. Best conversion: E&G Partners (16 products, 435K reviews—highest review-per-product ratio)
3. Premium segment: TAMASHII NATIONS ($72 average, 277K reviews)
Marvel wins the mass market. Premium brands like TAMASHII NATIONS win the collector segment. Both strategies succeed—they just target different buyers.
Not very stable. Our analysis showed prices fluctuated between $40.9 and $48.7 over seven days—a 19% range.
The most dramatic movement happened on Day 6, when prices jumped 19% overnight from $40.9 to $48.7. This wasn’t a gradual drift—something in the market shifted quickly, likely related to product availability or visibility changes.
Price movements of $1-$2 per day are normal. But the Day 6 spike shows this market can restructure in 24 hours. If you’re managing inventory or setting competitive prices, daily monitoring matters more than weekly checks.
Yes, but not on volume. Amazon.com lists 435 products with 3,271K reviews. No third-party seller comes close to that scale.
However, E&G Partners shows what’s possible: just 16 products generated 435K reviews—the second-highest review count among all sellers. That’s a higher review-per-product ratio than Amazon itself.
Third-party success requires:
1. Better pricing than Amazon’s $37 average (like E&G Partners at $22)
2. Premium products Amazon doesn’t stock (like D & R Lineups at $136 average)
3. Exceptional customer service that drives review velocity
You can’t beat Amazon on volume. But you can win on execution, product selection, or premium positioning.