The coffee shop industry in the US is a dynamic and significant sector, deeply embedded in the daily routines of millions of Americans. This coffee shop industry statistics of US report provides an in-depth look at key statistics, including consumer habits, market size, major players, geographical distribution, operational trends, and pricing.
The POI data for this analysis was downloaded from the ScrapeHero DataStore.
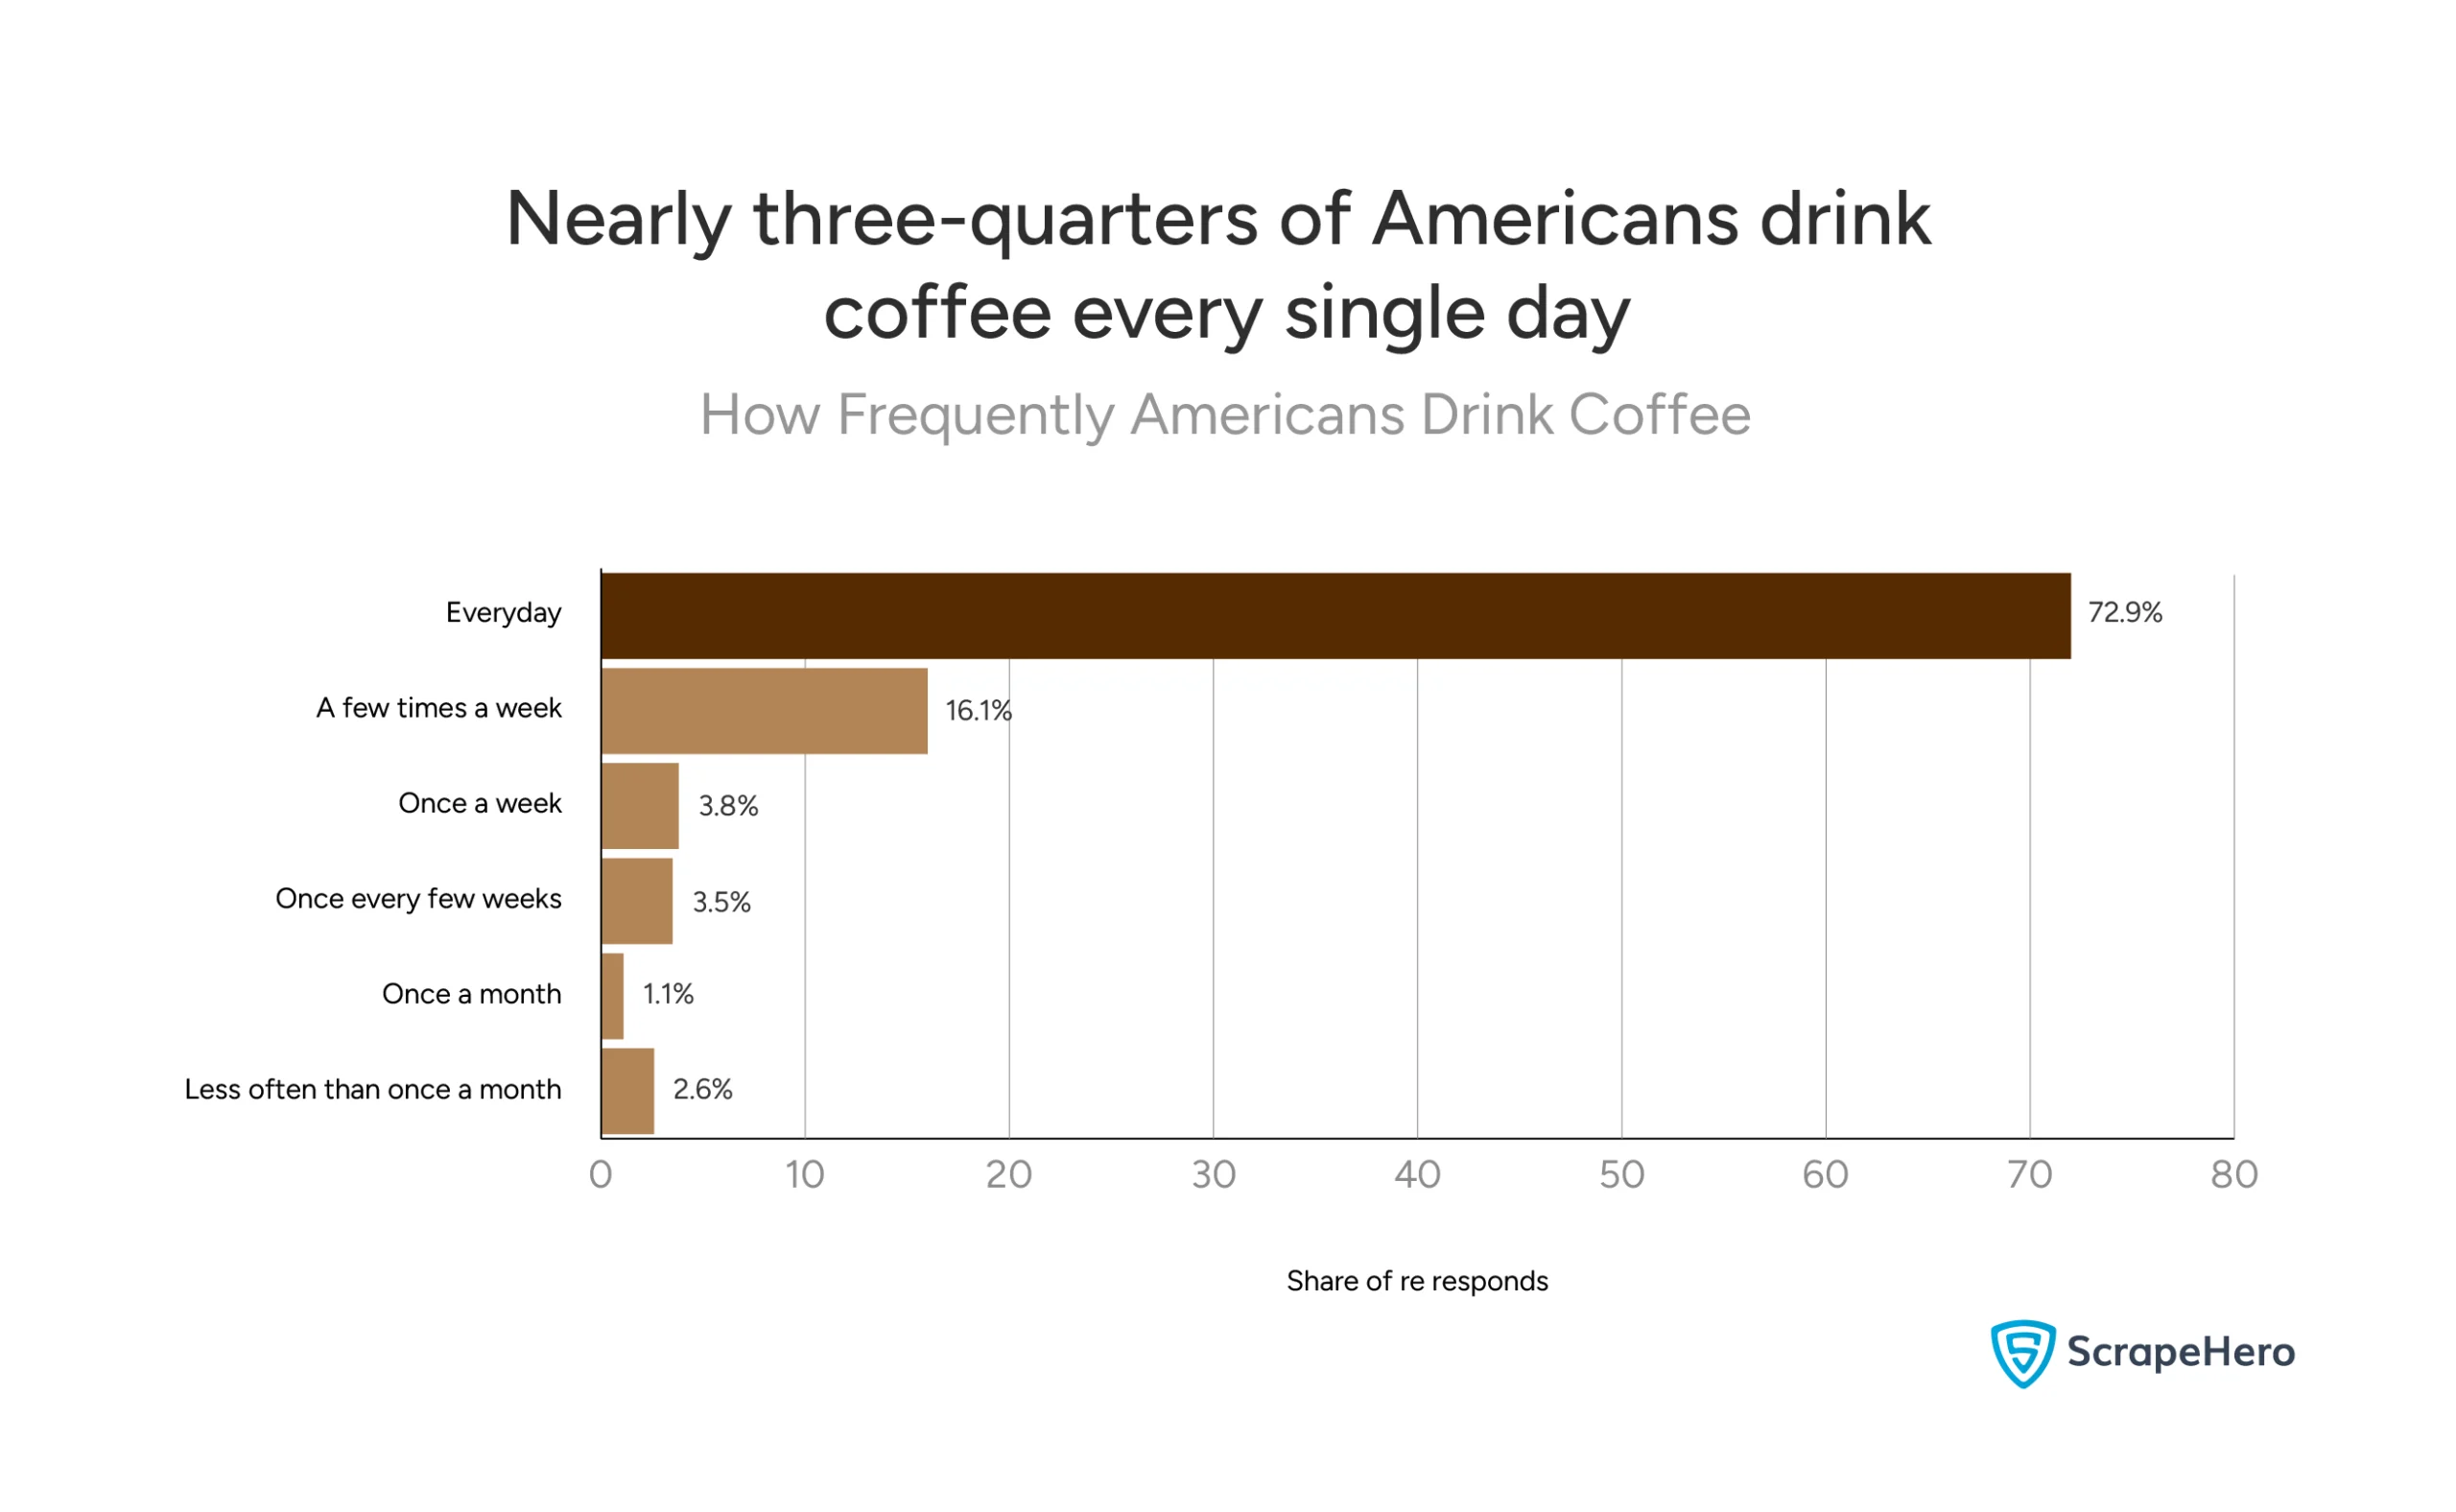
How Frequently Do Americans Engage With Coffee and What Does This Mean to the Industry?
Coffee isn’t just popular in America, it’s practically a daily ritual. This data reveals just how deeply coffee is woven into American culture and what it means for the coffee shop business.
Here’s what can be concluded from the numbers:
- 72.9% of Americans drink coffee every day – That’s nearly 3 out of 4 adults making coffee a non-negotiable part of their routine
- 16.1% drink coffee a few times a week – Adding another solid chunk of regular consumers
- Only 10.4% drink coffee infrequently – This includes those who have it once a week (3.8%), once every few weeks (3.5%), once a month (1.1%), or less than once a month (2.6%)
What This Means for the US Coffee Shop Landscape:
The data from this US Coffee Shop Market Report shows an incredibly stable customer base. When nearly 90% of Americans drink coffee at least weekly, that’s consistent demand that coffee shops can count on.
This frequency creates predictable revenue streams for the best coffee shops in the US. Daily drinkers aren’t just occasional customers, they’re repeat visitors who drive steady business throughout the week.
The small percentage of infrequent drinkers (around 10%) represents untapped potential.
Survey details: United States, January 2024, 1,325 respondents, 18 years and older
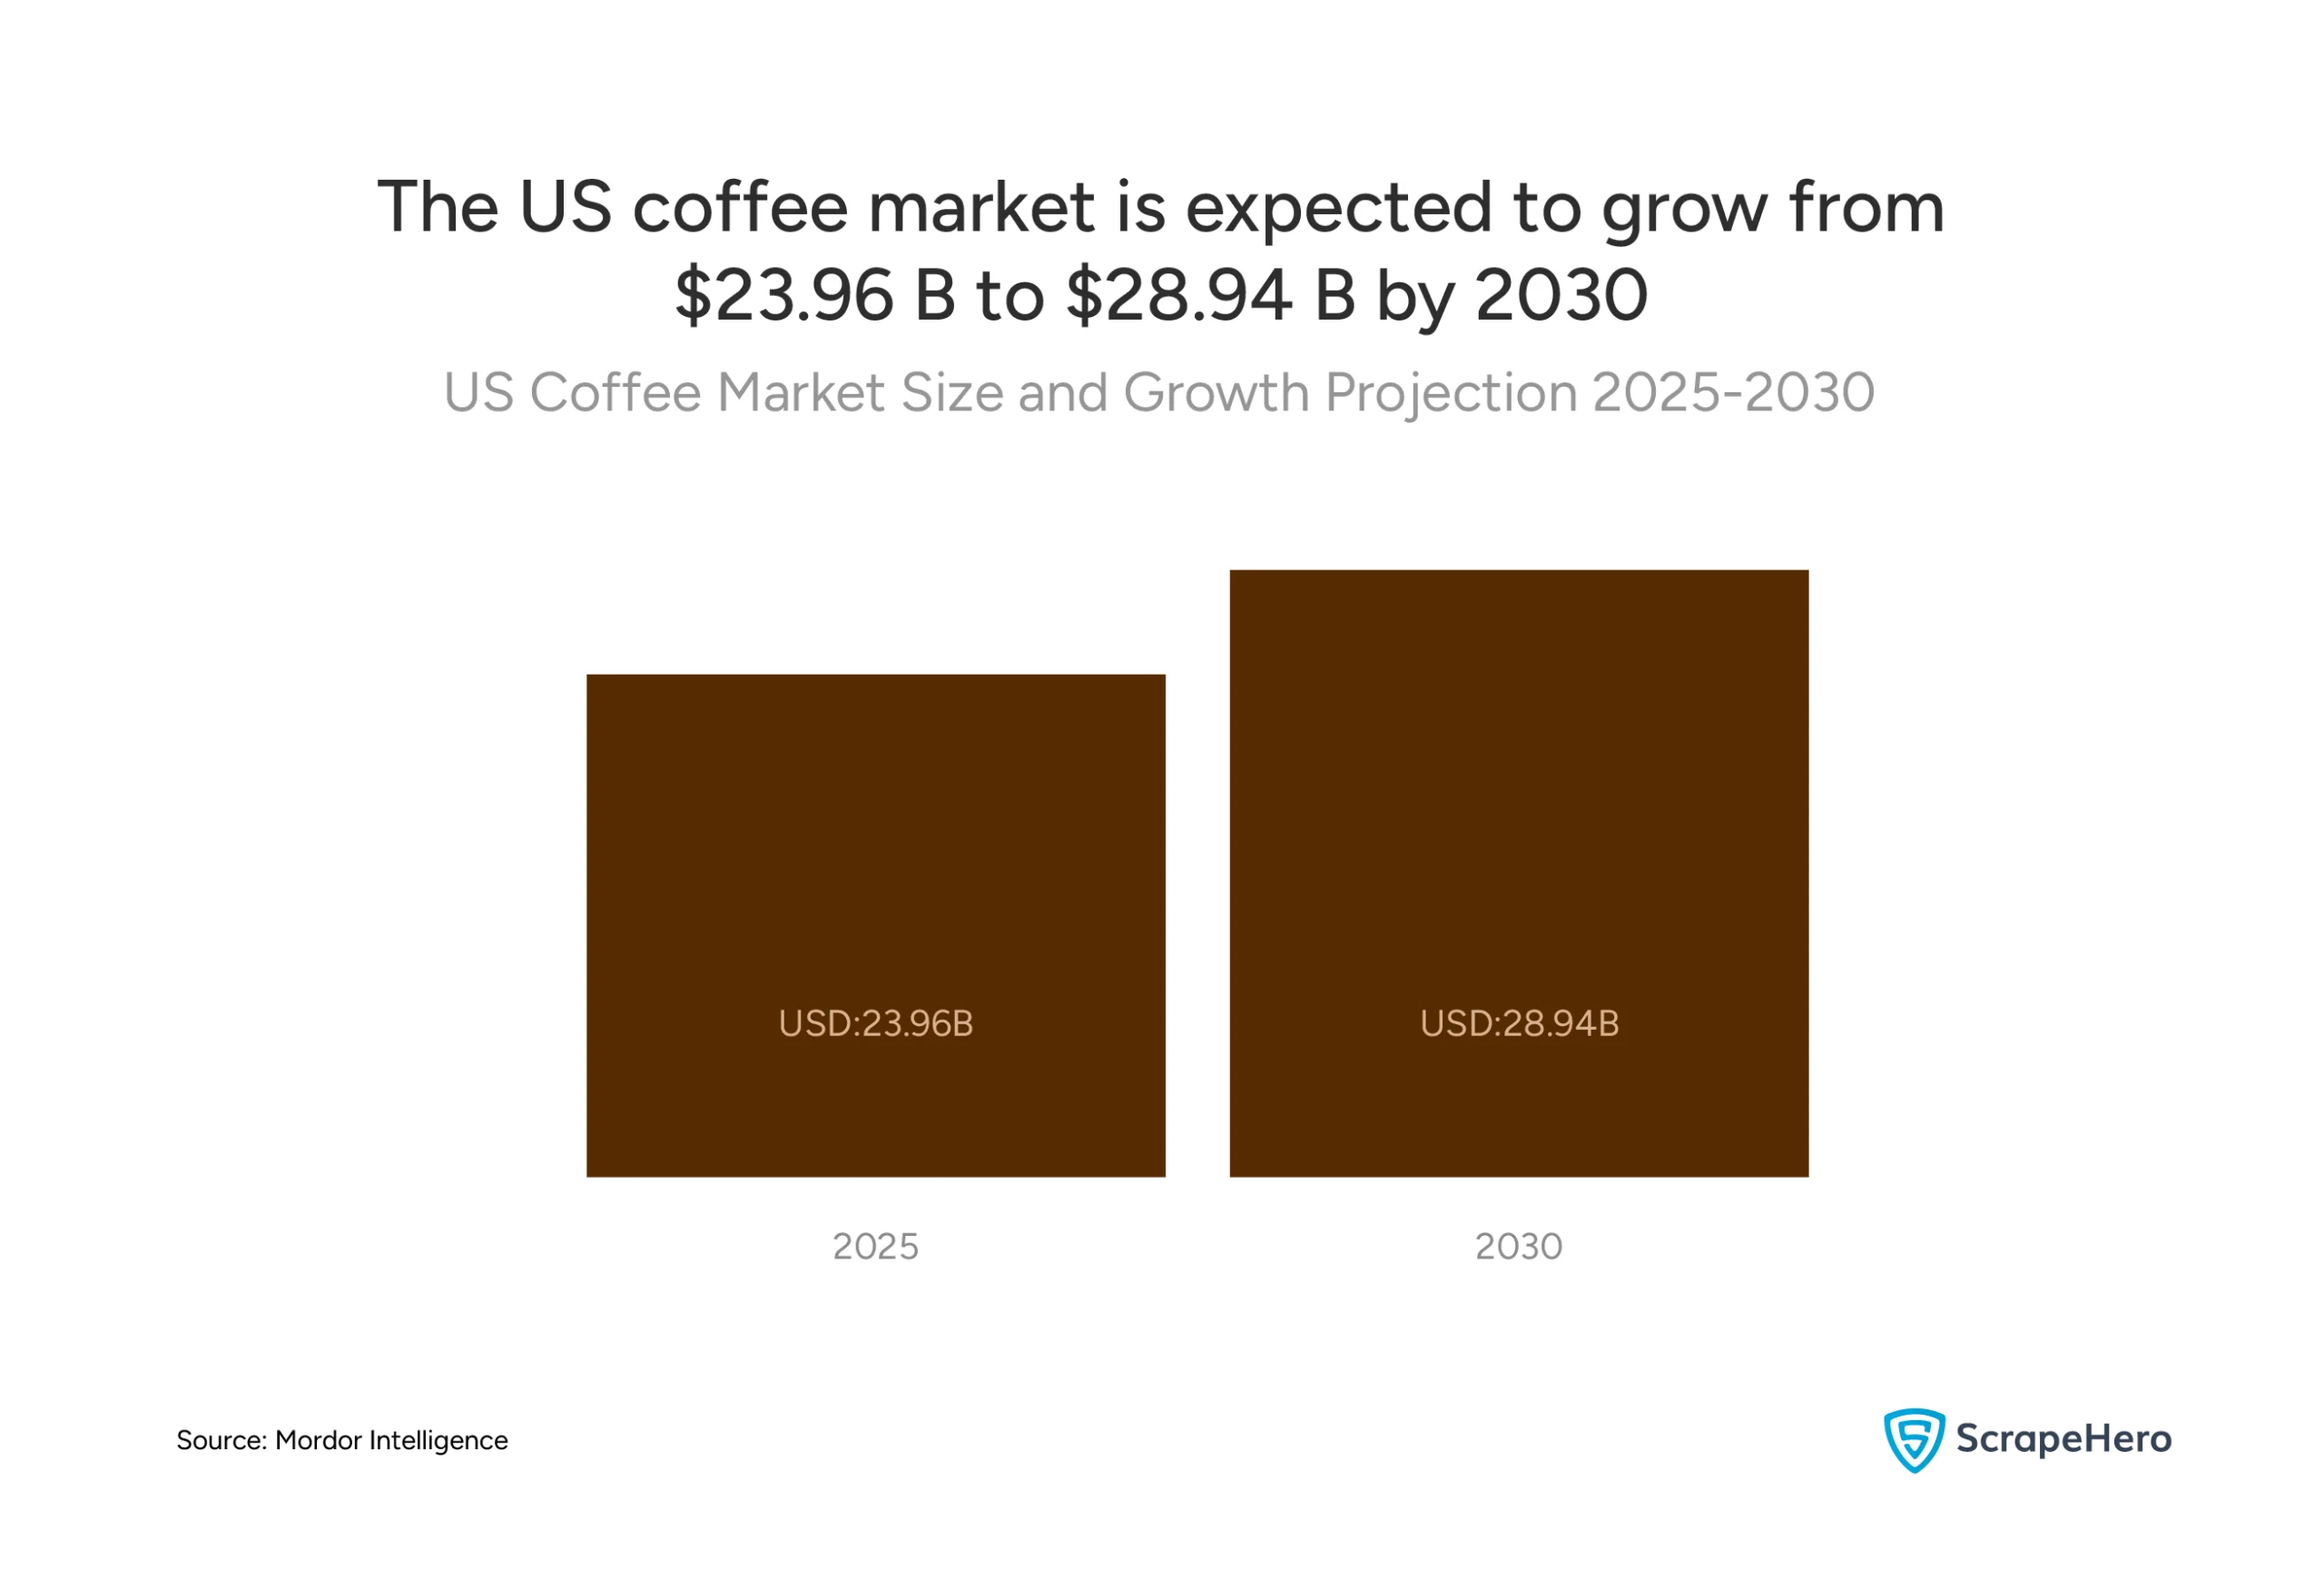
What is the Current Size and Projected Growth of the US Coffee Market?
The US coffee market is worth $23.96 billion in 2025 and will reach $28.94 billion by 2030. That’s steady, reliable growth that shows this industry isn’t slowing down anytime soon.
The Numbers Break Down Like This:
- Current market size: $23.96 billion in 2025
- Projected market size: $28.94 billion by 2030
- Total growth: $4.98 billion increase over 5 years
- Annual growth rate (CAGR): 3.85%
What This Growth Means for Coffee Shop Industry Statistics US:
For the best coffee shops in the US, this growth creates opportunities to:
- Expand into new locations with confidence
- Invest in equipment and technology upgrades
- Develop new products and services
The US coffee shop landscape benefits from this predictable growth pattern. It allows business owners to make long-term plans and secure financing based on reliable market expansion.
Source: Mordor Intelligence
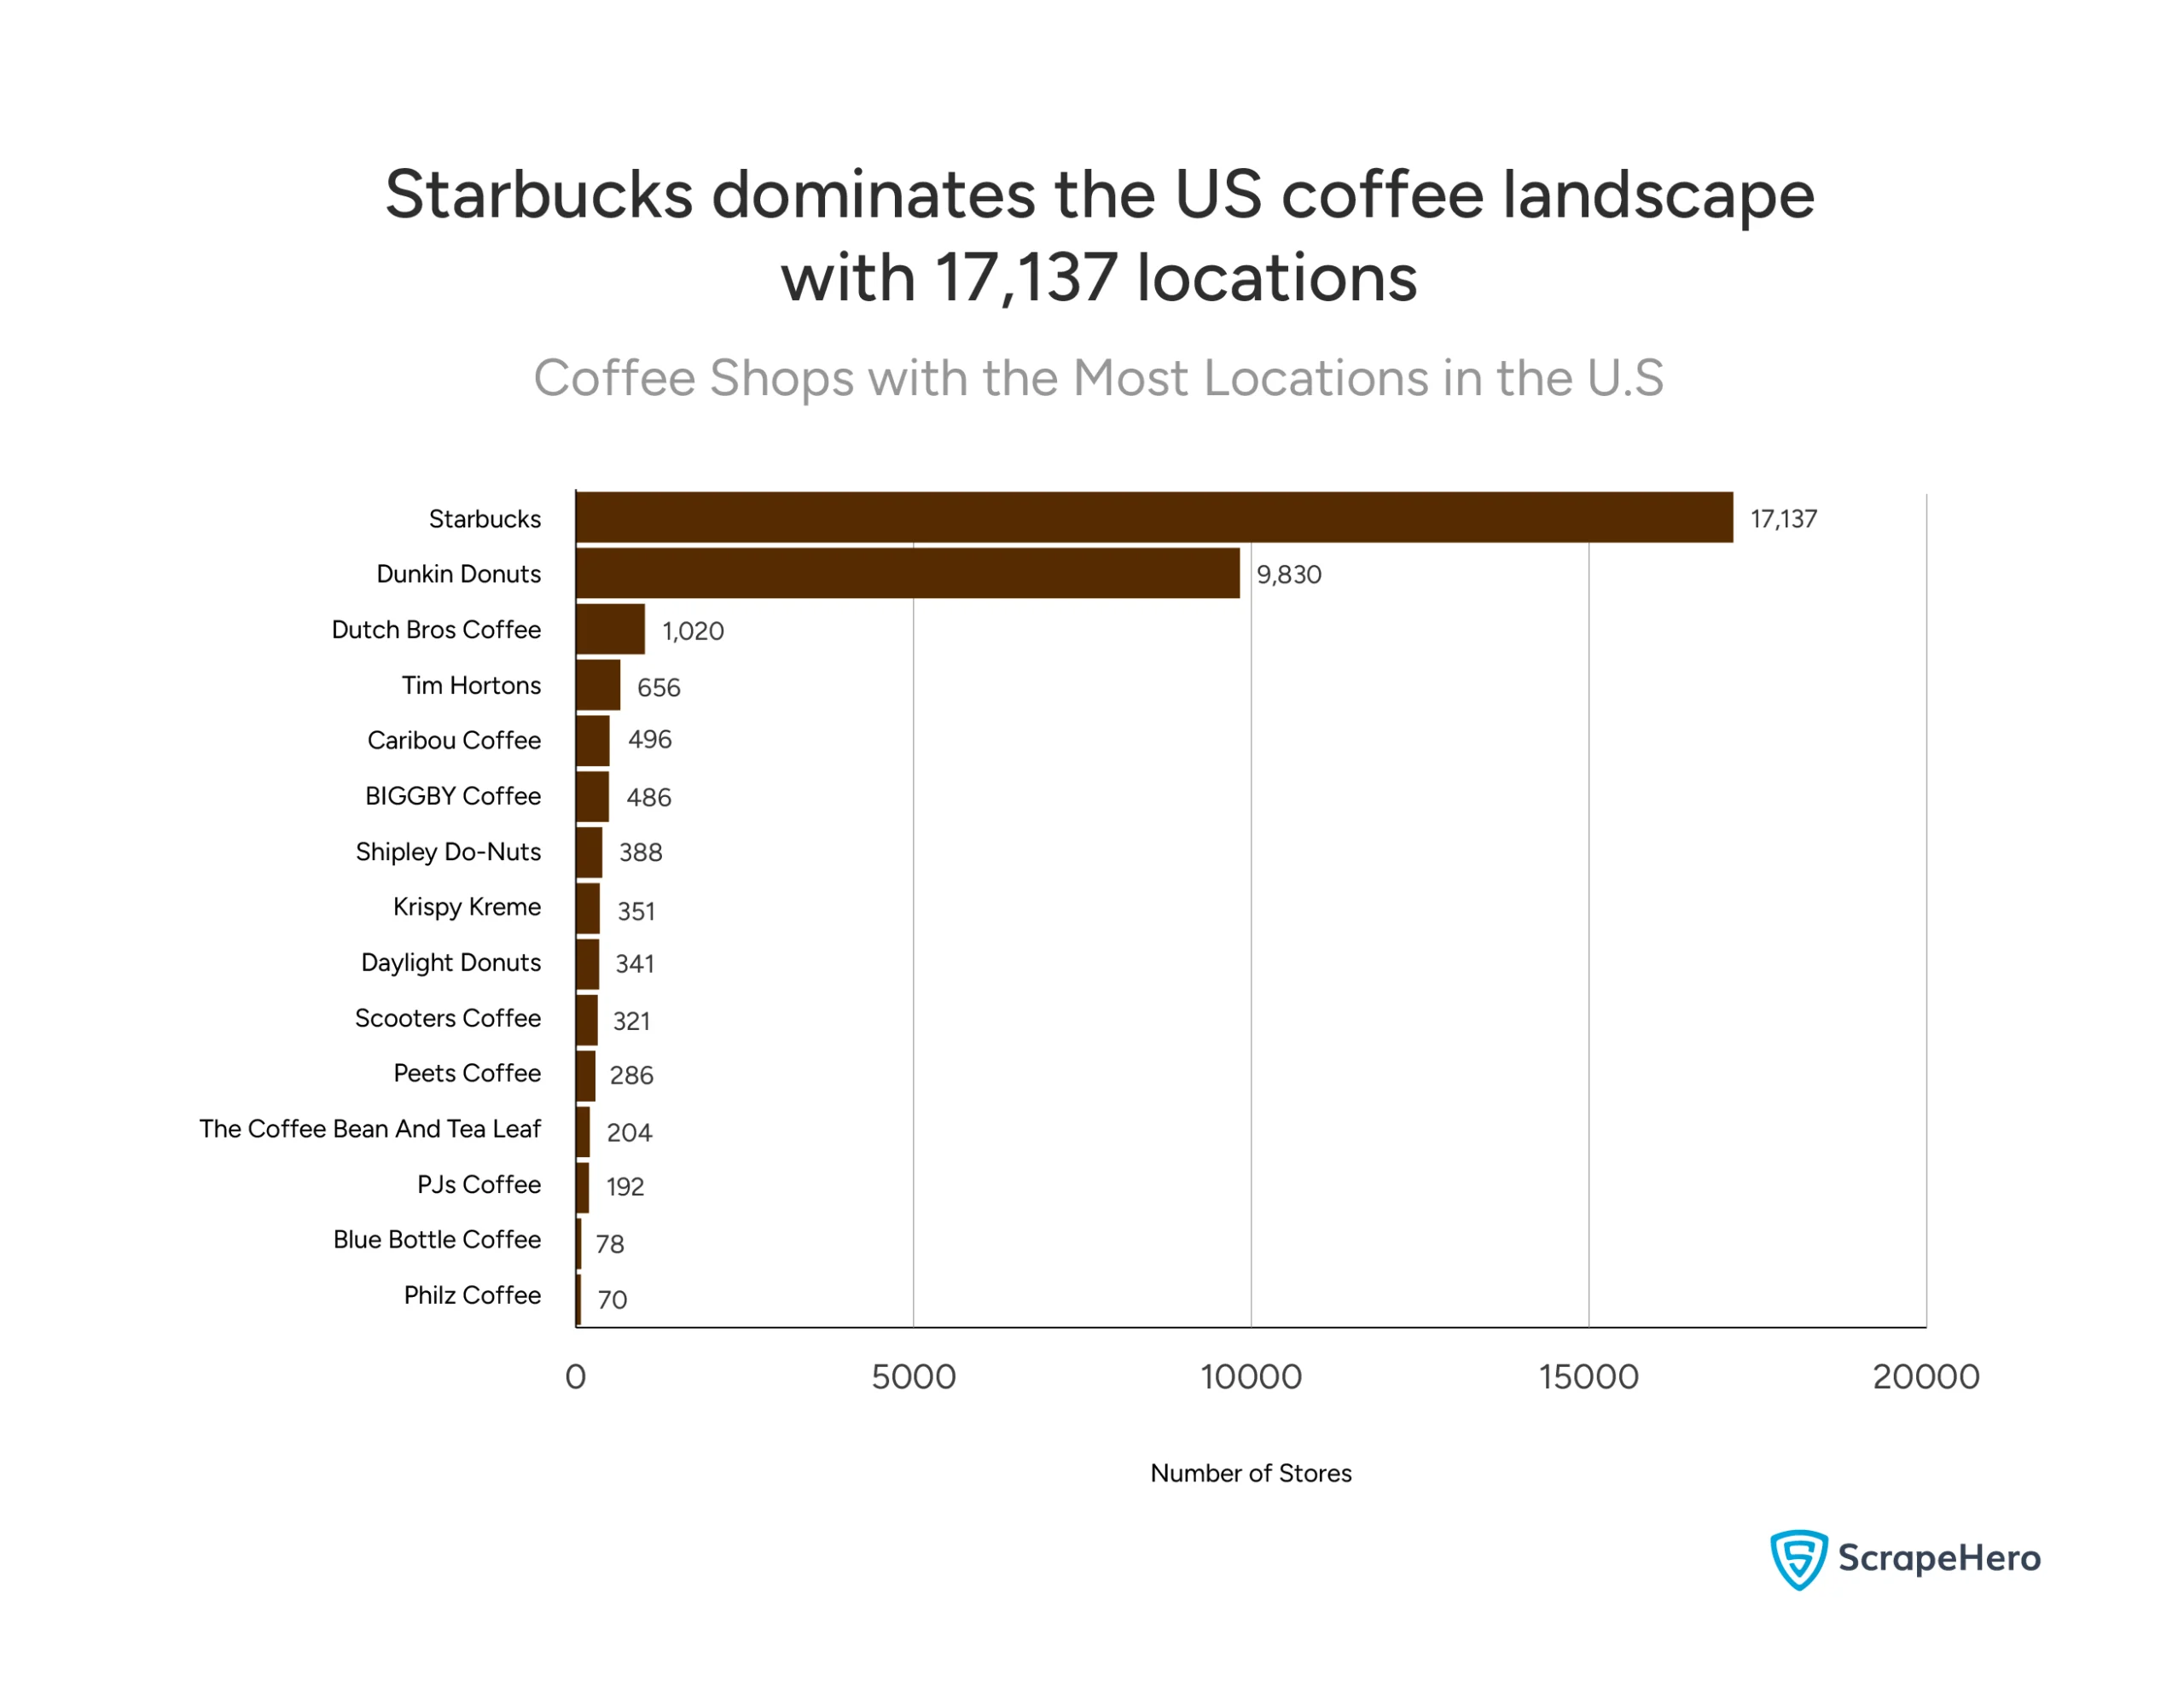
Which Major Coffee Chains Dominate the US Landscape in Terms of Locations?
Starbucks and Dunkin Donuts absolutely dominate the US coffee shop landscape in terms of locations. These two giants control the majority of major chain coffee shop real estate across America.
- Starbucks: 17,137 locations – The undisputed leader with nearly twice as many stores as its closest competitor
- Dunkin Donuts: 9,830 locations – A strong second place but still significantly behind Starbucks
- Dutch Bros Coffee: 1,020 locations
- Tim Hortons: 696 locations
- Caribou Coffee: 490 locations
- BIGGBY Coffee: 448 locations
The Smaller Players:
The remaining chains each have fewer than 400 locations, including Shipley Do-Nuts (388), Krispy Kreme (361), Daylight Donuts (341), Scooters Coffee (321), Peets Coffee (286), The Coffee Bean And Tea Leaf (204), PJ’s Coffee (192), Blue Bottle Coffee (76), and Philz Coffee (70).
Want the complete list of all Starbucks store locations in the US for easy download?
This US coffee shop market report shows just how concentrated market leadership is. Starbucks has achieved unparalleled scale that would give them significant advantages in purchasing power, brand recognition, and market penetration.
Consumers looking for the best coffee shops in the US will find Starbucks and Dunkin practically everywhere. The massive gap between the top two and everyone else shows how challenging it is to compete at a national level in the US coffee shop landscape.
How Widespread is the Presence of These Major Coffee Chains Across US States?
The presence of major coffee chains across US states varies dramatically, with only Starbucks having a national coverage.
- Starbucks: 52 states and territories – Complete national coverage including all states, DC, and US territories
- Dunkin Donuts: 45 states – Strong nationwide presence but missing from 7 states
- Krispy Kreme: 42 states – Solid national reach with presence in most states
- Daylight Donuts: 29 states
- Caribou Coffee: 20 states
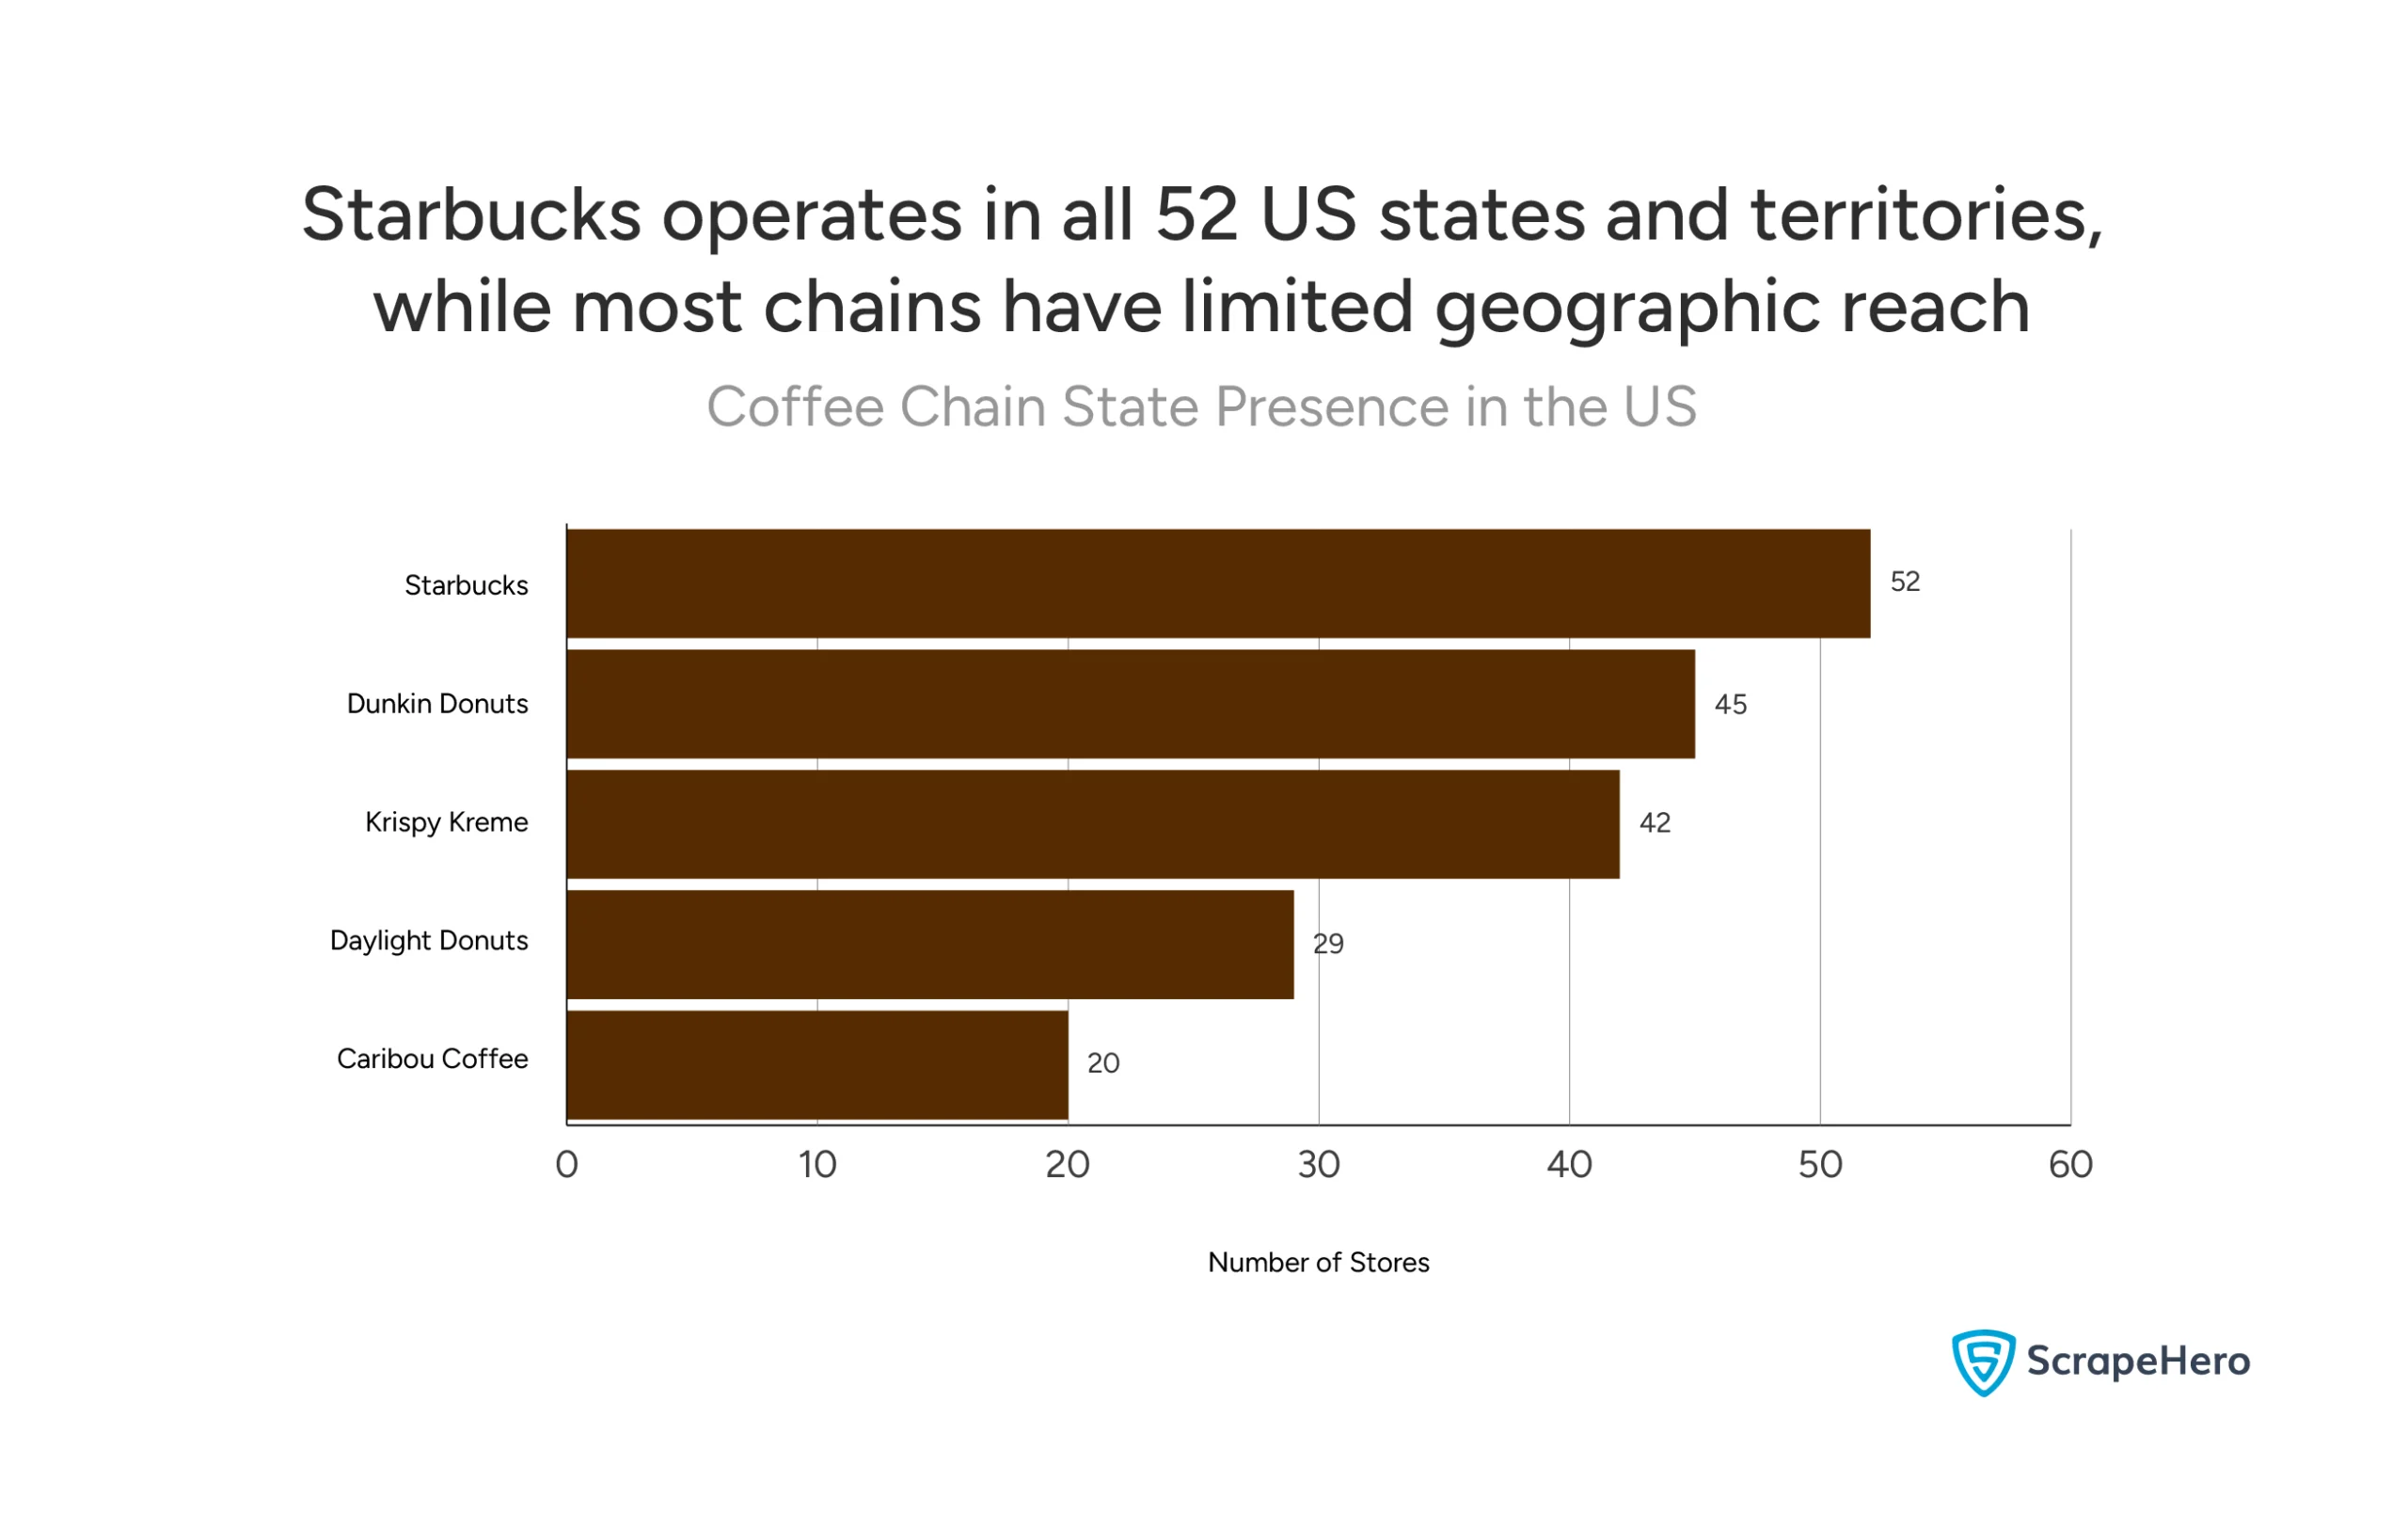
This geographic data reveals that in the US coffee shop landscape, most chains do not operate in all of the states. Even Dunkin Donuts, with nearly 10,000 locations, still hasn’t reached 7 states.
This limited geographic reach explains why local and regional coffee shops can still thrive, many areas simply don’t have access to the major national chains beyond Starbucks.
Where are Coffee Shops Most Concentrated Geographically Within the US?
Which States has the Highest Number of Coffee Shops?
California has the highest number of coffee shops in the US with 4,063 locations, followed by New York (2,507) and Texas (2,355). These three states dominate the US coffee shop landscape by number of shops.
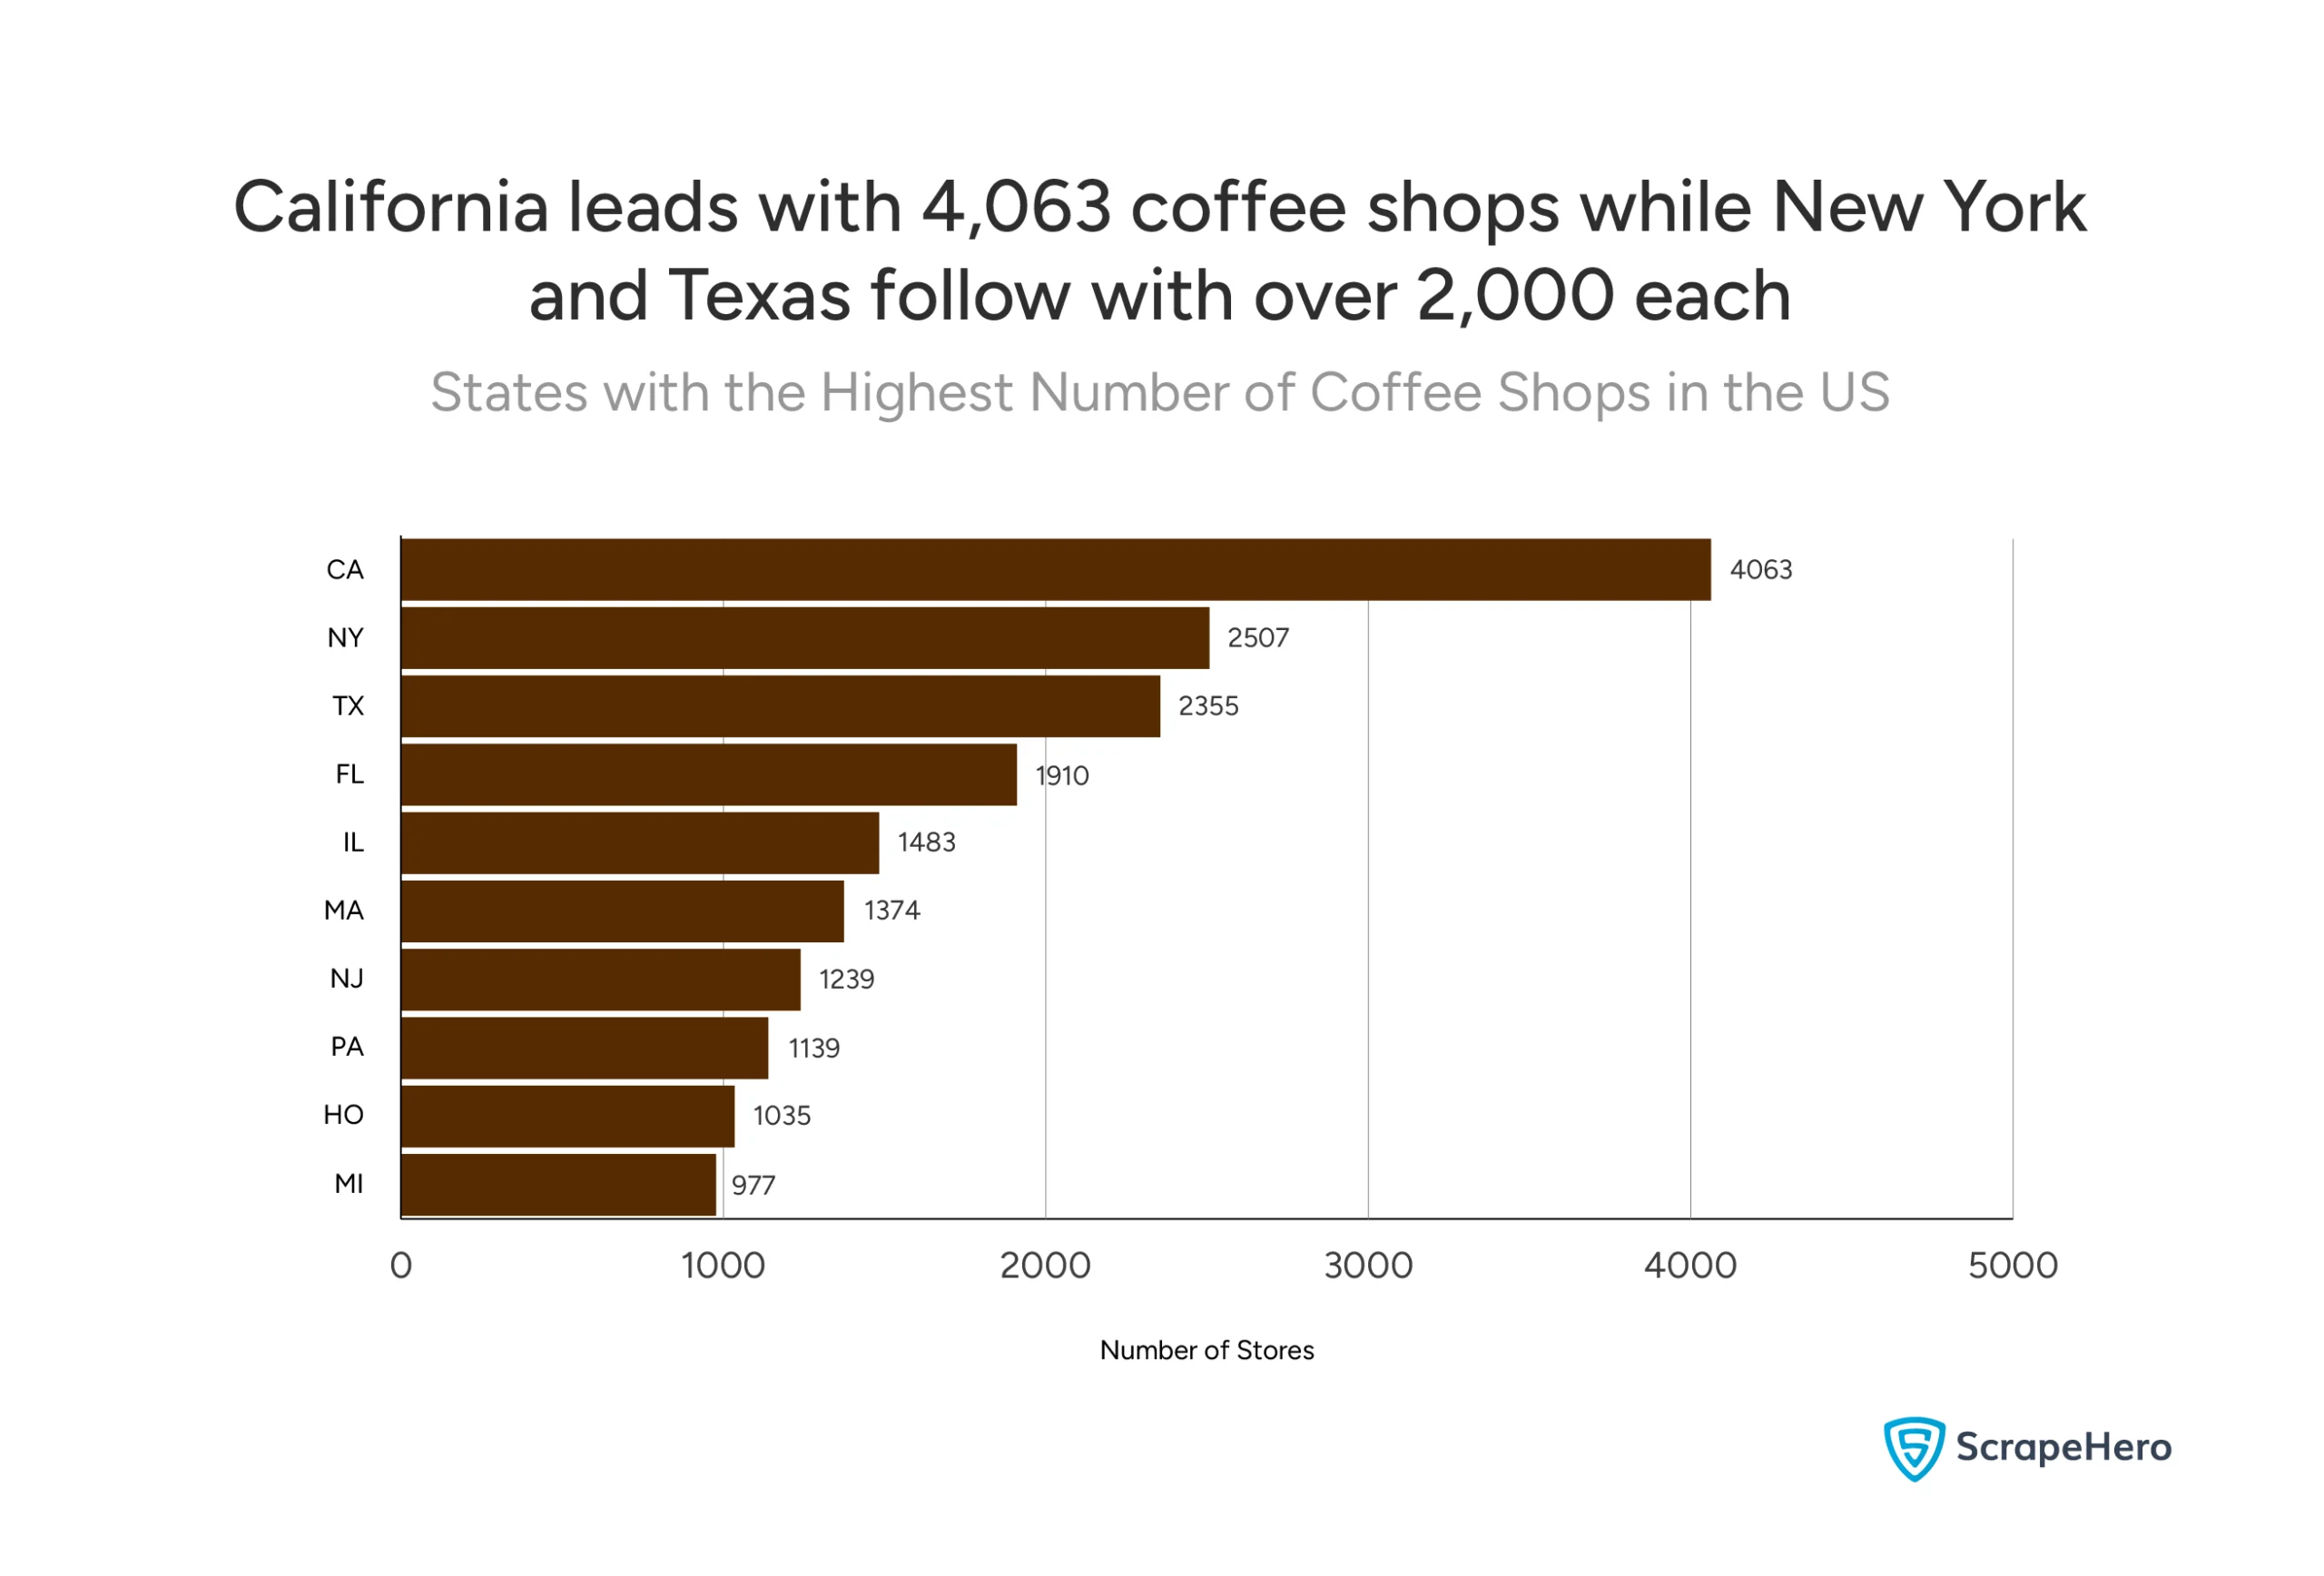
The states with the highest number of coffee shops in the US are:
- California: 4,063 locations
- New York: 2,507 locations
- Texas: 2,355 locations
- Florida: 1,910 locations
- Illinois: 1,483 locations
- Massachusetts: 1,374 locations
- New Jersey: 1,239 locations
- Pennsylvania: 1,139 locations
- Ohio: 1,035 locations
- Michigan: 977 locations
Which Major Cities are Key Hotspots for Coffee Shops?
Chicago and New York are the cities with the most coffee shops in the US. Chicago leads with 412 locations and New York close behind at 388.
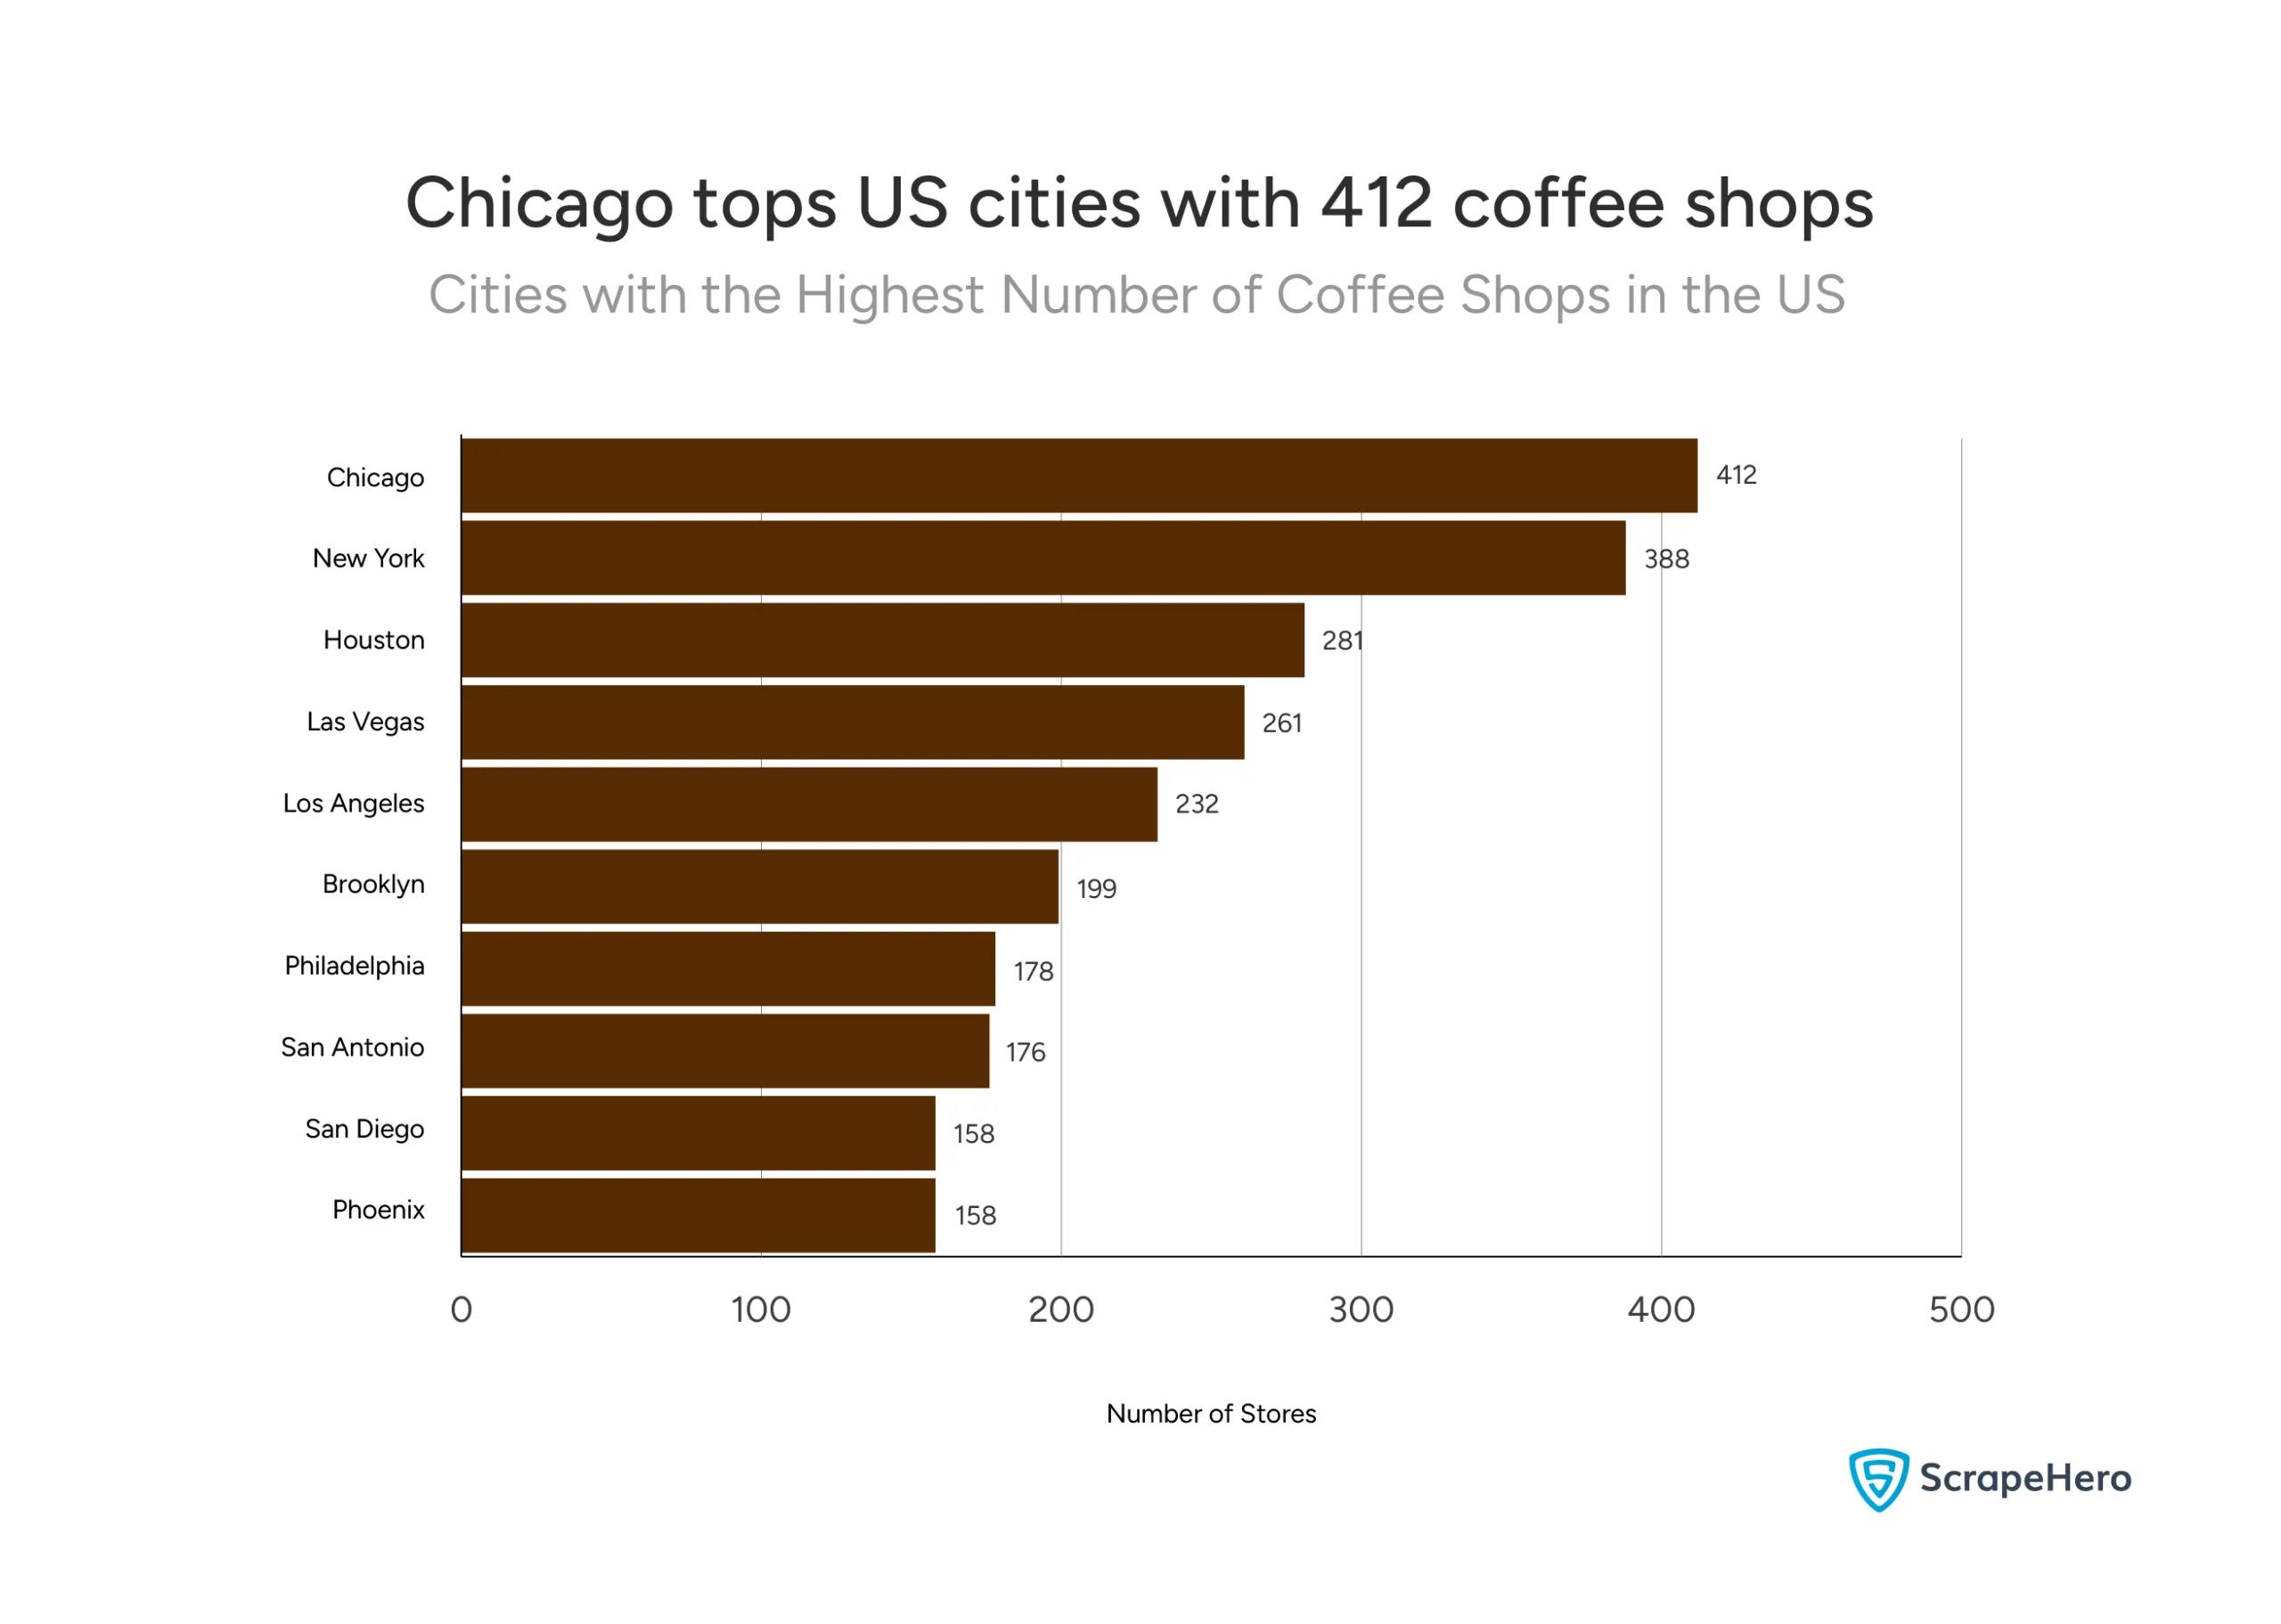
The Top Coffee Shop Cities in the US are as follows:
- Chicago: 412 locations
- New York: 388 locations
- Houston: 281 locations
- Las Vegas: 261 locations
- Los Angeles: 232 locations
- Brooklyn: 199 locations
- Philadelphia: 178 locations
- San Antonio: 176 locations
- San Diego: 158 locations
- Phoenix: 158 locations
Given Its Dominance, Where Does Starbucks Have the Most Significant Footprint?
Starbucks has its most significant footprint in California with 3,184 locations, followed by Texas (1,471) and Florida (932). These three states represent Starbucks’ primary strongholds in the American market.
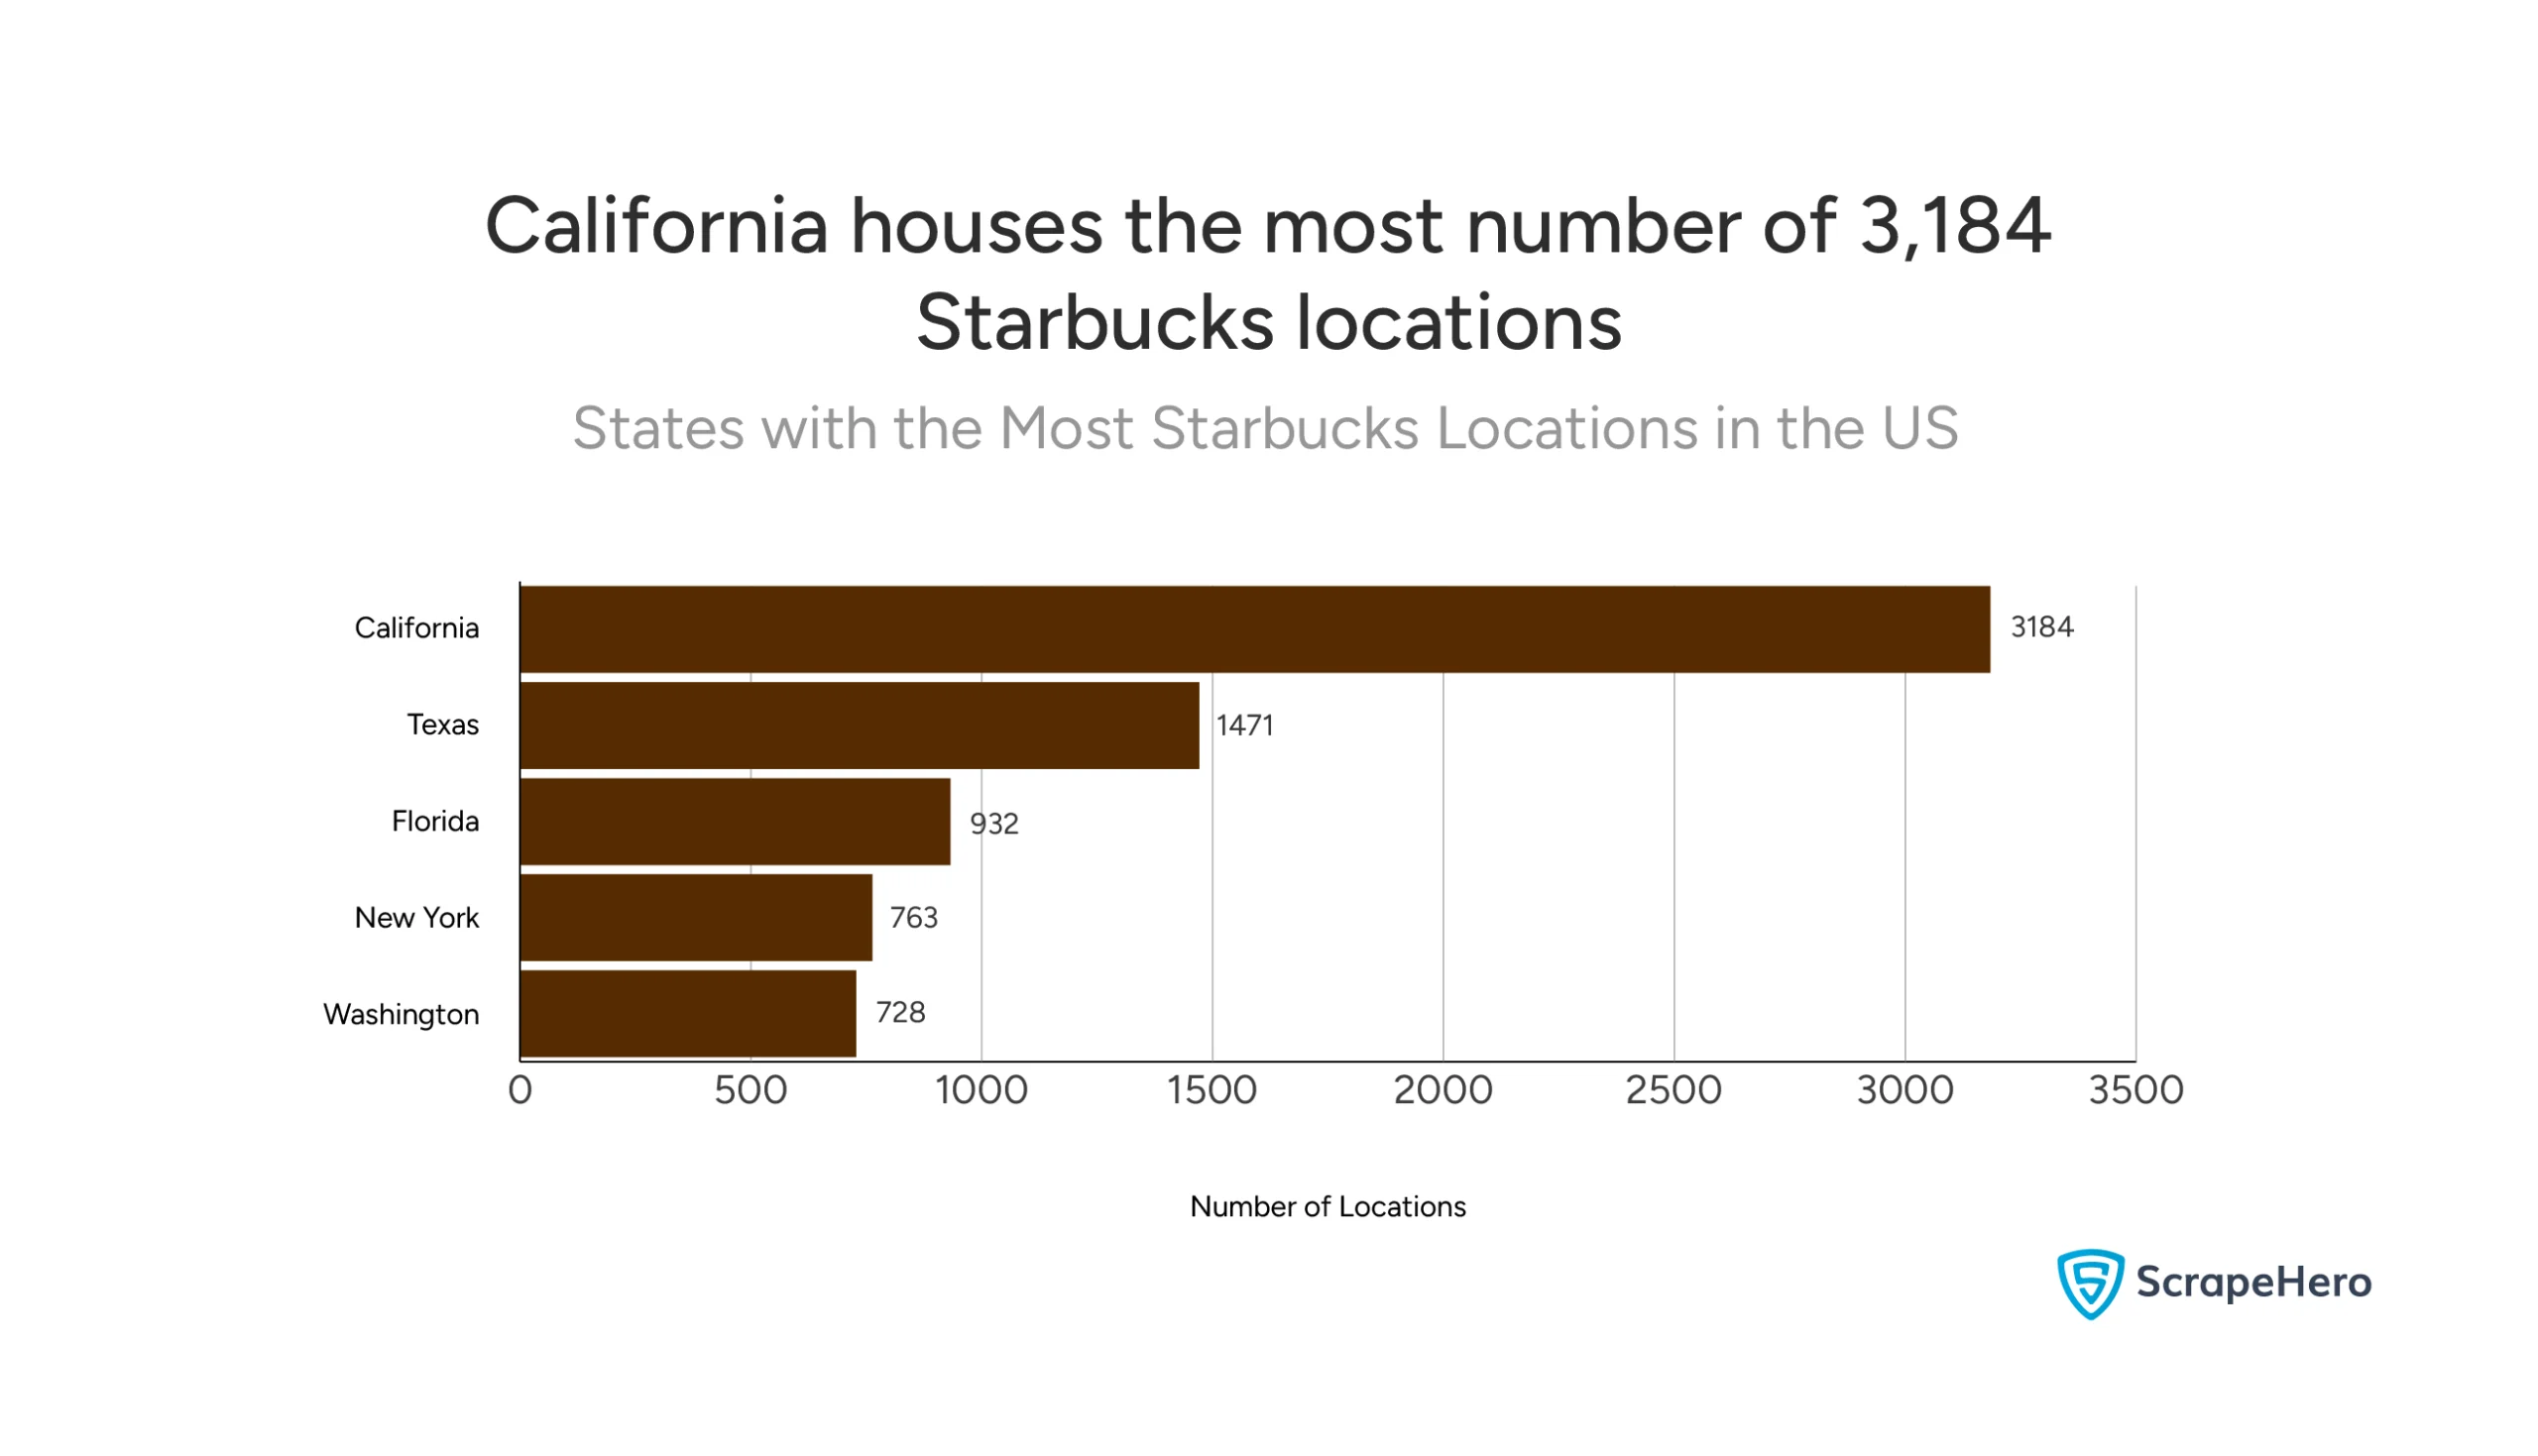
Starbucks’ Top State Markets:
- California: 3,184 locations
- Texas: 1,471 locations
- Florida: 932 locations
- New York: 763 locations
- Washington: 728 locations
How Stable is the Coffee Shop Industry in Terms of Operational Status?
The coffee shop industry is stable in terms of operational status, with the vast majority of locations open and serving customers. Out of nearly 32,000 coffee shops tracked, less than 1% face any operational challenges.
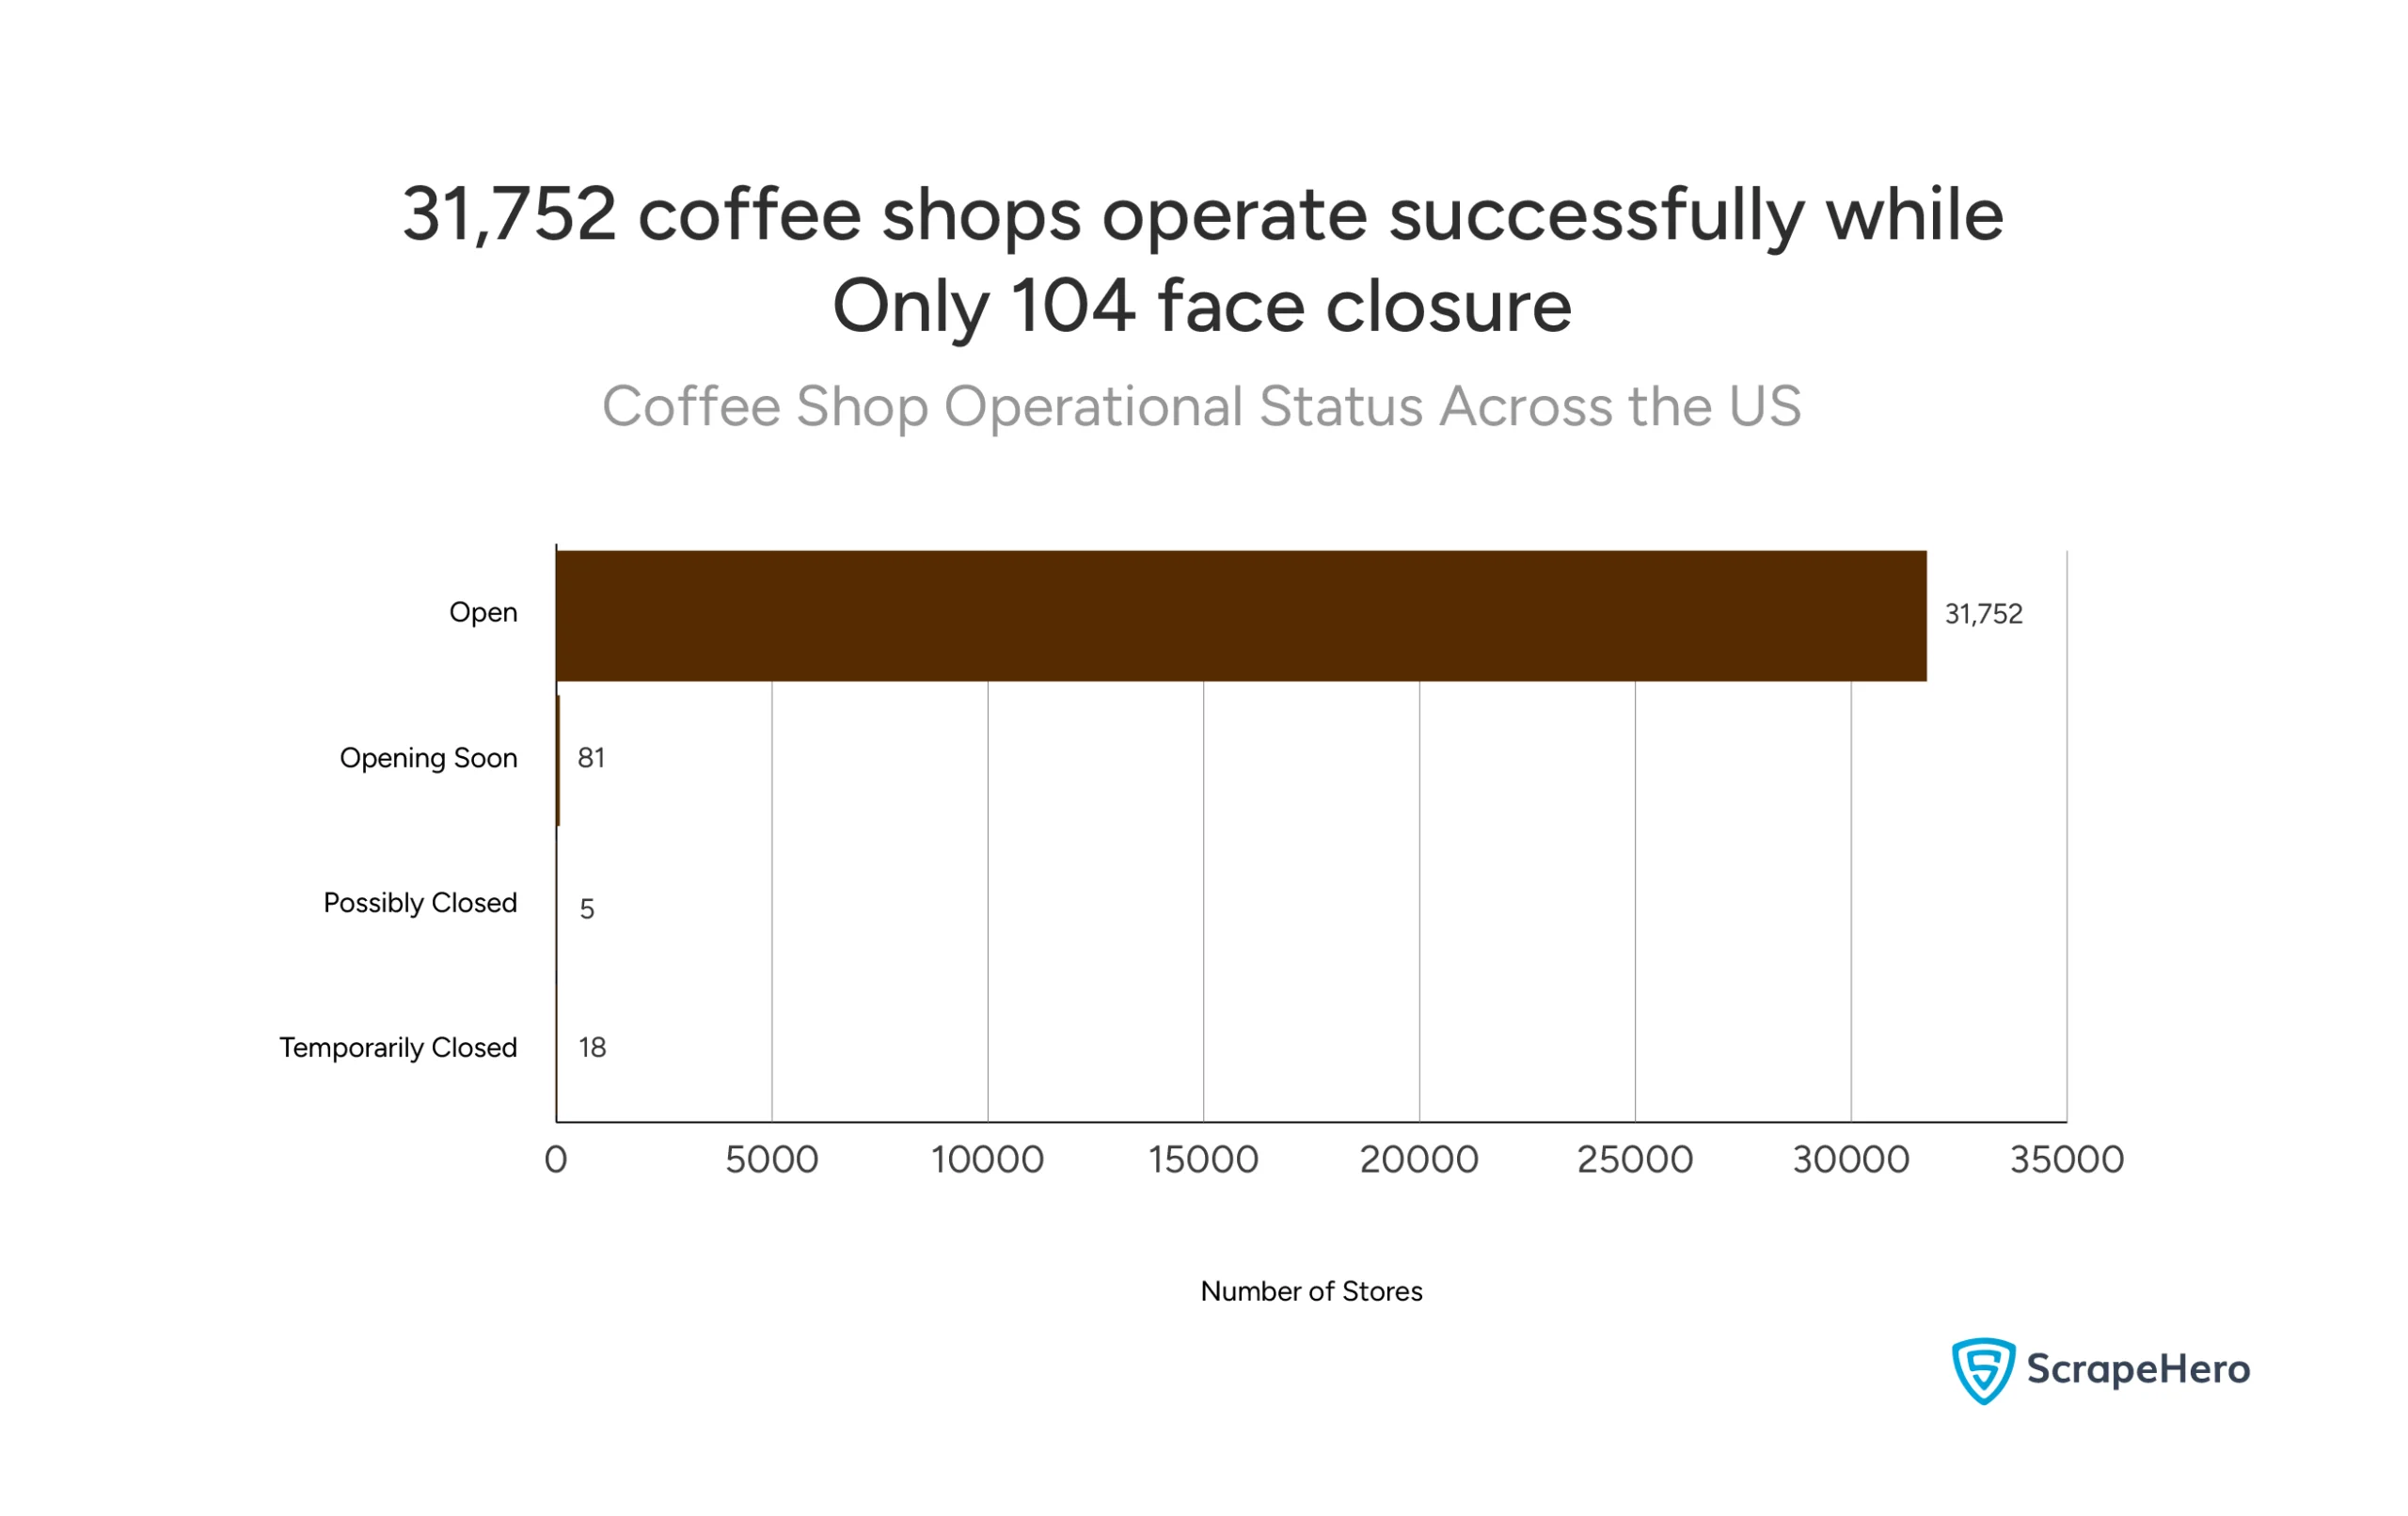
The Operational Breakdown:
- Open: 31,752 locations – Over 99% of coffee shops are actively operating
- Opening Soon: 81 locations – New stores preparing to launch
- Temporarily Closed: 18 locations – Very small number facing short-term closure
- Possibly Closed: 5 locations – Minimal number with uncertain status
These coffee shop industry statistics US reveal a healthy business environment. Only 104 locations (about 0.3%) experience any form of closure or delay.
What are the Current Trends in Coffee Pricing Across the US?
Coffee prices across the US show a consistent upward trend, rising from $3.25 in January 2024 to $3.50 by May 2025. This represents a steady climb over 16 months with prices stabilizing around $3.50 in early 2025.
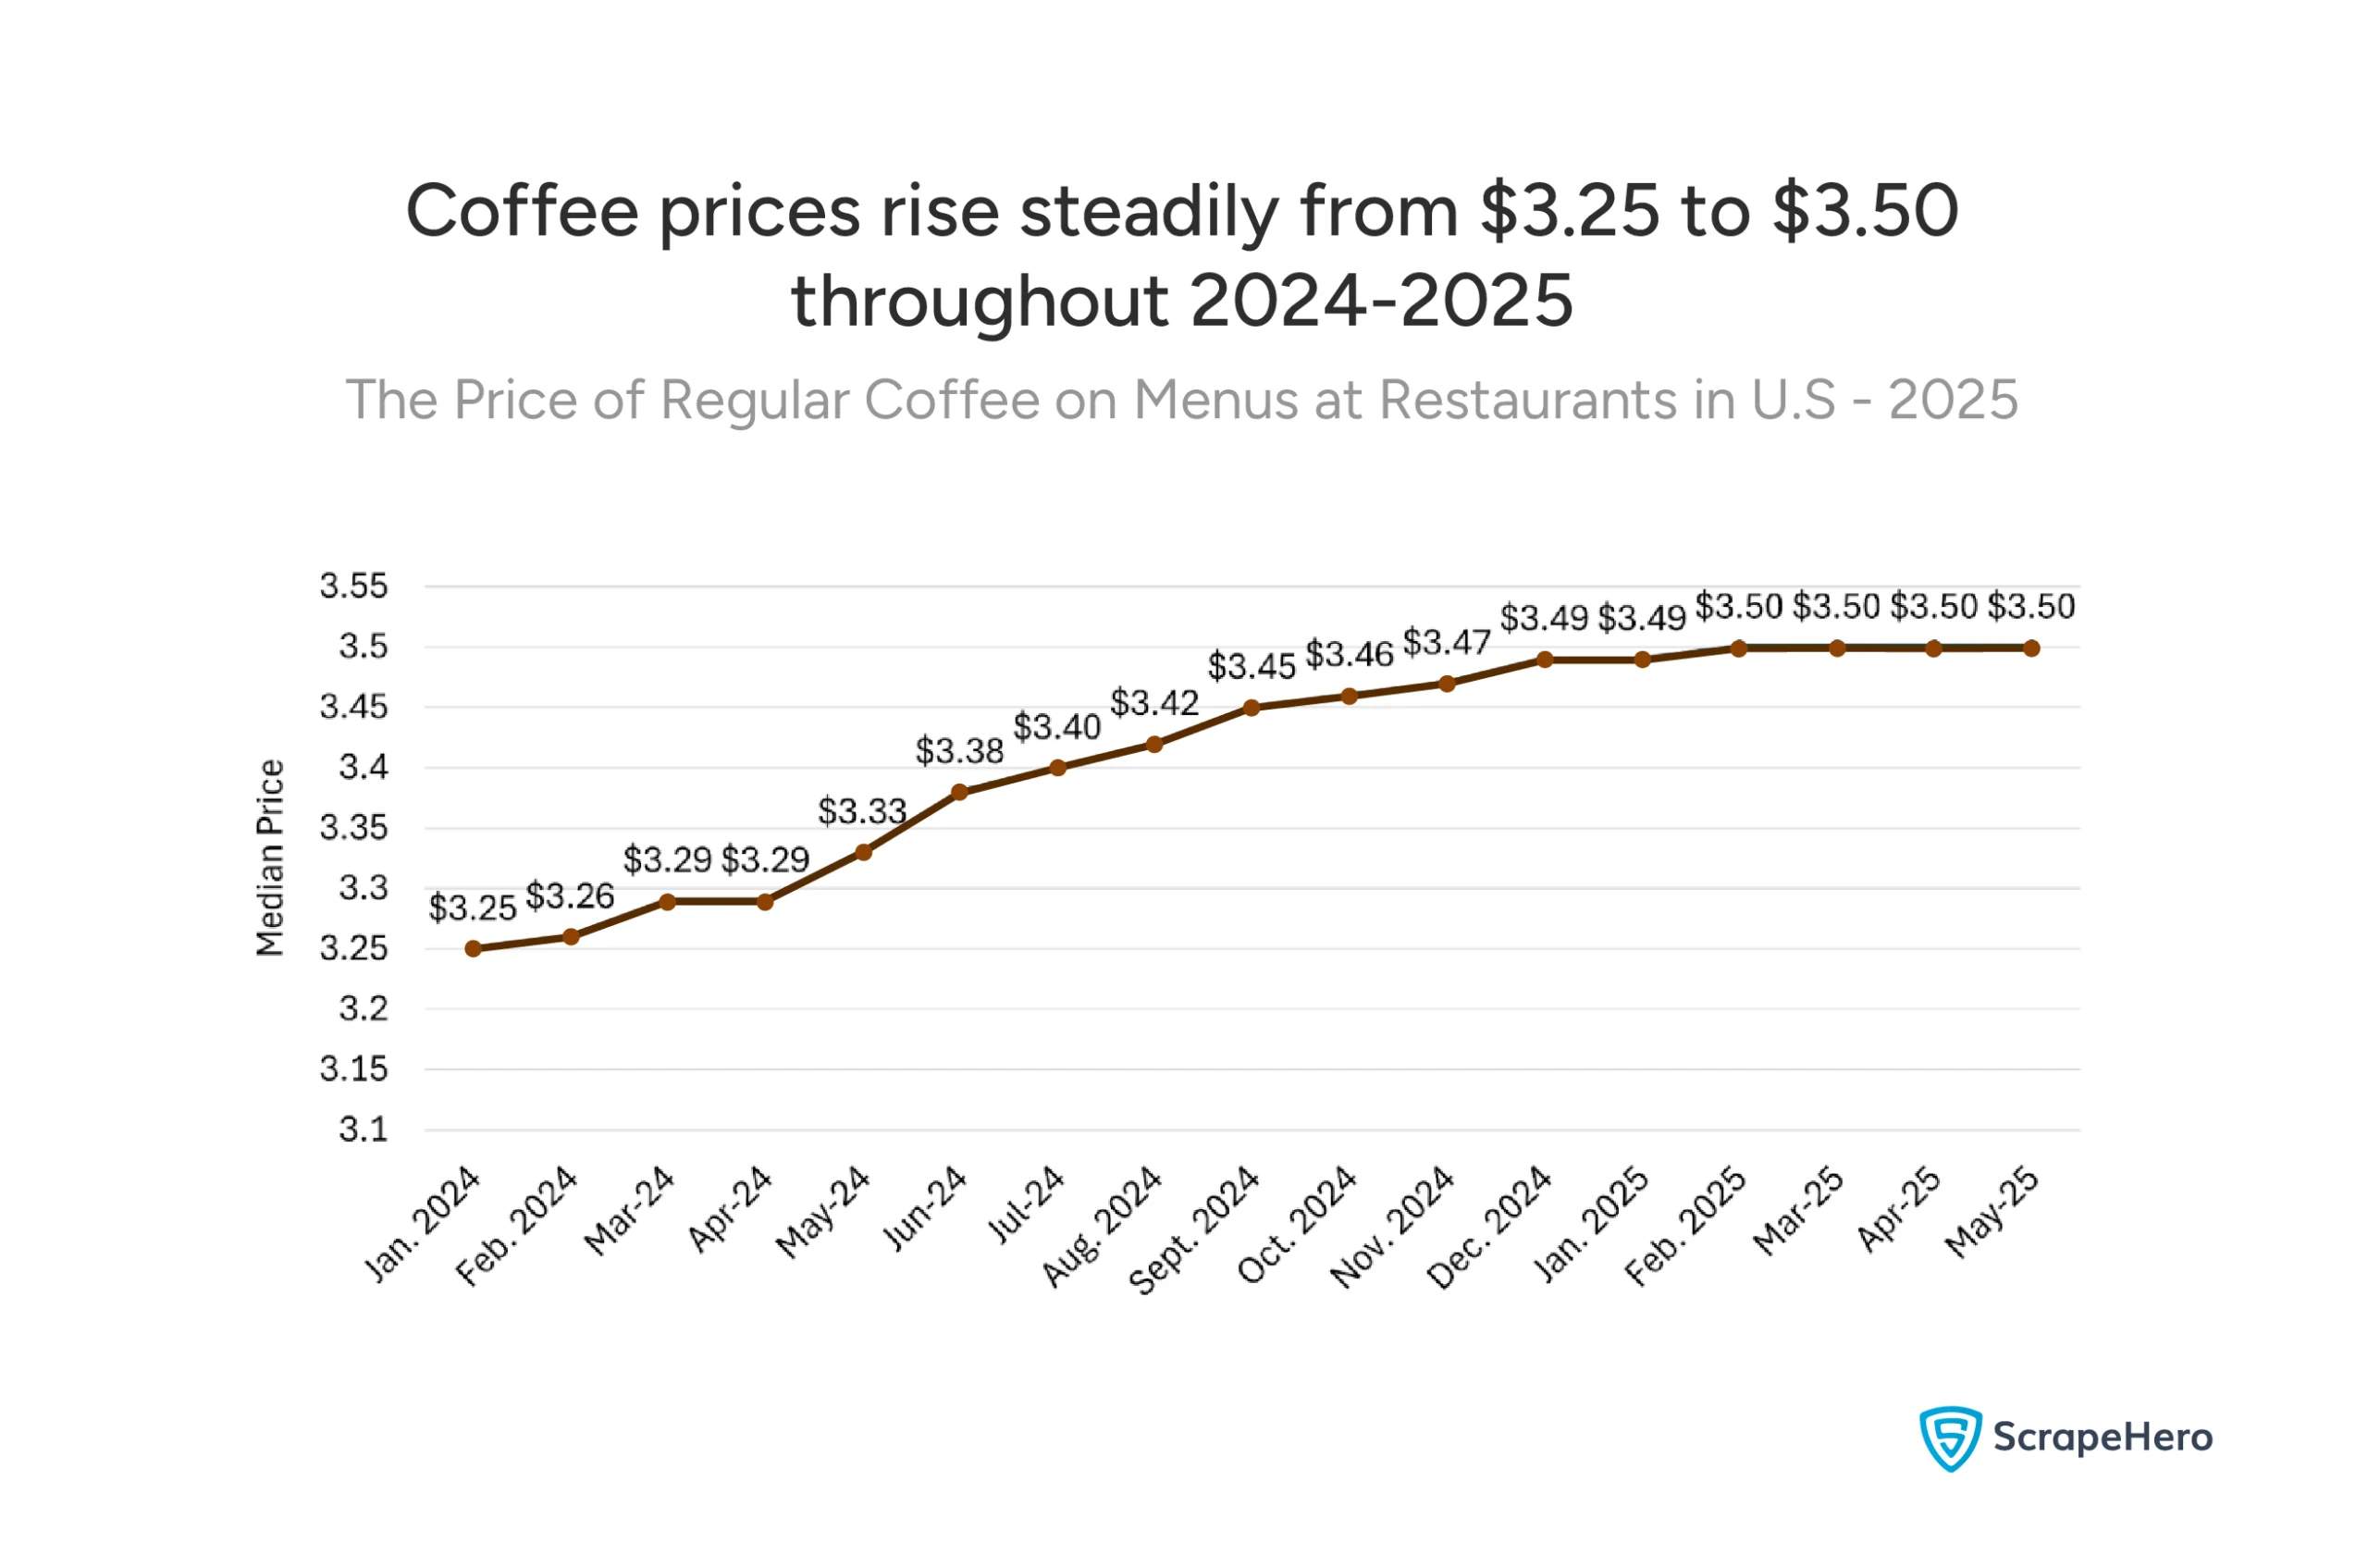
The data shows a total increase of $0.25 over 16 months, which equals roughly 7.7% growth. Most of the increase happened gradually throughout 2024, with prices leveling off at $3.50 in 2025.
What is Our Conclusion About the US Coffee Shop Landscape from Our Analysis?
The US coffee shop industry statistics paint a picture of stability and growth potential. With nearly three-quarters of Americans drinking coffee daily and a market projected to reach $28.94 billion by 2030, it is a strong market.
Key Takeaways for the Industry:
- Massive, loyal customer base – 89% of Americans drink coffee at least weekly, creating predictable revenue streams
- Concentrated market leadership – Starbucks’ 17,137 locations dwarf competitors
- Geographic opportunities – Even major chains like Dunkin haven’t reached all 50 states, creating openings for expansion
- Operational health – Over 99% of coffee shops remain open
- Steady pricing power – Coffee prices have risen 7.7% over 16 months to $3.50, showing consumers accept gradual increases
The coffee shop landscape in America is built on habits so ingrained that they create one of the most dependable consumer markets in the country. For existing operators and potential entrants alike, these statistics show an industry with staying power and room for growth.
Data sources: ScrapeHero DataStore POI analysis, Mordor Intelligence market research, and industry surveys conducted January 2024-May 2025.
How to Get the Data for an Analysis Effortlessly?
The most effortless way to get data for an analysis is to outsource to a web scraping service like ScrapeHero.
ScrapeHero Data Store monitors thousands of brands globally for store openings, store closures, parking availability, in-store pickup options, services, subsidiaries, nearest competitor stores and much more.
However, outsourcing with ScrapeHero’s web scraping service is the smarter choice if you require custom data extraction, complex web navigation, or simply want to save time.
We are among the top 3 web scraping service providers globally. And since we are a full-service data provider that handles everything, including data collection, accuracy, and delivery, you don’t need software, hardware, or scraping expertise. Instead, you can focus on using data for your business, not extracting it.
Connect with ScrapeHero today.
Report by ScrapeHero using publicly available data. This report is independent and not affiliated with any coffee shop brands.